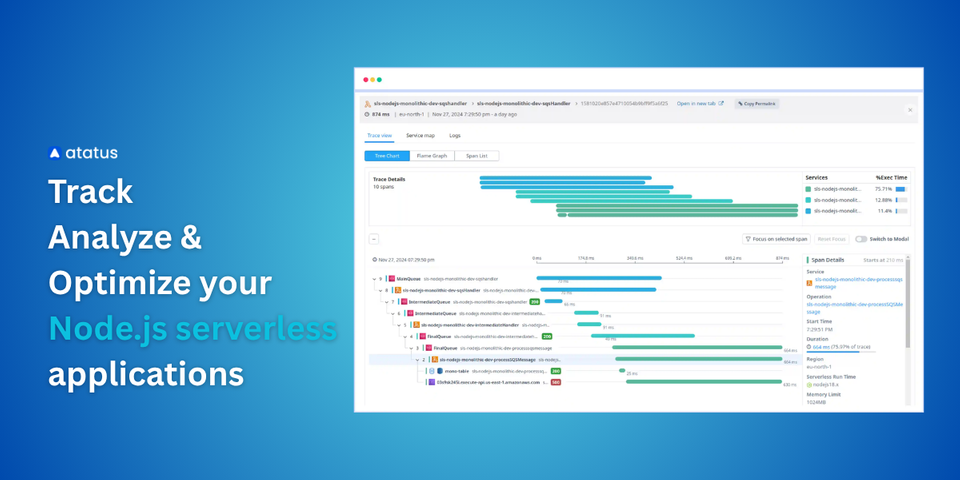
Serverless Monitoring: Essential Metrics Every Developer Should Track
Serverless applications have become one of the most efficient ways to build and deploy software. With platforms like AWS Lambda, Azure Functions, and Google Cloud Functions, teams can focus on writing code while the provider handles infrastructure, scaling, and availability.
But going serverless doesn’t mean monitoring stops being important. In fact, monitoring becomes even more critical because you don’t have direct control over the servers, containers, or VMs. To ensure your serverless applications stay fast, reliable, and cost-efficient, you need to track specific metrics.
In this blog, we will explore the key metrics every developer, DevOps engineer, and SRE should monitor in serverless applications. We will break them down into Performance Metrics, Reliability Metrics, Resource Utilization Metrics, and Cost Metrics, with explanations of why they matter and how they can guide optimization.
This post shows,
- Why Monitoring Serverless Metrics Matters
- Key Metrics to Track in Serverless Applications
- Monitor Your Serverless Applications with Atatus
Why Monitoring Serverless Metrics Matters
Unlike traditional apps, serverless applications run as separate functions that start and stop automatically based on user demand. This dynamic nature makes visibility harder.
Monitoring these key metrics helps you:
- Detect performance bottlenecks before users notice.
- Troubleshoot errors quickly without full server logs.
- Optimize memory and concurrency usage to reduce costs.
- Avoid unexpected billing surprises by tracking usage and resource consumption.
- Deliver a consistently smooth user experience.
Key Metrics to Track in Serverless Applications
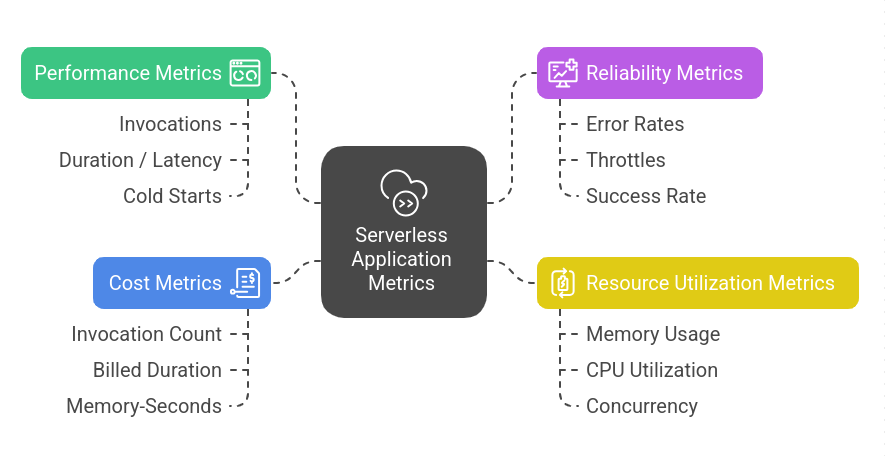
Performance Metrics
Performance is at the core of user experience. In serverless, it’s about how quickly functions execute and respond.
- Invocations
The number of times your serverless function is executed. Tracking invocations helps you understand application usage patterns. A sudden spike could indicate growing user traffic or a potential bug triggering unnecessary executions. A sudden drop might signal an outage or broken integration.
Example: If your login function averages 1,000 invocations per day and suddenly jumps to 10,000, you need to check if it’s organic traffic growth or a runaway script making repeated calls.
- Duration / Latency
The execution time of each invocation, usually measured in milliseconds. High latency directly impacts user experience. Monitoring duration helps identify functions that are too slow and may need optimization or caching.
Example: An image-processing function taking 3 seconds instead of 300ms could frustrate users waiting for uploads to complete. By measuring latency, you can pinpoint bottlenecks like inefficient code or dependency calls.
- Cold Starts
The delay that occurs when a function is invoked for the first time (or after being idle), as the platform provisions resources. Cold starts add unpredictable latency, especially noticeable in low-traffic functions. Tracking them helps you decide if you need to optimize deployment package size, adjust memory, or keep functions ready.
Example: A payment function experiencing 1–2 seconds of cold start delay during checkout could impact conversion rates.
Reliability Metrics
Performance alone is not enough, reliability ensures functions execute successfully under different conditions.
- Error Rates
The percentage of invocations that fail due to exceptions, timeouts, or misconfigurations. High error rates degrade application health and user trust. Tracking them allows you to spot recurring issues, like misconfigured environment variables or failing third-party APIs.
Example: If 5% of checkout transactions fail due to API timeout, revenue and customer trust are directly impacted.
- Throttles
Instances where the cloud provider blocks function execution because concurrency limits are exceeded. Frequent throttles signal that your application is hitting scaling limits. This can cause requests to be delayed or dropped, leading to downtime.
Example: A flash sale generating thousands of orders per minute may hit concurrency limits, leading to throttled requests and lost sales.
- Success Rate
The percentage of successful executions out of total invocations. Success rate provides a quick health snapshot. A drop indicates widespread problems that need immediate investigation.
Example: If your notification service has a success rate of 98% instead of 100%, 2% of users may not receive critical alerts.
High error rates, throttles, or low success rates can disrupt your application and impact users. Atatus gives you real-time visibility into function reliability so you can quickly detect, troubleshoot, and prevent failures.
Ensure Your Functions Always Run SmoothlyResource Utilization Metrics
Serverless doesn’t mean unlimited resources. Functions still consume memory, CPU, and concurrency. Monitoring these helps balance performance and cost.
- Memory Usage
The amount of memory consumed during execution. If your function exceeds allocated memory, it crashes. Too much unused memory means you’re overpaying. Optimizing memory ensures both stability and efficiency.
Example: A function allocated 512MB but using only 100MB wastes resources. Reducing it to 128MB lowers costs without performance impact.
- CPU Utilization
Processing power consumed by functions (where available). High CPU usage may indicate heavy computation tasks or inefficient code. Monitoring it ensures you provision the right memory (since CPU scales with memory).
Example: A video-processing function at 90% CPU may need higher memory allocation to reduce execution time and avoid timeouts.
- Concurrency
The number of simultaneous function executions. Tracking concurrency ensures your application can handle traffic spikes without hitting limits. It also helps plan scaling strategies.
Example: During a product launch, concurrency spiking beyond limits could cause throttled or dropped requests. Monitoring helps you fix issues before they cause failures.
💡 If you want to dive deeper into serverless monitoring, check out our detailed guide on Top Serverless Monitoring Tools in 2025. It covers the most popular platforms, their key features, and helps you choose the right monitoring solution for your serverless workloads.
Cost Metrics
One of the biggest attractions of serverless is its pay-per-use model. But costs can grow unexpectedly if you don’t monitor usage closely.
- Invocation Count
The total number of executions. Since providers charge per invocation, this metric directly impacts your bill. Monitoring ensures you don’t pay for unnecessary or redundant calls.
Example: A bug causing a loop that calls a function repeatedly could skyrocket your bill overnight.
- Billed Duration
The time your provider charges for, rounded up to the nearest billing unit (e.g., 100ms in AWS Lambda). Optimizing billed duration reduces costs. Functions that run longer than necessary increase expenses.
Example: A function that finishes in 320ms is billed as 400ms. Optimizing logic could save money across millions of invocations.
- Memory-Seconds
A billing unit calculated as allocated memory x execution duration. This metric helps you understand how memory allocation affects cost. Right-sizing functions keeps expenses predictable.
Example: A function running for 2 seconds with 1GB memory costs double compared to the same function running with 512MB.
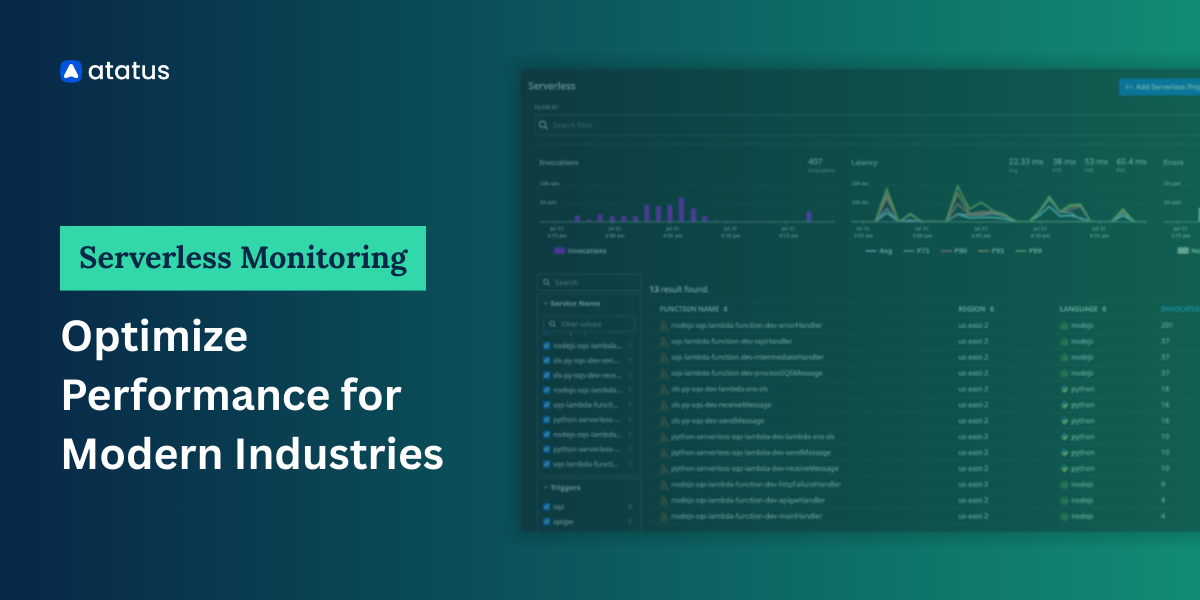
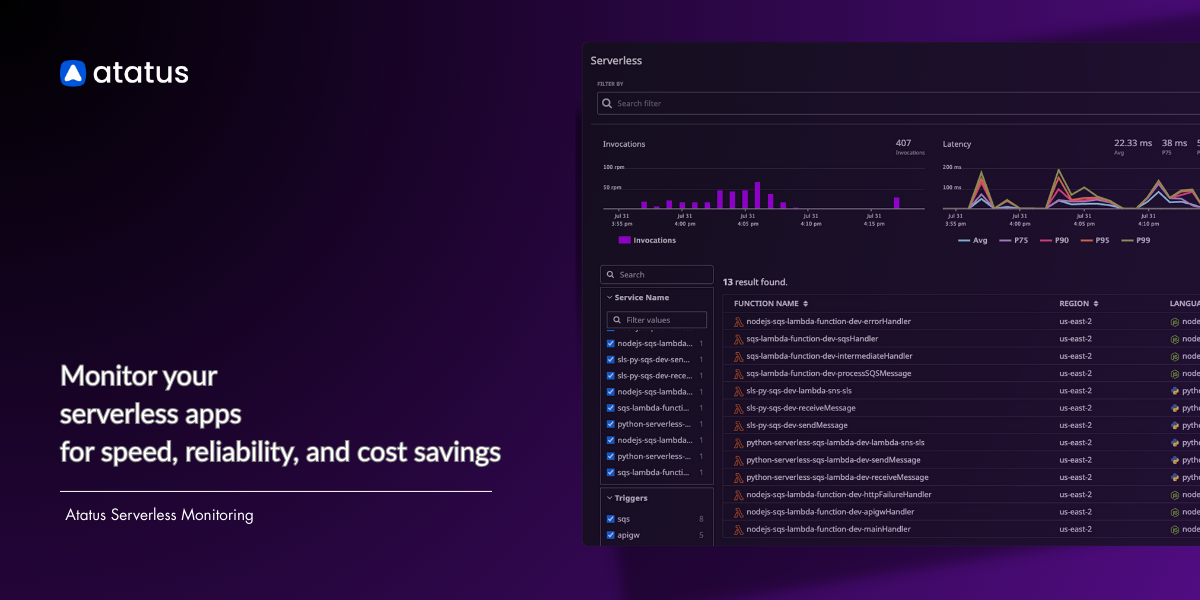
Monitor Your Serverless Applications with Atatus
Managing all these metrics manually can be complex. That’s where Atatus Serverless Monitoring makes the difference.
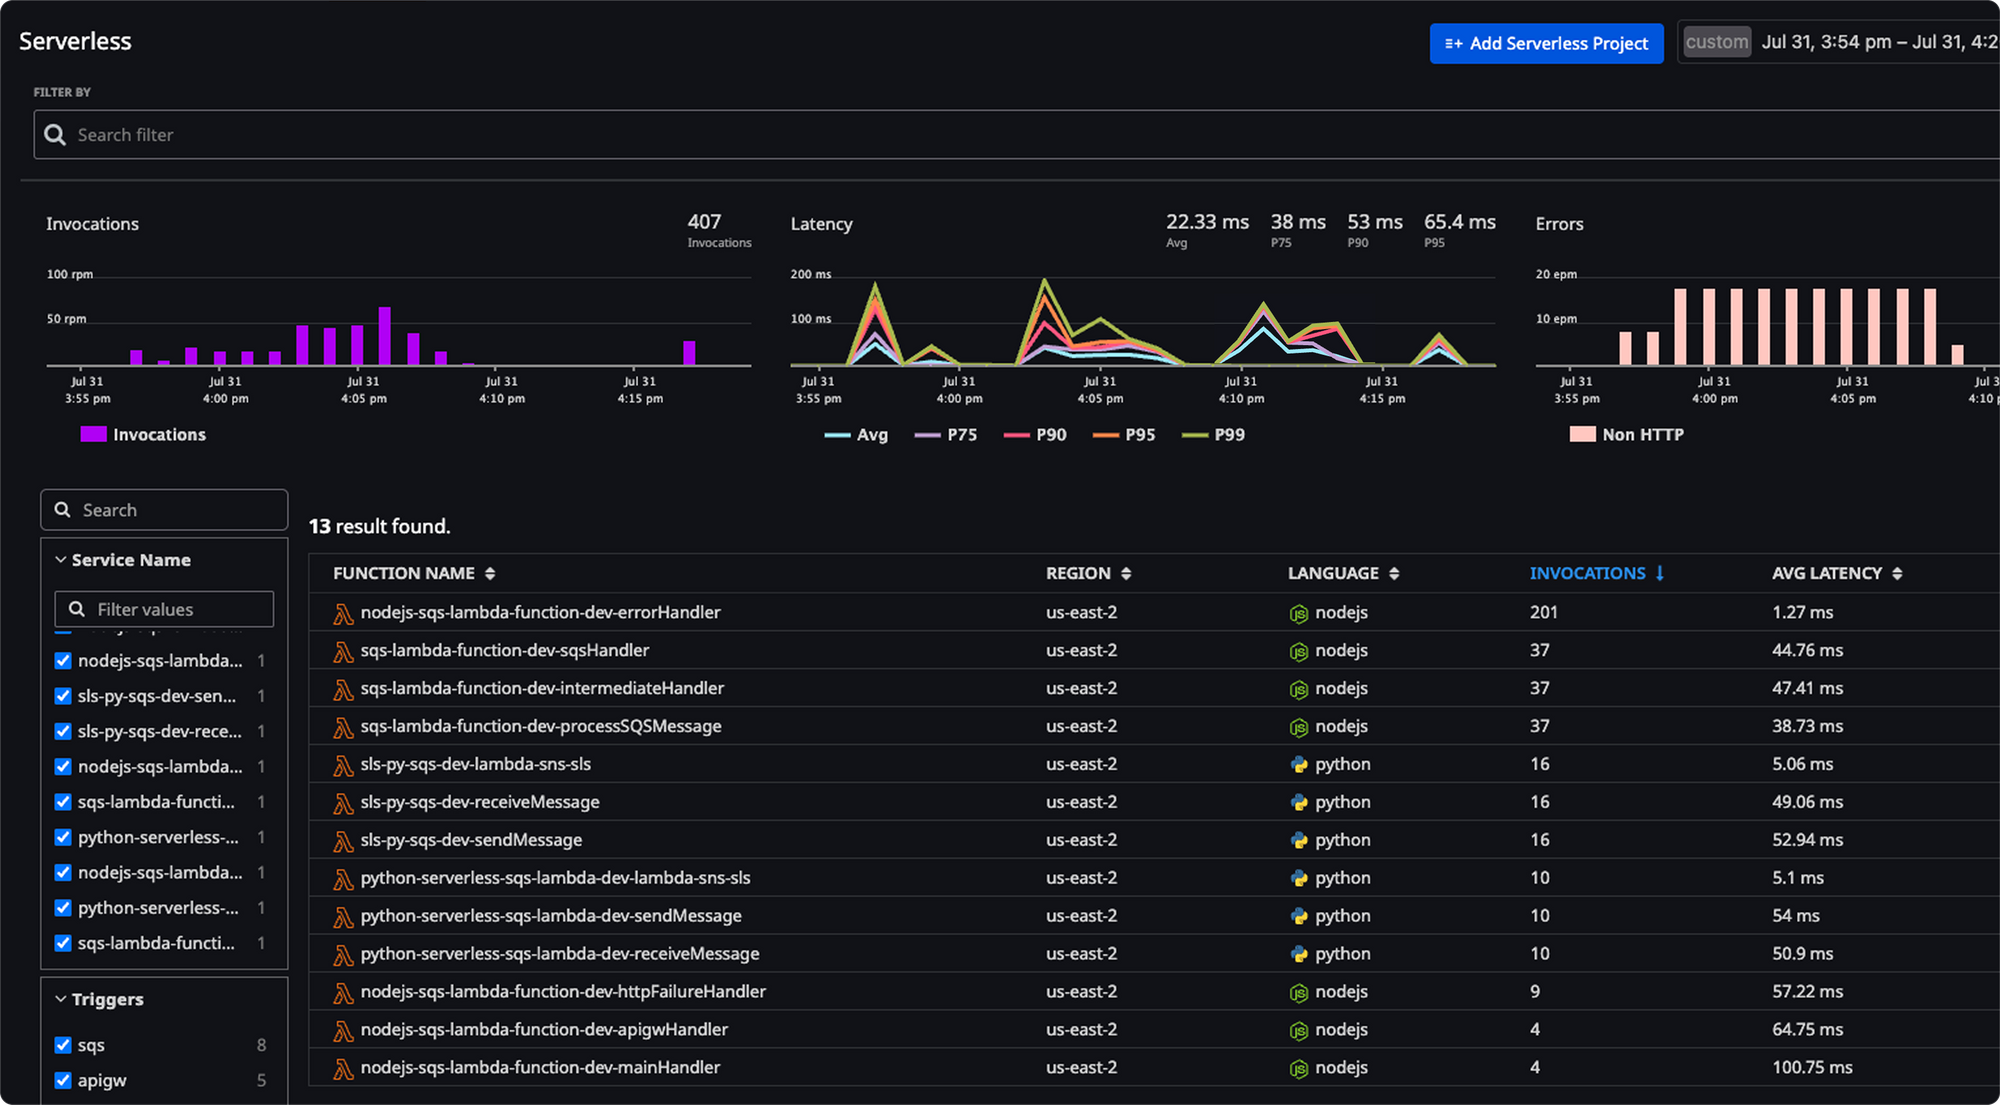
With Atatus, you get:
- End-to-End Visibility – Monitor all critical serverless metrics in one place, including invocations, duration/latency, cold starts, error rates, throttles, memory usage, CPU utilization, concurrency, and cost-related metrics.
- Real-Time Alerts – Get notified instantly when error rates spike, throttles occur, or functions slow down.
- Cost Optimization Insights – Understand billed duration, memory-seconds, and usage patterns to keep expenses under control.
- Seamless Integration – Works with AWS Lambda and other serverless platforms without complicated setup.
Next Step!
Take full control of your serverless applications with Atatus. Monitor all key metrics—performance, reliability, resource usage, and costs—in one unified platform. Get real-time alerts, deep insights, and actionable data to optimize every function and deliver a seamless user experience.
Explore How Atatus Can Help#1 Solution for Logs, Traces & Metrics
![]() APM
APM
![]() Kubernetes
Kubernetes
![]() Logs
Logs
![]() Synthetics
Synthetics
![]() RUM
RUM
![]() Serverless
Serverless
![]() Security
Security
![]() More
More