
Serverless Monitoring
Atatus gives you deep, real-time visibility into every AWS Lambda, Azure Functions, and Google Cloud Functions invocation including duration, memory, status, cold starts, and distributed traces in one unified view.
200+
Frameworks Supported
<15min
Avg Setup Time
99.9%
Platform Uptime SLA
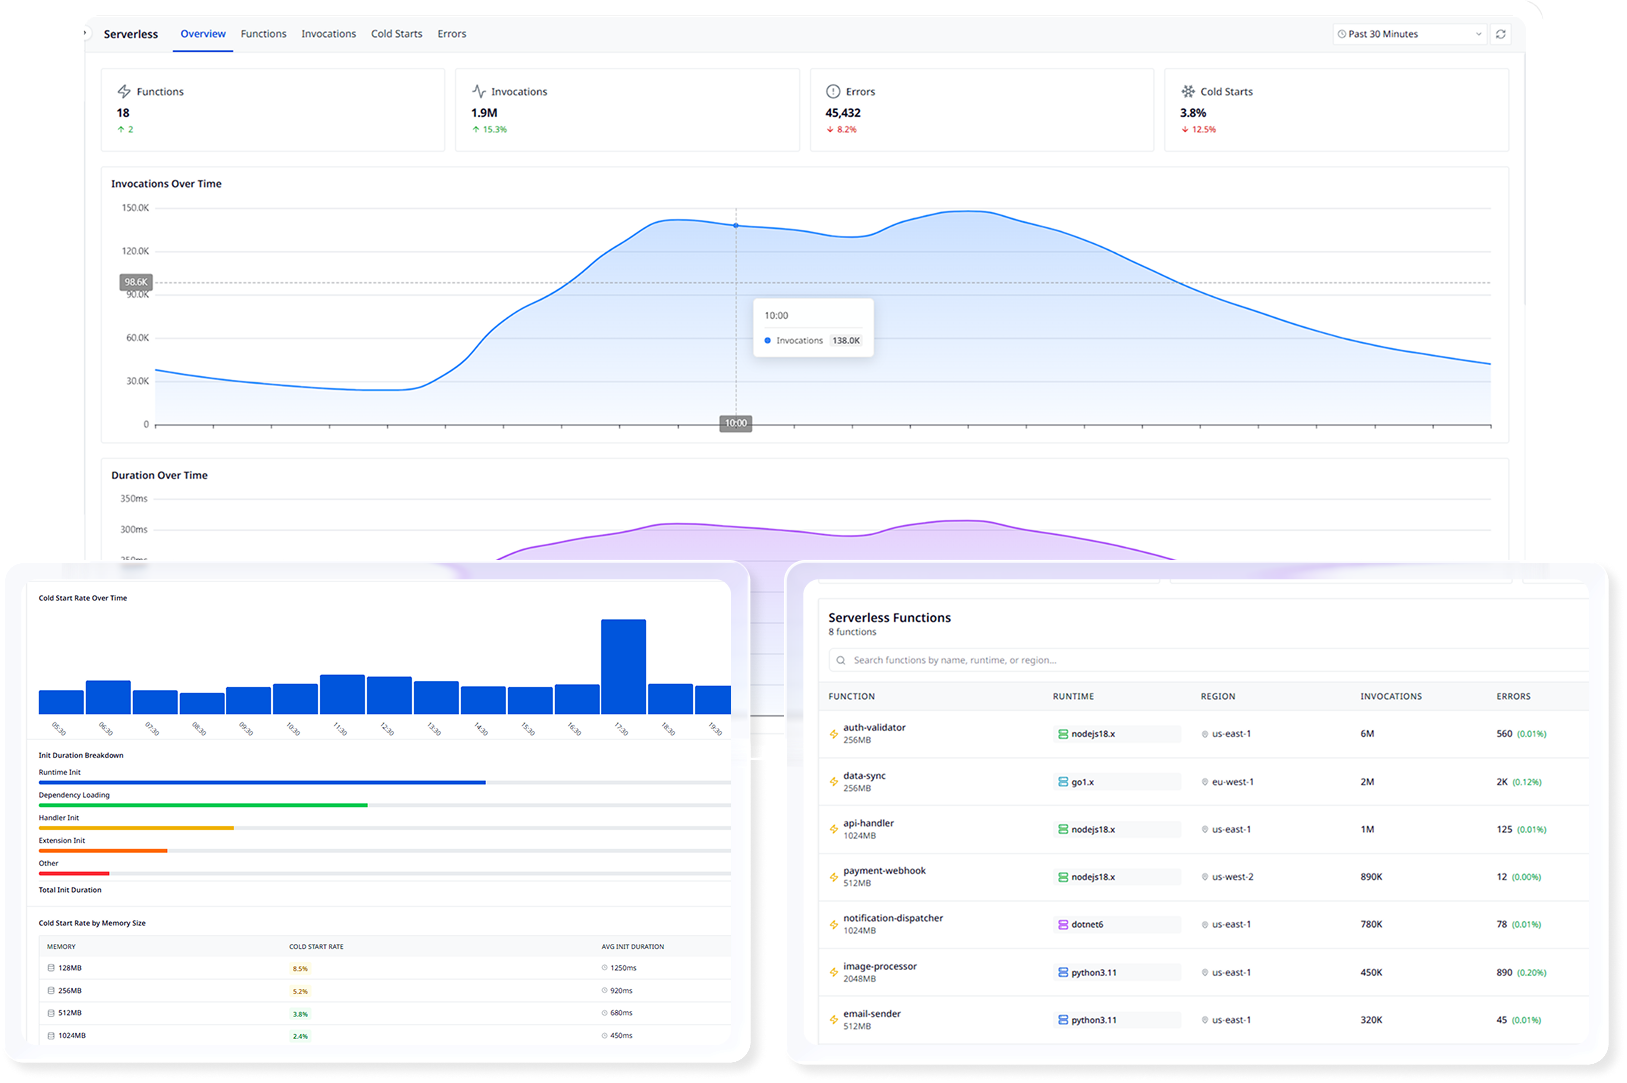
What You See in the Invocations Dashboard?
Every row in the Atatus Invocations view is a complete, actionable record. Here's what each column gives you and why it matters.
Invocation-Level Observability
Every function call is captured as a structured event like request ID, duration, billed time, memory used, status, and cold start flag with no sampling on errors or timeouts.
Distributed Tracing Across Async Boundaries
Atatus propagates trace context through SQS, SNS, EventBridge, DynamoDB Streams, and API Gateway automatically, giving you end-to-end visibility across your entire serverless workflow.
Memory Right-Sizing Intelligence
Per-invocation memory data drives automated recommendations. Stop guessing at allocation, Atatus shows exactly what your functions consume and what you can safely reduce.
Intelligent Alerting via Watchtower
Atatus uses Watchtower for log-based alerting, sending structured alerts to Slack, PagerDuty, OpsGenie, and more when error rates spike, timeouts occur, or memory usage exceeds thresholds.
Zero-Overhead Instrumentation
Auto-instrumentation with async telemetry flushing adds less than 1ms average overhead. Your function's response path is never blocked by monitoring.
Cold Start Detection & Optimization
Automatically detect cold starts, surface frequency heatmaps, and get concrete recommendations for provisioned concurrency, reducing cold starts by up to 70%.
Complete Serverless Function Visibility
From cold starts to cost optimization, everything you need for serverless success.
Trace Every Request Across Services
Follow a single request end-to-end as it travels through your entire distributed architecture across APIs, microservices, and third-party integrations with full context at every hop.
- Follow a single request as it flows across services, APIs, and dependencies in real time
- Instantly identify which service or span is slowing down the request and by how much
- Compare execution time across all services to pinpoint latency hotspots before they escalate
- Debug complex distributed systems without guessing or switching between multiple tools
Get Real-Time Visibility Into Serverless Performance
Monitor every invocation as it happens. Understand the health of your functions with live metrics, percentile breakdowns, and automatic anomaly detection that alerts you before users are affected.
- Monitor serverless invocations, latency percentiles, and error rates in real time with zero config
- Understand cold starts, execution duration, and throughput patterns across every function
- Detect performance regressions before they propagate to downstream services and customers
- Troubleshoot failures with full execution context, request payloads, and environment details
Visualize How Your Services Interact
See a live, auto-generated map of your entire service topology. Understand exactly how requests flow, where traffic concentrates, and which dependencies are healthy without writing a single line of config.
- See a live map of service dependencies and request flows updated in real time automatically
- Understand how latency, errors, and traffic propagate across services and service boundaries
- Quickly isolate failing or overloaded services in complex multi-service architectures at a glance
- Gain clarity into system behavior without manually mapping dependencies or reading docs
Who Uses Atatus Serverless Monitoring?
Whether you're debugging a live incident, optimizing costs, or hardening a production pipeline. Atatus gives every team the invocation data they need.
E-commerce & High-Concurrency APIs
Order processing, payment webhooks, and cart functions can't afford timeouts or cold start spikes. Monitor every invocation to detect and resolve latency issues before they hit checkout conversion rates.
Fintech & Payment Processing
Failed or timed-out payment invocations need immediate root cause access. Error tracking with full stack traces and request context makes compliance audits and incident response faster and more reliable.
Data Pipelines & ETL Functions
Long-running ETL Lambda functions that approach the 15-minute timeout need invocation-level duration and memory tracking. Catch runaway jobs before they breach limits and corrupt downstream data.
Healthcare & Regulated Workloads
Audit trails, error logging, and invocation records are compliance requirements. Atatus captures every invocation with full context and supports on-premises deployment for data sovereignty.
SaaS Platforms Scaling Fast
As your user base grows, so does Lambda invocation volume. Atatus scales with you and giving you per-function cost breakdowns and memory right-sizing to keep infrastructure costs in check as you grow.
Event-Driven & IoT Architectures
Functions triggered by S3 events, DynamoDB Streams, SNS, or IoT rules need context from the originating event. Atatus traces the full event chain, not just the Lambda execution itself.
Serverless Monitoring in Under 5 Minutes
Three simple steps to complete serverless observability. No credit card required.
Install the SDK
Add Atatus SDK to your serverless functions. Supports AWS Lambda, Azure Functions, and Google Cloud Functions with minimal code changes.
Auto-Instrument Functions
Automatically captures execution metrics, cold starts, errors, and traces without manual instrumentation. Works out of the box.
Monitor & Optimize
Access real-time dashboards to track function performance, reduce cold starts, and optimize costs with actionable insights.
Our Lambda functions were silently timing out during peak traffic. We had no visibility into cold starts or invocation failures. With Atatus Serverless Monitoring, we pinpointed a memory under-provisioning issue causing 60% of our functions to breach the 3s threshold. After right-sizing and fixing our handler logic, cold start duration dropped from 2.8s to 340ms and our error rate fell from 12% to under 0.4%."