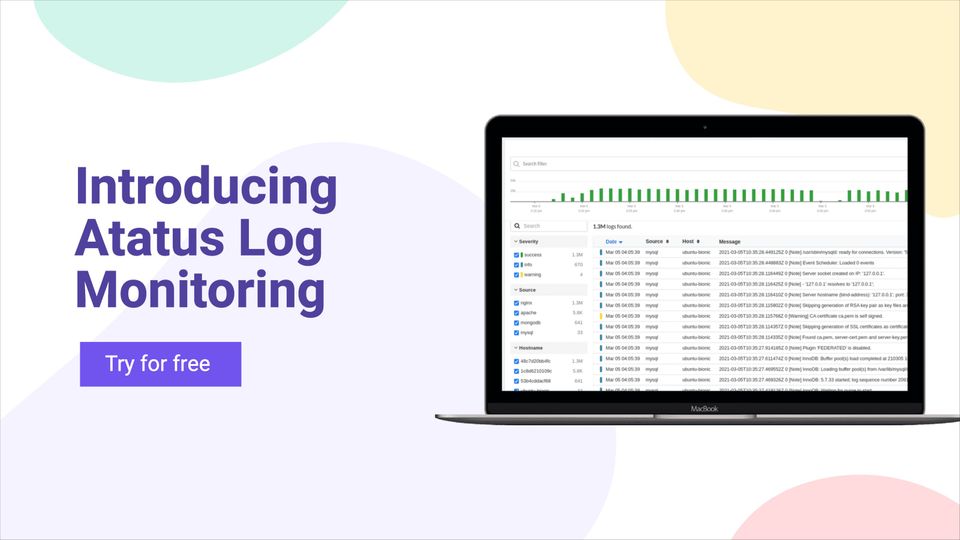
Log Monitoring is a crucial step in ensuring to know what’s happening in all your servers from a single location. We are introducing Atatus Log Monitoring. Get to know the features we offer and start monitoring your logs to resolve the errors as soon as possible.
Collect and analyze data about the infrastructure/server wit Infrastructure Monitoring. Using this data, you can monitor the performance and the behavior of the hosts at the infrastructure level. Try it for free.
Now Deployment tracking is available for both APM and Browser products in Atatus. The deployment tracking is one of the most awaited feature in Atatus. Know the reason behind it!!
Measure the speed and performance of your website for delivering better end-user experience to your customers using Browser Monitoring. Know what are the features available and starytmonitoring your services.
As a web developer you might want to improve your site's performance and one sure short way to do it is to minify your JavaScript. Learn more about it in this blog.
Atatus want to be the service which will give the complete status of your application. Get to know the front-end errors that user faces with our new feature Real User Monitoring.
Monitor your entire software stack
Gain end-to-end visibility of every business transaction and see how each layer of your software stack affects your customer experience.