Top Distributed Tracing Tools in 2026: Updated Market Review with Cost Comparison

The distributed tracing landscape has evolved from “observability add-on” to core production infrastructure.
In 2026, distributed tracing is no longer optional for engineering teams operating microservices, Kubernetes, or AI-driven workloads. It is now tightly coupled with incident response, cost optimization, and AI-assisted debugging.
The global distributed tracing market continues its rapid expansion, projected to exceed $2.5B by 2032, driven by cloud-native adoption, platform engineering, and AI-powered observability.
This updated guide expands on earlier analysis with new market realities, tooling shifts, and ROI insights to help engineering leaders make high-confidence decisions.
What's in this article?
- What’s Changed in Distributed Tracing (2026)
- Top Distributed Tracing Tools 2026
- Advantages of Distributed Tracing Tools
What’s Changed in Distributed Tracing (2026)?
OpenTelemetry Is No Longer a Trend - It’s the Default
In 2026, OpenTelemetry is no longer “emerging.” It is the default foundation for observability.
- Jaeger v1 is fully deprecated
- Most vendors are OpenTelemetry-native
- SDK fragmentation has largely disappeared
What this means in practice:
- No more vendor-specific instrumentation
- Switching tools is significantly easier
- Observability architecture is now portable by design
This shift has fundamentally changed buying behavior. Teams now evaluate tools based on experience, cost, and analytics capabilities, not instrumentation lock-in.
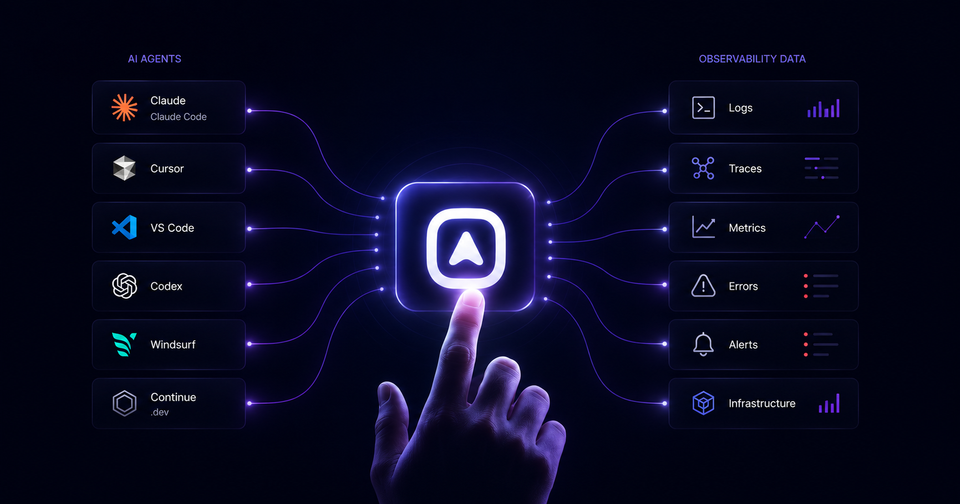
AI + Observability Convergence
Modern distributed tracing tools now integrate AI in meaningful ways:
- Automatic anomaly detection across traces
- Suggested root causes during incidents
- Pattern recognition across services
- Natural language querying for debugging
This transforms tracing from a passive visualization layer into an active debugging assistant. Instead of manually analyzing traces, engineers are increasingly guided toward root causes.
Pricing Pressure Is Reshaping the Market
If there’s one consistent theme across teams in 2026, it’s this:
“We didn’t expect observability to become one of our largest infrastructure costs.”
Common patterns:
- Datadog bills increasing 2–3x after enabling advanced features
- High-cardinality data driving unexpected costs
- Engineering teams forced to optimize telemetry volume
As a result:
- Pricing transparency is now a key evaluation factor
- Usage-based pricing models are preferred
- Sampling strategies are actively optimized
Hybrid Observability Architectures Are Rising
Instead of choosing one tool, many teams now adopt:
- Open-source backend (cost control)
- SaaS layer (ease of use)
This hybrid approach balances cost, flexibility, and developer experience.
Top Distributed Tracing Tools
The best tracing tools can accelerate incident recovery and help you get rid of performance bottlenecks. It's crucial to pick a distributed tracing solution that exactly meets your company's needs.
Here are top 10 tools for achieving end-to-end tracing for your business are:
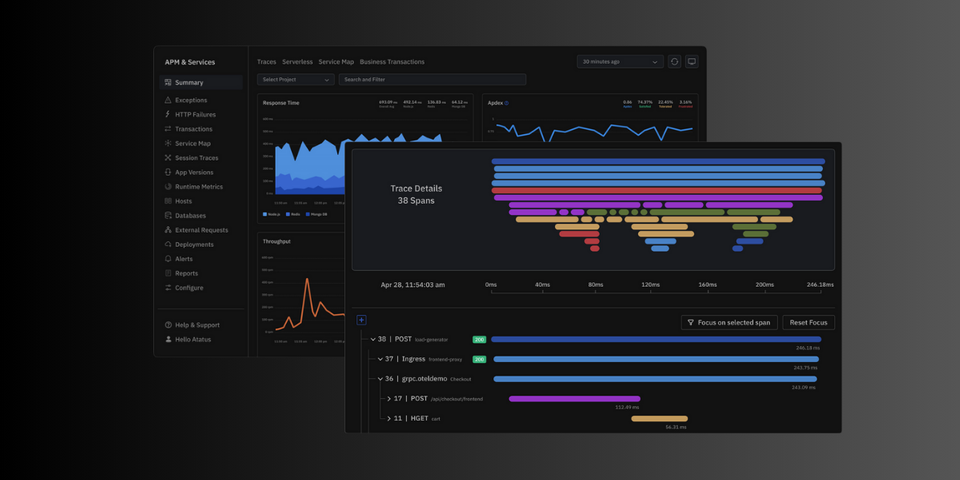
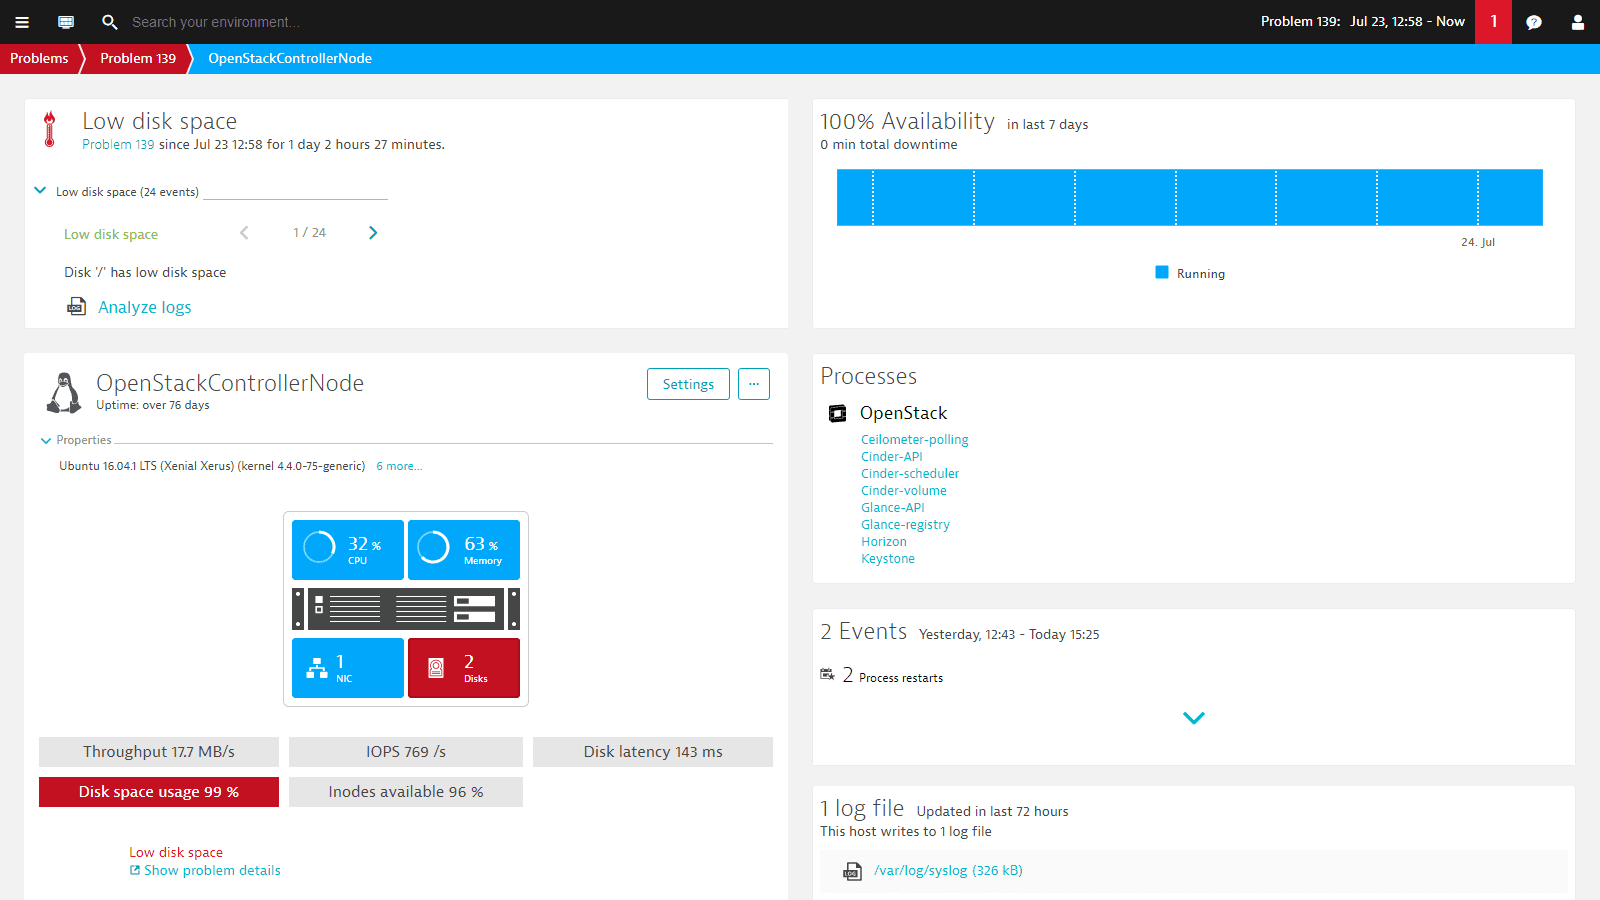
1. Atatus
Atatus is a distributed tracing tool that helps developers monitor, troubleshoot, and optimize their applications by providing detailed insights into how requests flow through a distributed system.
With Atatus, developers can trace a request's journey from the client to the server and from server to server, identifying bottlenecks and performance issues along the way. Atatus provides real-time data visualization and analytics, enabling developers to identify and resolve issues that can impact user experience quickly.
Advantages:
- End-to-end visibility
- Faster troubleshooting and resolution
- Improved performance optimization
- Root-cause analysis
- Simple setup process
- Easy integrations with notification channels
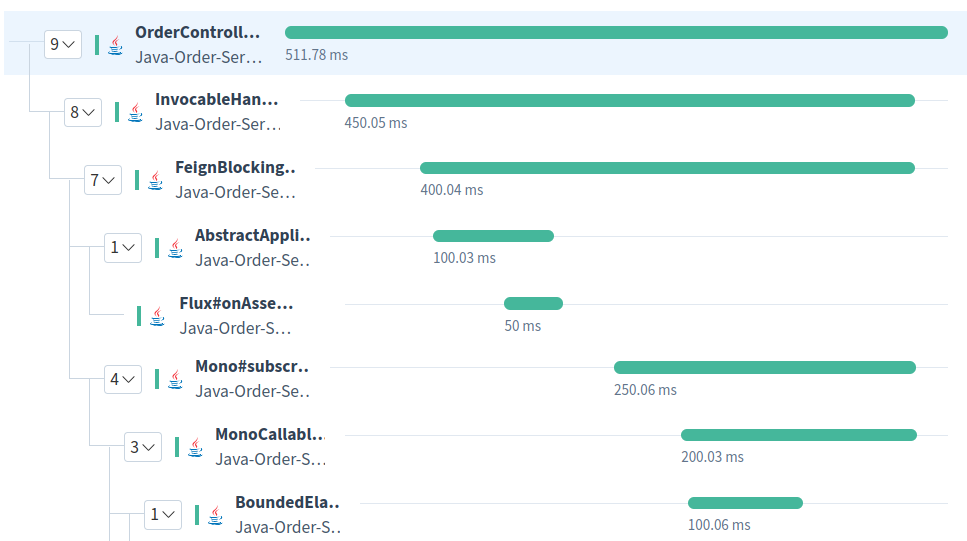
2. SigNoz
SigNoz is a free and open-source APM. It aids in application monitoring & problem-solving for developers. SigNoz provides a uniform UI for metrics and traces so that there is no need to jump between multiple tools such as Jaeger and Prometheus.
Advantages:
- Support for Native OpenTelemetry
- Rich interface with charts
- Metrics offers a bespoke user interface and a Prometheus backend.
- Visualization of traces using Gantt charts and Flame graphs
- Filters as per tags, status codes, service names, operations, etc.
- Alarms
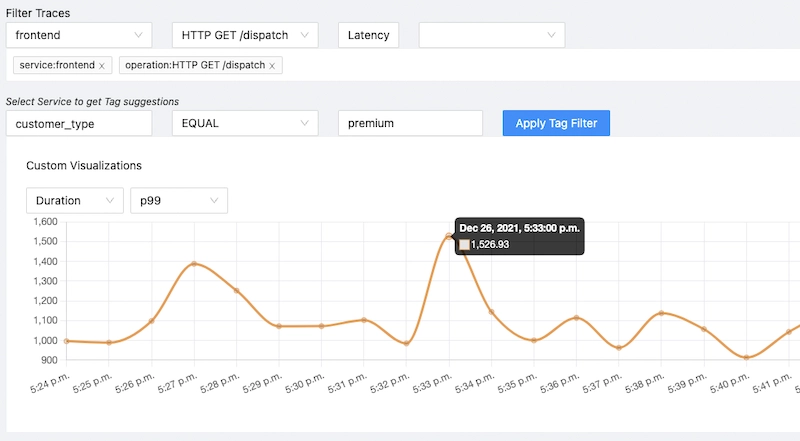
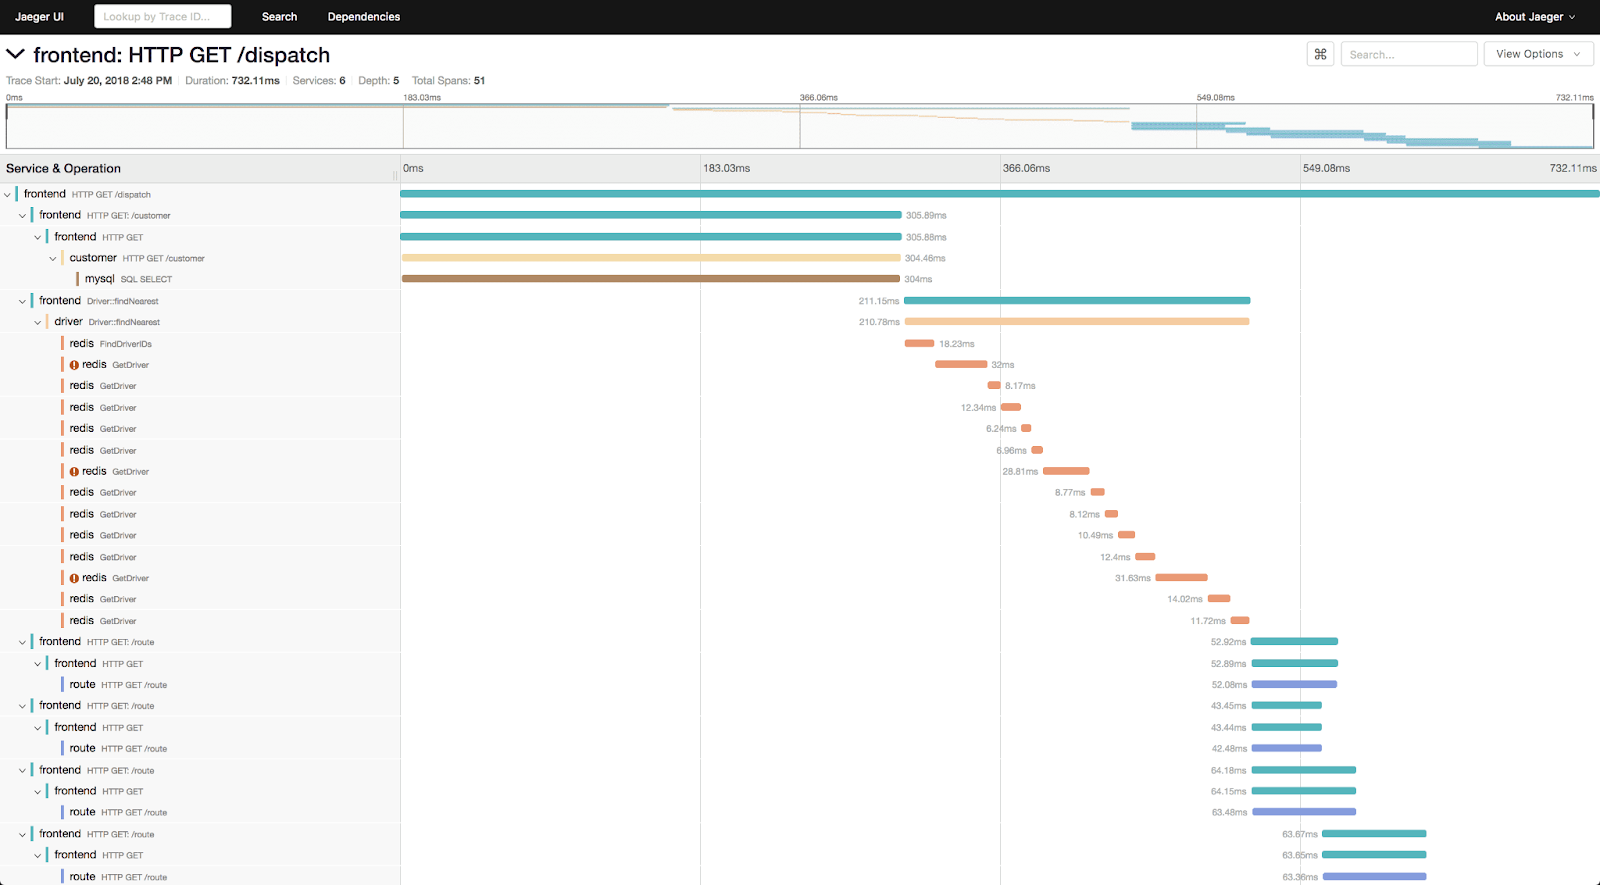
3. Jaeger
Uber Technologies developed the distributed tracing technology known as Jaeger. It can be used to monitor distributed systems with microservices.
Jaeger's visibility into the request flow between microservices allows developers to analyse their applications' performance and behaviour.
To assist developers in locating performance bottlenecks and problems, it collects timing data and logs from several services and presents them in a single view.
Advantages:
- Solid and renowned project
- Adaptive sampling
- Multiple DBMS support via plugins
- Sponsored by CNCF
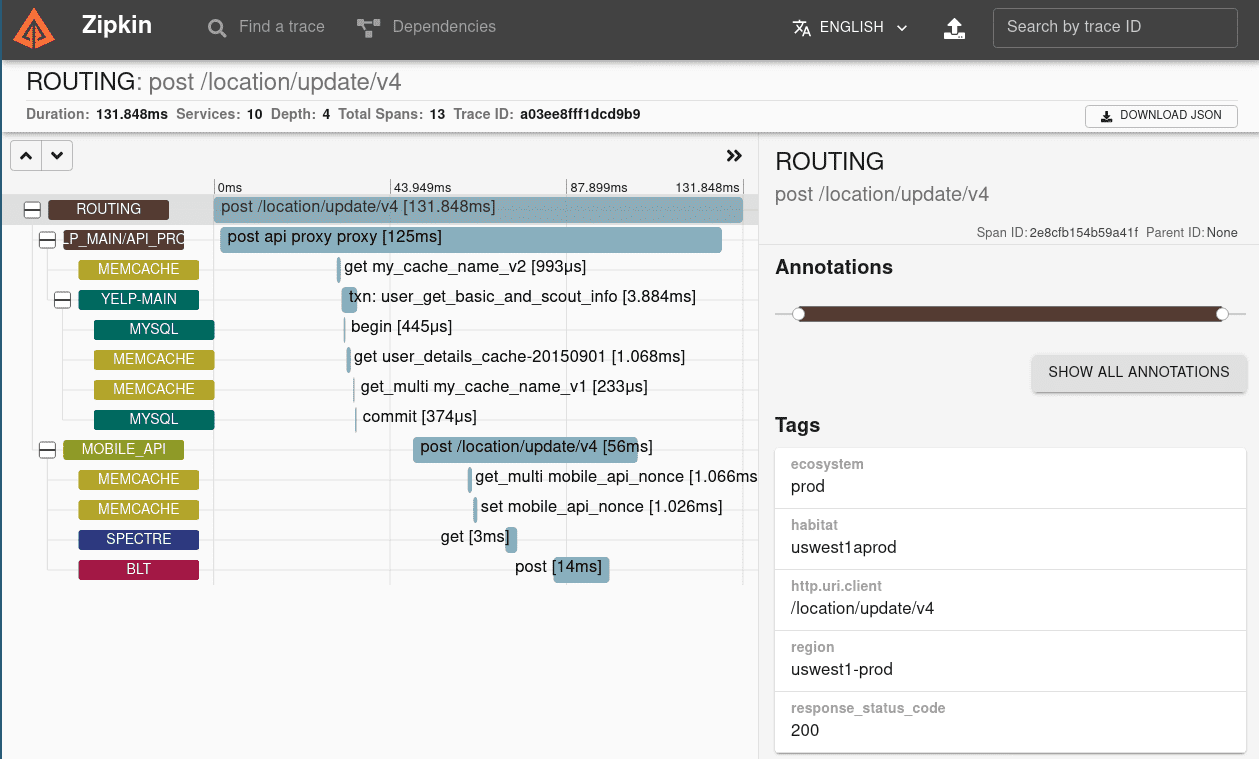
4. Zipkin
Zipkin is an open-source distributed tracing tool that assists in gathering information on how microservices interact in distributed systems.
With Zipkin, you can see how requests and responses move back and forth across services and how each request performs in terms of latency and response times.
Zipkin's main feature is the ability to trace a request as it moves across numerous microservices. Teams may detect and fix performance and stability issues by using this information to get insights into how each service performs and how it interacts with other services.
Grafana or Kibana, which have been set up to operate with the Zipkin data source, can be used in place of Zipkin's simple user interface.
Advantages:
- Solid and renowned project
- Availability of multiple DBMS
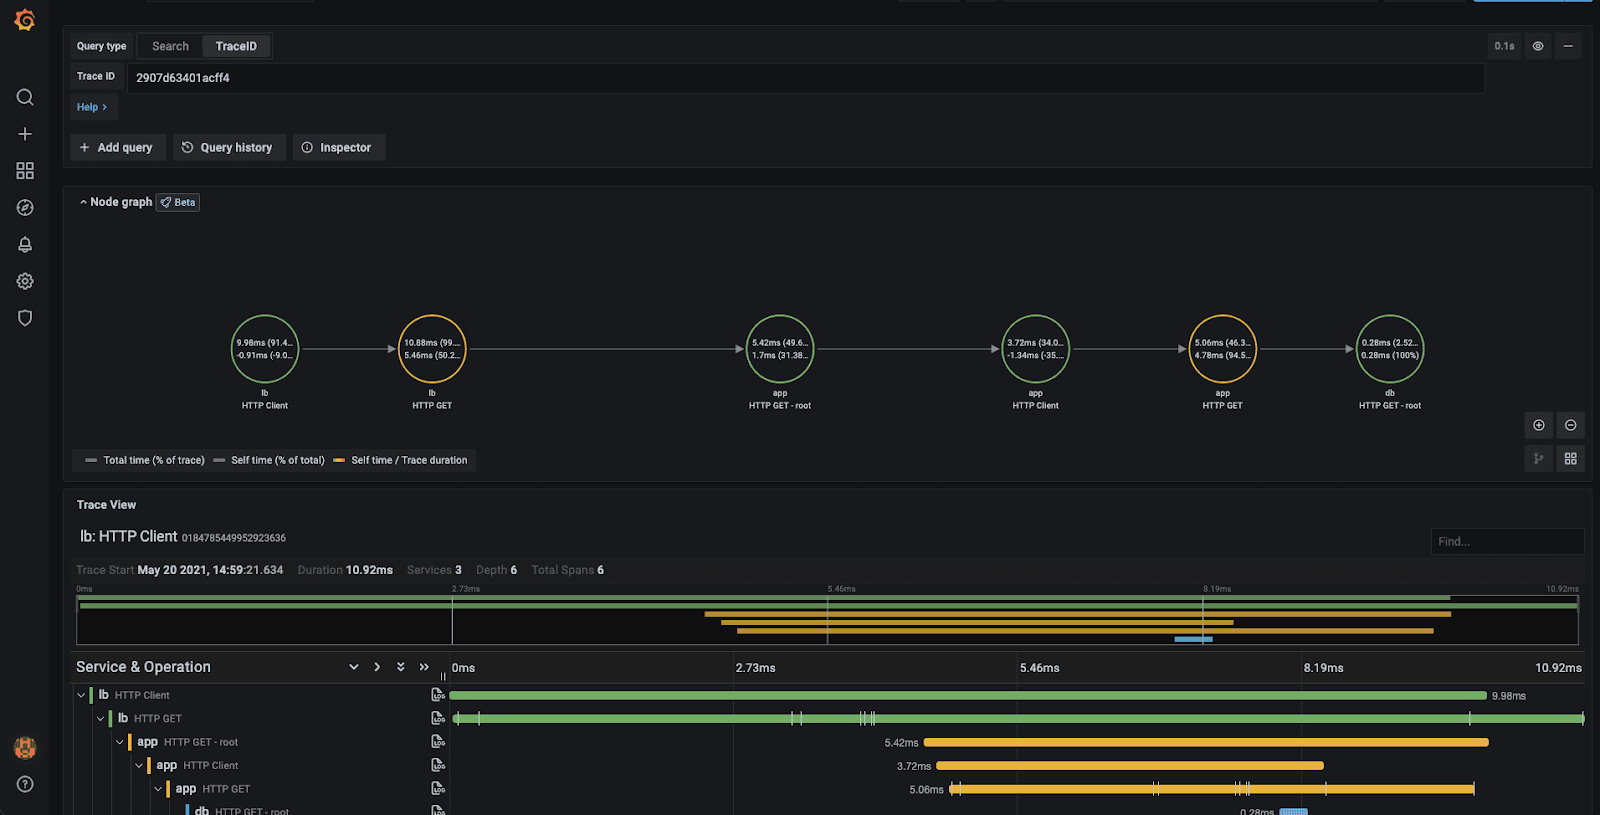
5. Grafana Tempo
Grafana Tempo is an open-source, simple-to-use, and large-scale distributed tracing backend. Together, Tempo and Grafana offer a comprehensive solution for the observability of distributed systems and microservices.
Tempo is inexpensive to use and has tight integration with Grafana, Prometheus, and Loki. It only needs object storage to run. Tempo can ingest common open-source tracing protocols like Jaeger, Zipkin, and OpenTelemetry.
Tempo is highly suited for large, complicated systems since it is optimised for excellent performance and can manage a lot of tracing data. It offers an extremely scalable, highly available backend that can store, query, and display trace data.
Advantages:
- Integration with the analytics dashboard in Grafana
- OpenTelemetry assistance
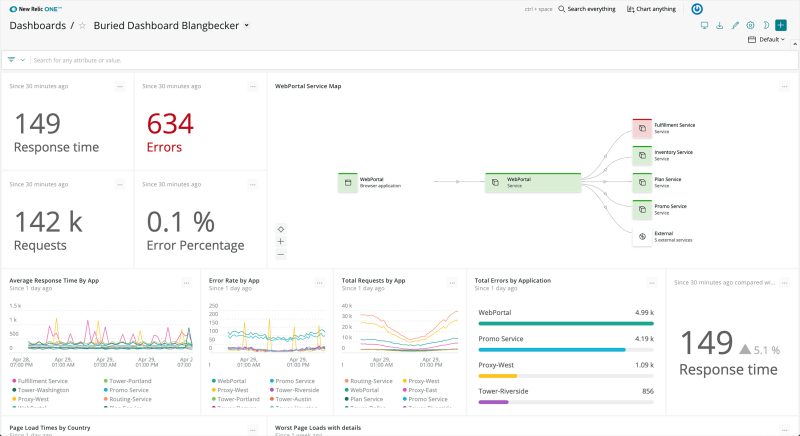
6. NewRelic
New Relic is one of the first businesses in the application performance monitoring industry. Performance monitoring provides businesses with a variety of options. It provides New Relic Edge for distributed tracing, which may track all of an application's traces.
Advantages:
- Choices for distributed tracing and sampling for a variety of technology stacks
- Support for OpenTelemetry and other open-source tracing standards
- Correlation between tracing data and other application infrastructure components, as well as a user monitoring
- Experience in a fully managed cloud with on-demand scalability
7. Dynatrace
Dynatrace is the "all-in-one" platform for observability, automation, AI, and application security. Installing an agent and automatically detecting everything in your environment make deploying Dynatrace as easy as writing a single line of code.
This indicates that no configuration is needed when setting it up. Using Dynatrace, you can get a complete picture of everything happening in your application environment.
Advantages:
- All user interactions are evaluated for performance using Dynatrace. It evaluates the performance of each component of the infrastructure as well as the availability of the application. Mobile apps for iOS and Android can also be instrumented with Dynatrace.
- Dynatrace supports the OpenTelemetry standard.
- Dynatrace can instrument web services, web containers, database requests, and bespoke services on the server side. It can also monitor the infrastructure's hosts, processes, and network.
- Dynatrace outputs log data to a log file and offers additional observability with custom log metrics.
- With automatic runtime vulnerability identification, Dynatrace excels at application security, enabling the quick and secure delivery of applications.
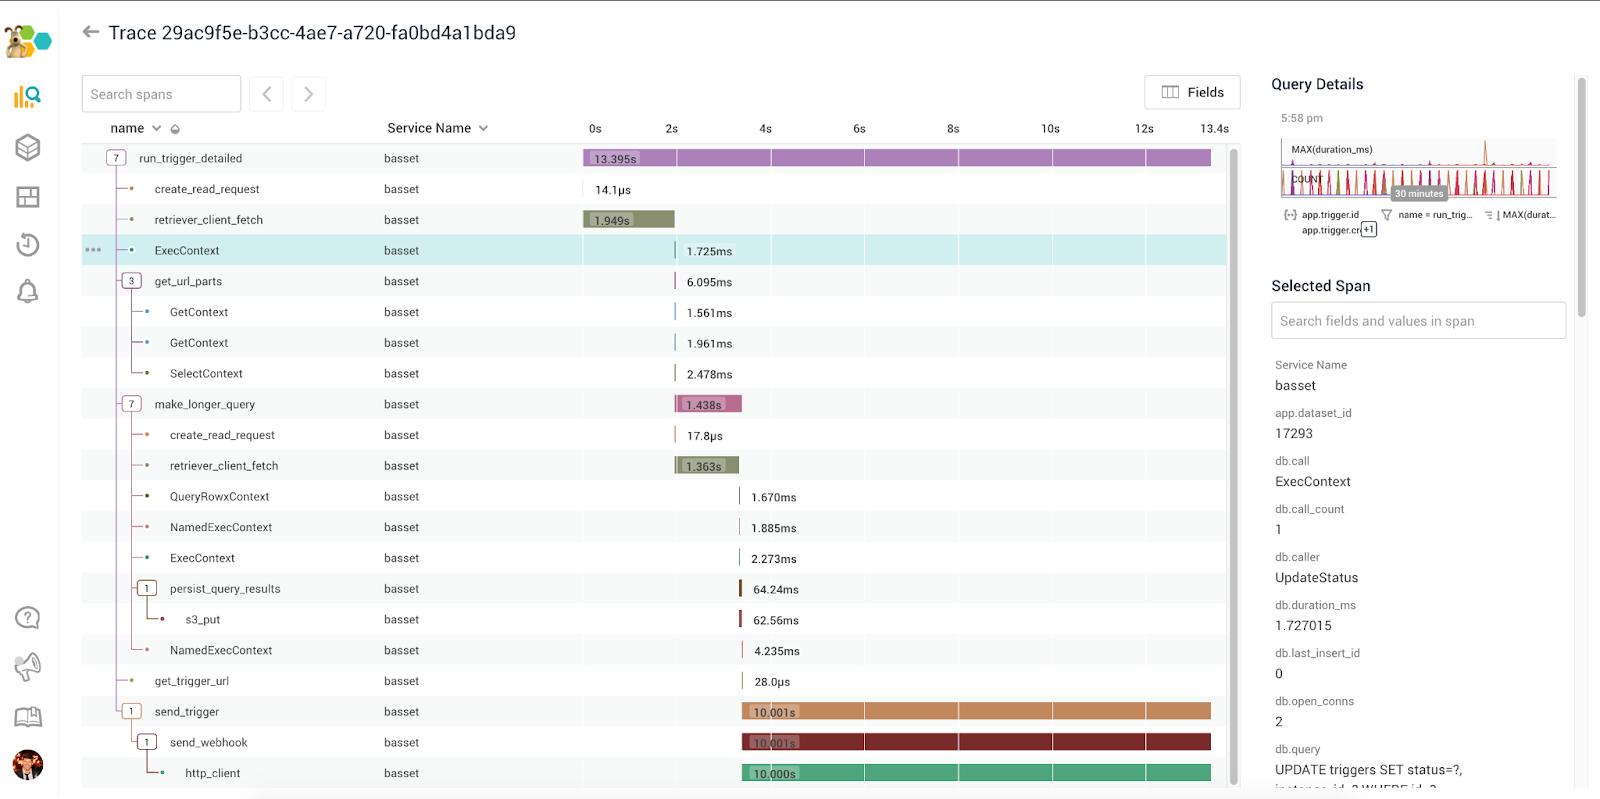
8. HoneyComb
A data tracking engine called Honeycomb is incredibly quick. Signal graphs that depict events in production allow you to quickly and accurately answer inquiries about what is happening in your system despite its sophistication and high level of dimension.
It might only take a single click to enter the tracing view by selecting a trace ID. Regardless of how complicated your system is, Honeycomb offers a seamless picture of every event taking place in it.
Advantages:
- A robust querying tool that provides unmatched versatility when querying data.
- When the entire team utilises Honeycomb, collective intelligence enables effective debugging because all system issues are recorded and made available to everyone.
- A user-friendly interface that enables you to visualise data and quickly identify any outliers.
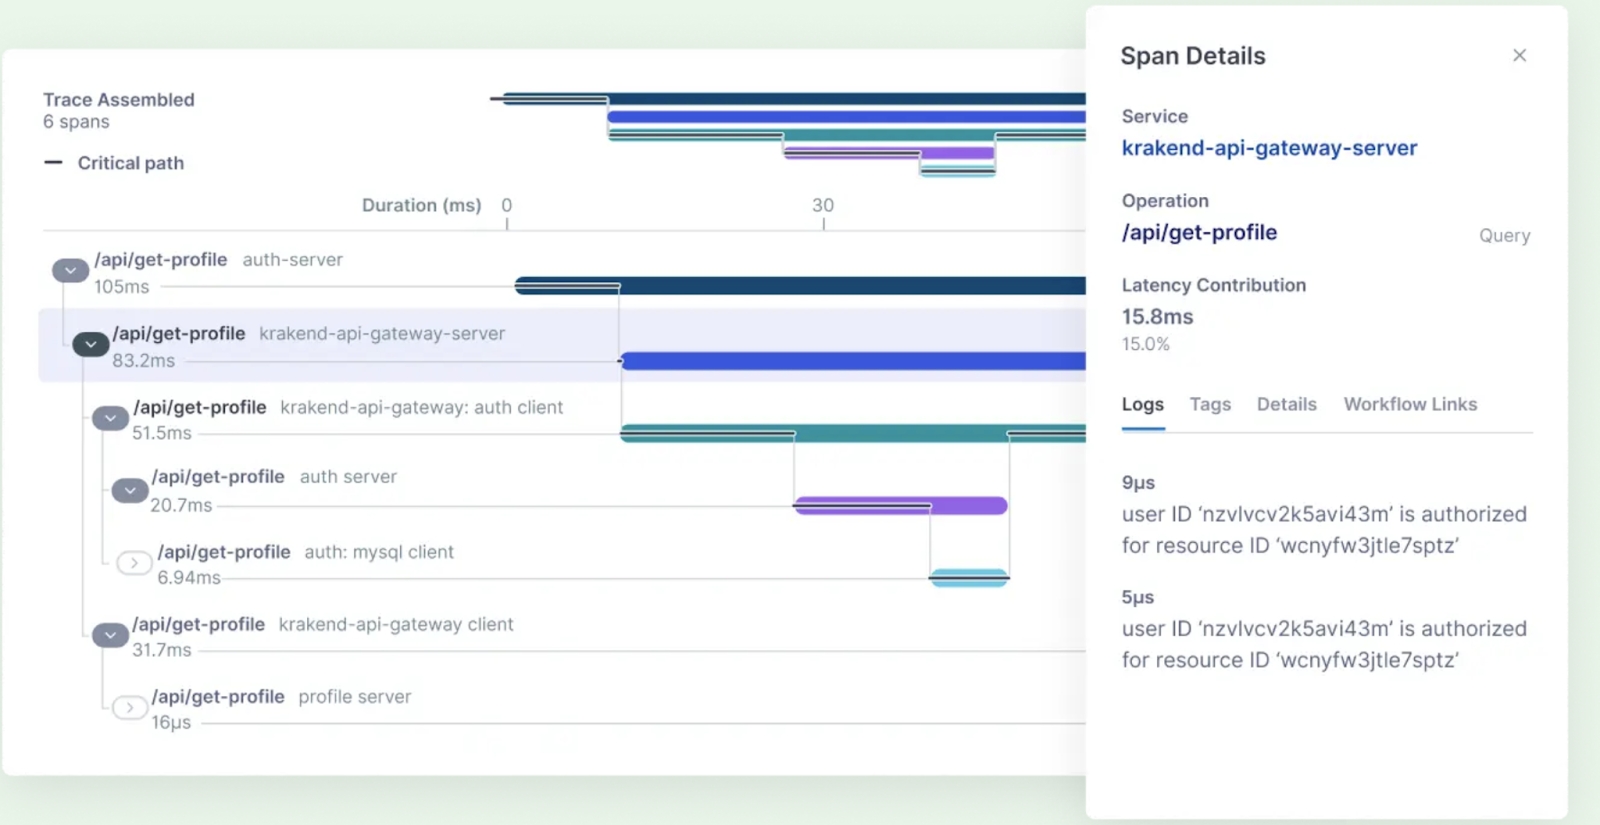
9. Lightstep
One of Lightstep's most potent features is its capacity to dynamically produce a visual depiction of any query you run through real-time trace data processing. Lightstep can also be an excellent choice if your application depends on outside services since it measures your system's latency in comparison to the calling service.
Advantages:
- It shows the precise causes of any performance issues and immediately recognises changes to your application and infrastructure.
- A time-series database that is blazingly quick and can generate system-wide insights in only seconds.
- It offers real-time root cause analysis spanning traces, logs, metrics from the full infrastructure, and dynamic service maps.
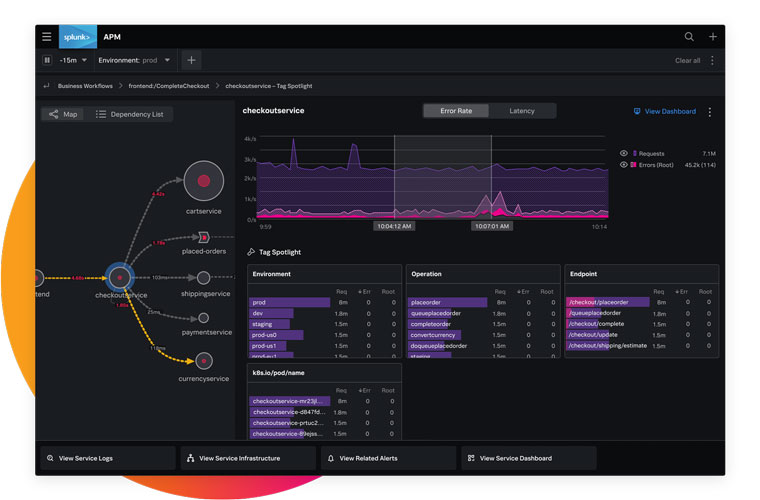
10. Splunk
The most remarkable aspect of Splunk is its original and practical AI-driven analytics, which shorten inquiry times by instantly alerting users to important patterns. Splunk offers three different search options: fast, smart, and verbose.
They give you the best tracing experience possible, with each mode's capabilities tailored to your level of meticulousness.
Advantages:
- With current monitoring that is designed for speed and advanced analytics, resolve issues quickly.
- KPI-driven analytics and full-stack visibility
- Identifying and responding to priority situations using predictive machine learning
11. Datadog
A complete breakdown of backend and code-level engagements is made possible by Datadog Application Performance Monitoring (APM), which also receives and displays frontend data. Using this tool, you may instantly search through all of your traces according to any tag.
Using Datadog, you can quickly move from the trace to the logs for each request and get important details like infrastructure metrics and runtime metrics. Finally, it ensures end-to-end application monitoring across all platforms, including mobile apps, web browsers, and even individual queries.
Advantages:
- You can use open-source tracing libraries with it because it supports OpenTelemetry standards.
- Datadog automatically creates performance graphs and service overviews for simple visualisation.
- Datadog automatically gathers logs from all platforms, services, and apps and enables you to examine them using potent visualisations.
Advantages of Distributed Tracing Tools
- Solve issues more quickly: Significantly reduce mean time to resolution (MTTR) and mean time to discovery (MTTD). Engineers can examine distributed traces to identify the source and location of application failures.
- Increasing team cooperation: In a typical microservice context, specialist teams handle and develop many technologies. If teams aren't aware of the error's location and the person in charge of fixing it, misunderstandings may result. An engineering team can use a trace link to visualise the data and notify the appropriate developer to fix the problem.
- Flexibility in implementation and integration: Developers can add distributed tracing to practically any cloud-native environment. The tools are compatible with many different programming languages and software programmes.
- Testing: relates to the capability of producing E2E test code to verify intricate backend flows. Distributed tracing technologies can be used to verify challenging asynchronous tasks and get insight into test failures.
- Observability: refers to giving your distributed application visibility through E2E visualisation. One of the fundamental indicators of observability is tracing, and distributed tracing technologies typically provide the ability to observe your app flows and comprehend the interdependencies among various components in your application. Access to a trace-based service map and API catalogue are also included in observability.
Final Thoughts
Contemporary digital businesses have quickly embraced microservices-based architecture for their applications. Applications based on microservices are easier to track with distributed tracing tools.
Developers might find it difficult to pinpoint the source of problems when debugging microservices. Not to mention how tedious it is to go through countless logs from various providers and how long it takes. Despite all of these difficulties, distributed tracing offers a solution.
Your developers can follow requests across services with the use of distributed tracing. Users frequently use distributed tracing tools to increase the visibility of issues apparent in their traces as distributed systems become more complicated.
Every developer should have tracing tools in their toolbox because they can be quite useful for finding flaws in your systems. To make sure that issues are found and fixed as soon as they arise, distributed tracing has become crucial for development teams working in distributed microservice architectures.
Distributed tracing provides a narrative of the events that happened in your systems, enabling you to react quickly to unforeseen problems. As technology and software become more complex in the future, using this formula, as well as techniques like monitoring metrics and logging, will become more important.
When considering the effects of tracing via a distributed system, you'll be surprised to see that it can reveal unpredictable behaviour, making it simple to prevent and recover from errors.
Reduce MTTR by 60–80% in 30 Days
If your incident resolution takes over 45 minutes, you’re leaving $100K+ in annual savings on the table. See exactly how Atatus improves resolution time using your own data.
#1 Solution for Logs, Traces & Metrics
![]() APM
APM
![]() Kubernetes
Kubernetes
![]() Logs
Logs
![]() Synthetics
Synthetics
![]() RUM
RUM
![]() Serverless
Serverless
![]() Security
Security
![]() More
More