What is APM? Understanding application performance monitoring
The rapid advancement of technology has revolutionised the way businesses operate and engage with their customers. A delay of even a few seconds can lead to significant drop-offs in engagement and conversions. According to Google's findings, "just a 100-millisecond lag can reduce revenue by 1%, and a half-second delay can cause a 20% drop in search engine traffic".
This highlights the critical role of monitoring applications in quickly identifying and addressing performance problems to maintain smooth business operations. This guide will give you a clear understanding of "What is APM?" and the business value it delivers, along with its features and benefits for implementing it within your organisation.
Let's get Started!
In this blog post
- What is APM?
- Why APM is Important for Modern Applications?
- How does Application Performance Monitoring(APM) work?
- Key Application Performance Monitoring(APM) metrics
- Use Cases of APM
- Benefits of APM
- Challenges of APM in Cloud-Native and Distributed Environments
- End-to-End Application Monitoring with Atatus
What is APM?
Application Performance Monitoring (APM) is the process of tracking and managing the performance, availability, and user experience of software applications. It involves collecting data from multiple sources such as server metrics, code traces, transaction logs, and user sessions to understand how efficiently an application delivers its intended functionality.
What does APM stand for?
APM stands for Application Performance Monitoring. Though in this context APM includes application performance monitoring, the term can also refer to:
- Application monitoring
- Application performance management
- Application performance
- Performance monitoring
These terms vary in scope but share the common goal of providing insights into how well applications perform.
APM vs. Application Performance Management
The terms are often used interchangeably, but there’s a subtle distinction:
Application Performance Monitoring (APM): Focuses on observing metrics, transaction traces, and logs to identify bottlenecks, slow database queries, or code-level inefficiencies.
Application Performance Management: Takes a broader approach by including automated remediation, optimization, and continuous improvement strategies based on monitoring data.
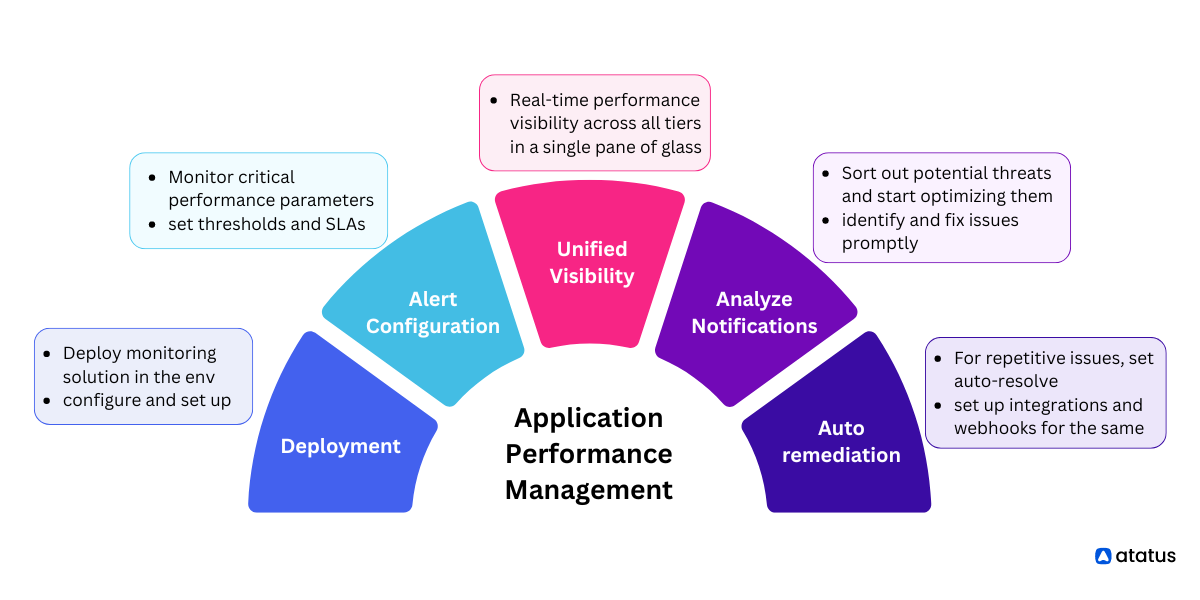
Together, they form a holistic approach to maintaining high-performing applications, monitoring identifies the issue, management ensures long-term resolution.
Core Features of APM Solutions
Comprehensive APM solutions typically include:
- Real-Time Monitoring: Continuous data collection on performance and availability.
- Transaction Tracing: End-to-end visibility across every user request and service dependency.
- Error Tracking: Automatic capture of code-level errors and stack traces.
- Infrastructure Monitoring: Integration with servers, containers, and cloud environments.
- Database Monitoring: Query performance analysis and slow query detection.
- Alerting and Anomaly Detection: Configurable alerts for threshold breaches and unusual patterns.
- Performance Dashboards: Centralized visualization of key metrics.
- User Experience Monitoring: Real User Monitoring (RUM) for frontend performance and latency.
These features empower teams to manage both technical and business KPIs from a single, unified interface.
Why APM is Important for Modern Applications?
APM is essential for ensuring applications run efficiently, reliably, and deliver a seamless user experience. It offers real-time visibility into performance, helping teams detect, diagnose, and resolve issues quickly, minimising downtime and maximising business impact.
1. Enhances User Experience
- Minimizes Downtime: Proactively detects and prevents outages before they affect users.
- Improves Speed: Monitors response times and reduces latency for faster interactions.
- Boosts Stability: Identifies and fixes bottlenecks to ensure consistent app performance.
👉Want to learn practical ways to keep your apps always available? Read [How to Reduce Application Downtime with APM?] for step-by-step strategies to prevent outages and maintain peak reliability.
2. Optimizes Resource Usage
- Better Allocation: Tracks CPU, memory, and network usage for efficient resource planning.
- Cost Efficiency: Prevents over-provisioning and under-utilization, cutting infrastructure costs.
- Right-Sizing: Helps scale infrastructure appropriately based on real-time usage patterns.
3. Accelerates Issue Resolution
- Root Cause Detection: Provides code-level visibility and transaction traces to pinpoint issues.
- Reduces MTTR & MTTD: Speeds up detection and resolution to minimize impact.
- Faster Troubleshooting: Streamlines diagnosis with real-time performance insights.
4. Supports Agile & Continuous Delivery
- Real-Time Feedback: Surfaces performance issues during development and post-deploy.
- Enables Continuous Improvement: Drives faster iteration and better performance practices.
- Proactive Monitoring: Catches issues early, ensuring smooth user experiences.
5. Drives Business Value
- Increases Revenue: Reliable performance leads to higher user satisfaction and conversions.
- Reduces Operational Costs: Optimized usage and faster resolutions lower overhead.
- Strengthens Brand Trust: A consistently stable application builds user loyalty and reputation.
Stay connected with Atatus
Get expert insights, best practices, and the latest updates on Application Performance Monitoring (APM) — tailored for developers, DevOps engineers, and SREs.
How does Application Performance Monitoring(APM) work?
APM continuously collects and analyzes data from applications and infrastructure to detect performance issues early, optimize operations, and ensure a smooth user experience. Here's a breakdown of how it works:
1. Instrumentation
Instrumentation means adding code or tools into your app and infrastructure to collect data. This allows APM tools to see what is happening inside, like how fast things run, where errors occur, and how system resources are used, without affecting the app's functionality. There are three main ways instrumentation is done:
- Agent-Based Monitoring: Lightweight agents are installed on servers or within the application to automatically collect real-time performance data from different layers of the stack.
- Code-Level Visibility: Some APM tools allow you to instrument specific parts of your code, such as method calls, database queries, or external API calls, to trace slow operations with high accuracy.
- Infrastructure Monitoring: Beyond the application itself, APM also monitors servers, databases, and network components to understand how infrastructure performance affects the overall application behavior
2. Data Collection
Data Collection begins after the application is instrumented. APM tools continuously gather detailed performance data to help teams understand how the application is behaving in real-world conditions. This includes not just raw numbers, but also how user requests flow through the system and what errors or unusual events may be occurring. Here are the key types of data collected:
- Metrics: Core performance indicators such as response time, throughput, error rates, and resource usage (CPU, memory, etc.) that show the overall health of the application.
- Traces: Detailed records that follow each user request across services, helping identify delays, failures, or slow components in the transaction path.
- Logs: Application logs are collected and analyzed to detect anomalies, exceptions, or specific events that provide context during troubleshooting.
3. Data Analysis & Visualization
The collected data is processed and shown through dashboards and charts. This makes it easier to spot issues, monitor trends, and understand performance. Alerts can be set up to notify you if something goes wrong, and the data helps find the root cause quickly. Key features of this stage include:
- Dashboards: Unified views that display metrics, traces, and logs in real time, giving teams a clear picture of the application.
- Alerting: Customizable thresholds for key metrics trigger alerts when performance deviates from normal, allowing teams to respond proactively.
- Root Cause Detection: By correlating data across different layers, such as code, infrastructure, and network. APM tools help pinpoint the exact cause of performance issues.
💡 Want to go beyond the basics? Explore [The Complete Guide to APM Best Practices for Developers, DevOps & SREs] to learn how to implement APM effectively and get the most out of your performance monitoring strategy.
Key Application Performance Monitoring(APM) metrics
APM tools track a range of performance metrics to help teams monitor application health, detect issues early, and optimize system performance. These metrics are critical for ensuring applications meet performance goals and deliver a smooth user experience.
1. Response Time
Measures how long it takes for the application to respond to a user request. High response times often indicate performance bottlenecks.
2. Error Rate
Shows the percentage of failed requests or transactions. A rising error rate signals instability or issues in application logic, third-party services, or infrastructure.
3. Throughput
Represents the number of requests or transactions handled over a given period (e.g., requests per second). It reflects the system’s workload capacity.
4. Resource Utilization
Tracks how system resources like CPU, memory, and disk I/O are used. Monitoring this helps prevent overuse, underuse, and bottlenecks.
5. Latency
Refers to the time delay between when a request is made and when processing begins. It’s a key contributor to overall response time and user-perceived slowness.
6. Application Availability (Uptime)
Measures the percentage of time the application is accessible and functional. High availability is crucial for meeting SLAs and ensuring user trust.
7. Apdex Score
Short for Application Performance Index, this metric measures user satisfaction based on how quickly the application responds. It compares actual response times against a set performance threshold.
👉Want to dive deeper into APM metrics? Check out Top APM Metrics for Developers and SREs for a detailed breakdown.
Use Cases of APM
A complete APM solution includes several components that work together to provide a full picture of application health, performance, and user experience. Below are the key components and how they contribute to effective performance monitoring:
- Web Application Monitoring: Detect slow pages, unresponsive endpoints, and frontend bottlenecks in real-time. Measure metrics like TTFB, DOM load, and page render times for optimization. Track user journeys to pinpoint drop-offs and improve conversion rates.
- Microservices Management: Trace requests across distributed services to identify latency or failures. Monitor inter-service communication (HTTP, gRPC, Kafka) for errors. Analyze dependencies to prevent cascading performance issues.
- API Performance Tracking: Measure API response times, throughput, and error rates to ensure SLA compliance. Detect upstream and downstream latency affecting end-user experience. Trigger alerts automatically for slow or failing services.
- E-Commerce Optimization: Identify slow checkout flows or payment gateways causing abandoned carts. Track transaction latency and database or third-party service delays. Correlate performance metrics with business outcomes to prioritize fixes.
- DevOps Pipelines & CI/CD Monitoring: Integrate APM into CI/CD pipelines to catch performance regressions early. Monitor containerized workloads and orchestration layers like Kubernetes. Enable automated rollback or feature flagging when releases degrade performance.
- Cloud Migration & Hybrid Environments: Measure application performance before, during, and after migration. Detect resource bottlenecks in CPU, memory, or storage I/O. Ensure multi-cloud or hybrid deployments meet performance and availability expectations.
- Database & Backend Optimization: Monitor slow queries, cache hits/misses, and connection pool utilization. Correlate backend latency with frontend performance for end-to-end visibility. Optimize database indexing and query patterns to improve responsiveness.
- User Experience & Real User Monitoring (RUM): Capture real user metrics like page load, interactions, and JavaScript errors. Segment performance by device, browser, location, or user type. Use insights to drive improvements that enhance engagement and retention.
👉 Want to explore how APM fits into real-world workflows? Check out Application Performance Monitoring (APM) Use Cases Every DevOps Team Should Know for practical insights.
Benefits of APM
APM delivers significant value to development, DevOps, and operations teams by ensuring applications run smoothly, efficiently, and reliably. Here are the key benefits:
Technical Benefits:
- Identifies memory leaks, slow queries, and inefficient code paths.
- Improves performance through real-time diagnostics.
- Enhances system scalability and reduces downtime.
Operational Benefits:
- Reduces MTTR with precise root-cause identification.
- Improves cross-team collaboration with unified dashboards.
- Enables continuous optimisation through data-driven insights.
Business Benefits:
- Enhances user retention and satisfaction.
- Protects brand reputation by minimising performance issues.
- Supports strategic decisions with performance analytics.
Ultimately, APM aligns technology performance with business outcomes, turning observability into a measurable competitive advantage.
Challenges of APM in Cloud-Native and Distributed Environments
While APM tools have evolved, monitoring cloud-native applications remains challenging due to:
- Ephemeral infrastructure: Containers and serverless functions spin up and down rapidly.
- Complex dependencies: Microservices communicate asynchronously.
- High data volume: Metrics, traces, and logs grow exponentially.
- Distributed ownership: Multiple teams manage different services.
Modern APM platforms address these challenges by integrating with observability tools, offering automatic instrumentation, and leveraging machine learning for pattern detection.
👉 Want to make sure you are investing in the right platform? Check out [Choosing the Right APM Software: 5 Key Factors to Consider] for a detailed guide on what to look for before making your decision.
End-to-End Application Monitoring with Atatus
Atatus Application Performance Monitoring (APM) provides real-time, end-to-end visibility into every layer of your application, frontend, backend, logs, and infrastructure. It captures performance metrics and traces, enabling your team to quickly identify bottlenecks, trace slow transactions, and resolve issues before users even notice.
Why Choose Atatus?
- Distributed Tracing & Service Map: Gain a clear view of how requests flow through your microservices architecture. Easily map service dependencies and quickly identify performance bottlenecks across the entire request path.
- Slow Database & External API Monitoring: Identify slow-performing SQL queries and third-party API calls in real time. Understand their impact on application performance and optimize them to ensure faster response times.
- Error & Exception Tracking: Capture detailed error traces with full context including request data, user sessions, and environment variables, to troubleshoot issues efficiently and reduce resolution time.
- Smart Alerting & Dashboards: Create intelligent alert rules based on key performance metrics. Get instant notifications via email, Slack, PagerDuty, and more to stay informed and responsive to critical incidents.
- Infrastructure & Resource Analytics: Monitor essential infrastructure components like CPU, memory, disk usage, containers, databases, and Kubernetes. Correlate system-level metrics with application performance for deeper insights.
- Unified Logs, Metrics, and Traces: Integrate logs with metrics and distributed traces in a single platform. Seamlessly trace issues across your stack, correlate logs with events, and analyze custom KPIs in one unified dashboard.
- Security & Deployment Visibility: Track deployment changes and detect performance regressions or spikes in errors. Monitor security risks in your codebase and understand their impact on application behavior in real time.
Frequently Asked Questions
What is Application Performance Management (APM)?
Application Performance Management (APM) is the practice of using specialized tools and analytics to monitor, manage, and optimize the performance of software applications. It ensures applications meet service level objectives (SLOs), function efficiently, and deliver a seamless user experience across different environments.
Why is APM important for businesses?
APM plays a critical role in maintaining application reliability and business continuity. It enables teams to:
- Detect and fix performance issues before users are impacted.
- Reduce downtime and improve application availability.
- Optimize resource usage and infrastructure costs.
- Support continuous improvement through performance insights.
- Maintain customer satisfaction by ensuring consistent application speed and functionality.
What are the key components of an APM solution?
A robust APM solution typically includes:
- Real-time Monitoring: Tracks application performance, infrastructure, and network health.
- Transaction Tracing: Follows user requests across services and layers to identify latency sources.
- Code-Level Diagnostics: Pinpoints inefficient functions or slow methods in the application code.
- Error Tracking: Logs and analyzes exceptions and failures.
- Reporting and Dashboards: Visualizes metrics and trends for decision-making and alerting.
What is the difference between APM and monitoring?
APM is a subset of monitoring focused specifically on the performance, availability, and behavior of applications. General monitoring may include system-level checks such as server health, CPU usage, or disk space, whereas APM dives deeper into how applications are running from both technical and end-user perspectives, providing actionable insights that typical infrastructure monitoring cannot.
What are the common performance metrics monitored in APM?
APM tools track a wide range of performance metrics, such as:
- Response Time: How long the application takes to respond to requests.
- Throughput: The number of transactions or requests handled per second.
- Error Rate: Frequency of application errors or exceptions.
- Apdex Score: A user satisfaction metric based on response time thresholds.
- Resource Utilization: CPU, memory, disk I/O, and network usage.
- User Interactions: Behavioural data on how users navigate and interact with the application.
What is the role of code profiling in APM?
Code profiling provides deep visibility into the internal execution of your application. It helps developers:
- Identify which functions or methods are consuming the most resources.
- Understand performance hotspots and execution paths.
- Optimize slow or inefficient code.
- Improve overall application speed and responsiveness by targeting the root cause at the code level.
How does APM contribute to proactive issue resolution?
APM enables proactive performance management by:
- Offering real-time alerts on abnormal behaviour or slowdowns.
- Identifying early warning signs like memory leaks or increasing latency trends.
- Enabling automated remediation through integrations and workflows.
- Helping teams prioritize issues based on user impact and severity.
- Reducing mean time to detect (MTTD) and mean time to resolve (MTTR) by providing contextual data for faster root cause analysis.
#1 Solution for Logs, Traces & Metrics
![]() APM
APM
![]() Kubernetes
Kubernetes
![]() Logs
Logs
![]() Synthetics
Synthetics
![]() RUM
RUM
![]() Serverless
Serverless
![]() Security
Security
![]() More
More


![New Relic vs Splunk - In-depth Comparison [2026]](/blog/content/images/size/w960/2024/10/Datadog-vs-sentry--19-.png)