Database Monitoring Challenges Every DevOps Engineer Should Know
Databases form the critical foundation of modern applications, and maintaining their performance and reliability is essential for operational efficiency and user satisfaction.
Effective database monitoring however presents numerous challenges. Modern systems produce extensive metrics, operate across diverse environments, and must scale in line with growing workloads, all while ensuring compliance and security.
Inadequate monitoring can result in performance degradation, operational disruptions, and potential compliance violations.
This blog discusses the key challenges of database monitoring faced by DevOps engineers and outlines strategies to address them effectively.
Database Monitoring Challenges:
- Identifying Query Performance Issues
- Managing High Volumes of Metrics
- Monitoring Distributed and Hybrid Environments
- Balancing Monitoring Overhead and Database Performance
- Connecting Database Issues with Application Performance
- Scaling Monitoring with Data Growth
- Ensuring Security and Compliance in Monitoring
- How DevOps Engineers Can Overcome These Challenges
1. Identifying Query Performance Issues
One of the toughest aspects of database monitoring is managing query performance. A single poorly written query, a missing index, or an inefficient join can significantly slow down an entire application.
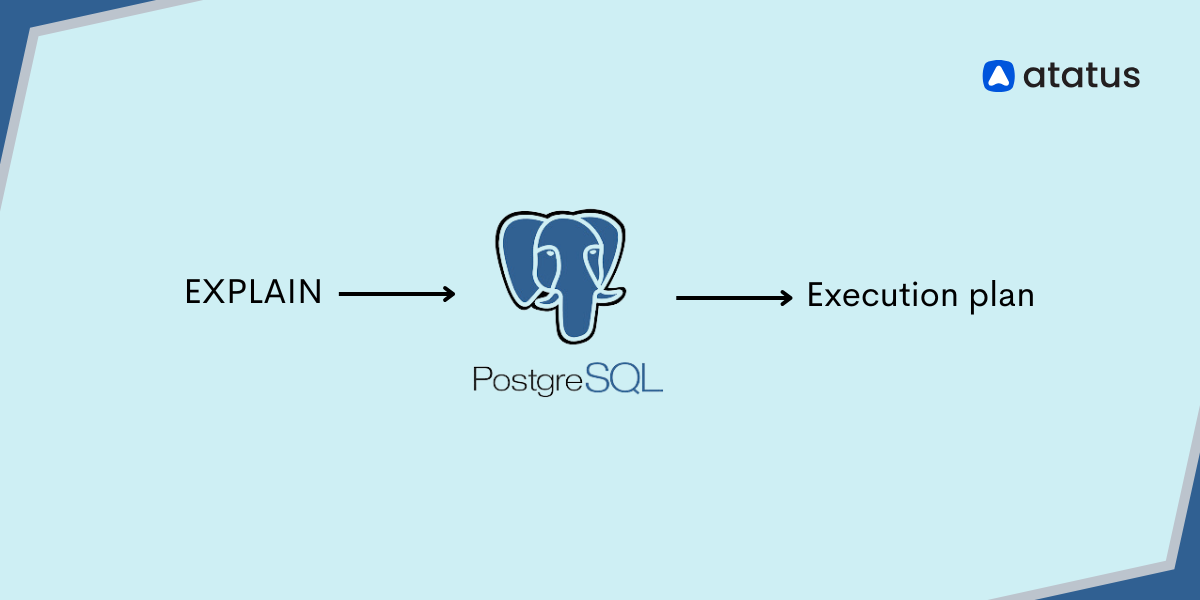
For DevOps engineers, the challenge lies in pinpointing which specific query is causing issues when thousands are executed every second. Databases such as PostgreSQL, MySQL, and MongoDB provide execution plans and slow query logs, but analyzing them in real time is far from straightforward.
In microservices architectures, the complexity increases further as queries originate from multiple services, making it even harder to trace performance bottlenecks back to their root cause.
Slow queries typically appear as overall application slowness, often leading developers to suspect APIs, servers, or networks instead. This is why it matters to maintain visibility into query execution times without it, engineers risk spending hours troubleshooting the wrong part of the stack.
2. Managing High Volumes of Metrics
Modern databases generate a large volume of performance metrics, including CPU usage, memory consumption, cache hit ratios, query response times, locks, replication lag, and more. While each of these numbers provides valuable insights, together they can easily create excessive noise.
For DevOps engineers, the real struggle is determining which metrics truly matter. Which ones indicate a critical issue versus a harmless fluctuation? How do you set meaningful alert thresholds without triggering constant false alarms?
Cut Through the Noise with Atatus
Eliminate alert fatigue and focus on what truly matters. Atatus helps you highlight anomalies, detect trends, and reduce irrelevant alerts so your team can respond faster to real issues.
Start Monitoring SmarterThis challenge often results in alert fatigue, where engineers start ignoring notifications because most turn out to be irrelevant. The danger is that a real issue may slip through unnoticed, potentially leading to costly downtime. Too many irrelevant alerts waste time, drain focus, and make it harder to respond effectively when a genuine crisis arises.
The problem is not just about collecting performance data but about making sense of it. DevOps teams need monitoring systems that can highlight anomalies, detect trends, and filter out the noise, ensuring they can act quickly on the issues that truly matter.
3. Monitoring Distributed and Hybrid Environments
In the past, most databases were hosted on a single server or cluster. Today, the landscape looks very different. Many organizations now operate with cloud-hosted databases such as AWS RDS, Azure SQL, or Google Cloud Spanner. Others continue to maintain on-premise databases for sensitive workloads, while some adopt hybrid or multi-cloud setups with replicas distributed across regions.
This complexity creates a significant monitoring challenge. A single application may interact with multiple databases, each running in a different environment. Ensuring consistent performance across them requires visibility into replication lag between clusters, latency across regions, failover readiness, and overall data consistency.
The stakes are high. If replication falls behind in a global system, users may end up seeing outdated data. A failover event, if undetected, can lead to unexpected downtime. Hybrid setups also increase the risk of blind spots, where one environment is monitored more thoroughly than another.
For DevOps engineers, achieving a single source of truth across distributed databases remains one of the most difficult aspects of database monitoring.
4. Balancing Monitoring Overhead and Database Performance
Monitoring databases requires the collection of logs, metrics, and traces. The catch is that monitoring itself consumes resources.
Aggressive logging or detailed query tracing can slow down database performance, drive up storage and processing costs, and interfere with workloads during peak usage. For instance, enabling full query profiling on a production system under heavy traffic can actually make performance worse instead of better.
DevOps engineers must strike the right balance, capturing enough data to diagnose issues without overloading the system. Lightweight and targeted monitoring approaches are often the most effective for high-traffic environments. At scale, even small amounts of monitoring overhead can quickly add up, resulting in noticeable performance degradation.
5. Connecting Database Issues with Application Performance
Database monitoring in isolation is never enough. A spike in query time does not always mean the database is at fault it could just as easily stem from a poorly configured connection pool, a slow application server, or even network latency.
For DevOps engineers, the main challenge is linking database health to the overall performance of the application and infrastructure. Without this connection, teams can waste hours chasing the wrong problem. Troubleshooting often becomes isolated, Database admins focus on database metrics, DevOps looks at infrastructure, and developers check application logs, without seeing the full picture.
What’s needed is true end-to-end observability, the ability to trace how a slow query impacts API response times, how those delays affect the user experience, and how everything ties back to underlying infrastructure usage.
Gain Complete Visibility Across Your Stack
Seamlessly switch between metrics, traces, and logs to pinpoint issues quickly. Accelerate issue resolution, optimize costs, and prevent downtime effortlessly.
Request a Demo6. Scaling Monitoring with Data Growth
As applications grow, so does the volume of data. What works for a database with 100,000 records may struggle when that number reaches 100 million.
The real challenge is scaling monitoring tools alongside the database. As query volume, traffic, and storage requirements increase, dashboards can become overwhelmed. Logs may grow too large, alert thresholds may lose relevance, and performance baselines can shift constantly.
Monitoring tools that cannot scale effectively become bottlenecks themselves. Without scalable monitoring, critical issues at higher volumes may go unnoticed until they trigger major outages. DevOps engineers must continuously review and optimise their monitoring configurations to ensure they remain effective as the system grows.
7. Ensuring Security and Compliance in Monitoring
Monitoring often involves capturing queries, logs, and snapshots of data. However, this introduces a critical risk: exposure of sensitive information.
For DevOps engineers working in regulated industries such as finance, healthcare, or e-commerce, compliance standards like GDPR, HIPAA, and PCI DSS strictly govern how data can be stored and monitored.
Key challenges include ensuring that monitoring tools do not capture personally identifiable information (PII), preventing query logs from accidentally exposing credit card numbers or customer details, and applying role-based access controls so that only authorized personnel can view monitoring dashboards.
Misconfigured monitoring can quickly turn into a compliance violation. DevOps teams are often on the front lines of enforcing secure monitoring practices, making data protection a top priority alongside performance.
How DevOps Engineers Can Overcome These Challenges
These challenges may seem tough, but they can be overcome. With the right approach, DevOps engineers can create monitoring systems that are reliable, efficient, and secure. Here are some best practices:
- Focus on key KPIs: Instead of tracking every possible metric, prioritize latency, throughput, error rates, and resource utilization.
- Use intelligent alerting: Replace static thresholds with anomaly detection and trend-based alerts to reduce noise.
- Integrate with APM tools: Connect database metrics with application performance monitoring and infrastructure monitoring for full-stack visibility.
- Automate scaling and capacity planning: Use historical data to predict growth and provision resources before bottlenecks occur.
- Implement safe query profiling: Use sampling or targeted logging to identify slow queries without overwhelming the system
- Maintain security: Mask sensitive data, apply role-based access control, and ensure compliance in monitoring workflows.
By following these strategies, DevOps engineers can shift database monitoring from a reactive task into a proactive reliability practice.
Next Step!
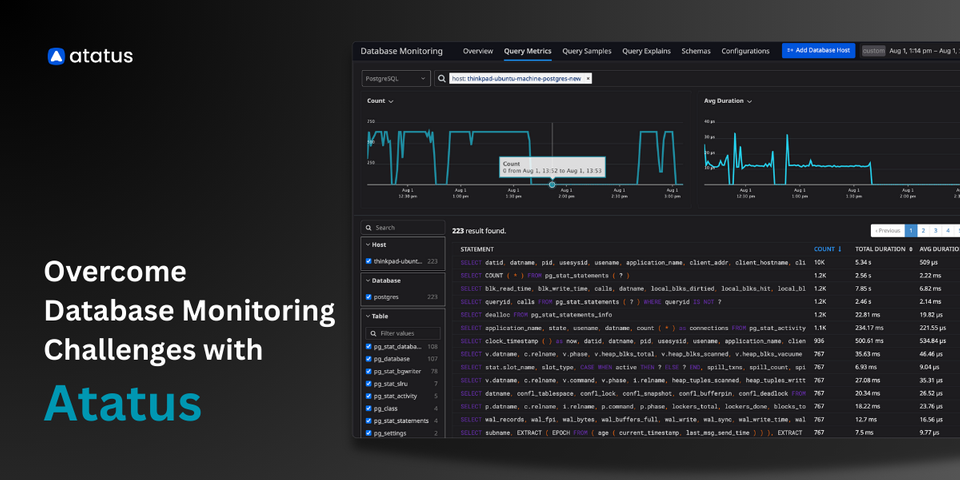
Overcome database monitoring challenges with Atatus. From query performance to alert fatigue, distributed systems, and compliance, Atatus gives you the visibility and control you need to keep databases fast, reliable, and secure.
See it in Action#1 Solution for Logs, Traces & Metrics
![]() APM
APM
![]() Kubernetes
Kubernetes
![]() Logs
Logs
![]() Synthetics
Synthetics
![]() RUM
RUM
![]() Serverless
Serverless
![]() Security
Security
![]() More
More