Datadog vs. New Relic: 2025 Comparison
If you're working in IT monitoring and observability, you simply cannot ignore the power of Datadog and New Relic. These two tools have plenty of features that can revolutionize your entire observability strategy and give you complete control over your infrastructure.
These tools are built so as to capture the tiniest of details, be it on applications, infrastructure, databases, servers, or something completely on the cloud. They are both cloud-native solutions and thus offer monitoring capabilities for applications deployed locally, hybrid, and on-cloud.
They have now almost mirrored each other in terms of market reach and pricing. That is why we thought it was an ideal time to analyze each of these tools carefully. This blog is intended to give a complete overview of all their features, who is a point better when you compare, and how they are priced.
Table Of Contents:
- Exploring their Range of Products
- Integration and Getting Started
- Comparing Product Performance:
- User Interface and User Experience: New Relic
- Data Querying and Visualization: New Relic
- Incident Handling and Alerts: Tie
- Price Points and Comparison: Depends
- User Reviews: What the Community is Saying?
- When to Choose What?
- Atatus: Your Affordable Alternative to Datadog and New Relic
Exploring their Range of Products
Datadog is a monitoring platform for cloud-based applications. It allows organizations to collect, visualize, and analyze data from various sources, such as servers, databases, applications, and services.
Its suite of tools includes Infrastructure Monitoring, Logs Monitoring, Software CI/CD pipelines, Security Management, and Digital Experience Monitoring, which incorporates RUM, Synthetics, and other related features.
New Relic also offers products on a similar line, but their major focus is on Application performance monitoring, which includes Mobile, Browser, and Synthetic Performance monitoring.
They also have Infrastructure and Logs management, Container monitoring (like Kubernetes), and Serverless function monitoring, including AWS Lambda, Microsoft Azure, and Google Cloud Platform, among others.
| Feature | Datadog | New Relic |
|---|---|---|
| APM | ✅ | ✅ |
| RUM | ✅ | ✅ |
| Infrastructure Monitoring | ✅ | ✅ |
| Log Monitoring | ✅ | ✅ |
| Container Monitoring | ✅ | 🟡 |
| Application Security | ✅ | 🟡 |
| Cloud SIEM | ✅ | ❌ |
| Log Archives | ✅ | 🟡 |
✅Available ❌Not Available 🟡Limited
Integration and Getting Started
Integration is the process of blending in with your system as a first step to collecting data from it. This data can be logs, traces, or other metrics. Meanwhile, Instrumentation is the process of making this data measurable.
New Relic
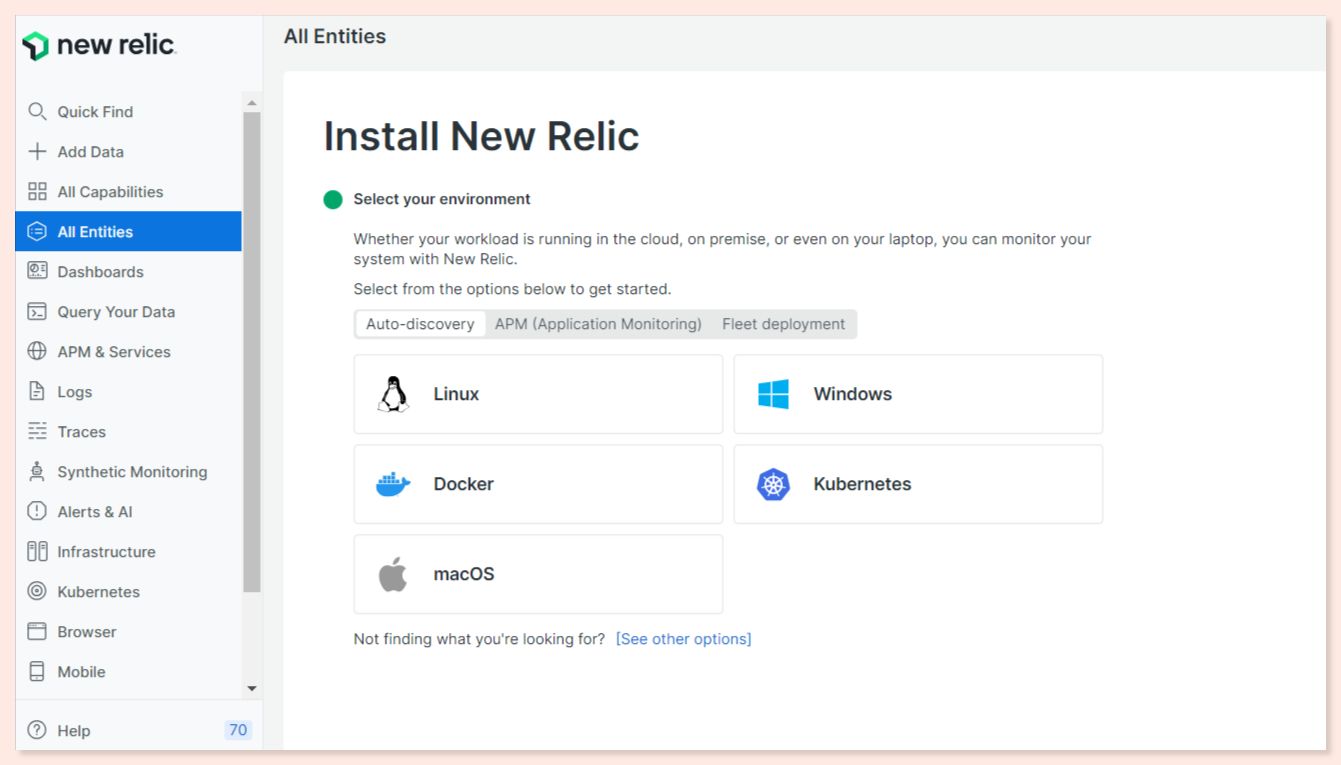
It's worth noting that signing up for New Relic is completely free, and there's no trial period to worry about. You'll have access to all of their products without any limitations. New Relic offers four integrations: APM, Browser, Infrastructure, and Mobile. Additionally, they support open-source integrations like Elastic and Opentelemetry. It will detect the environment on its own, so you just have to select the systems you wish to monitor.
Datadog
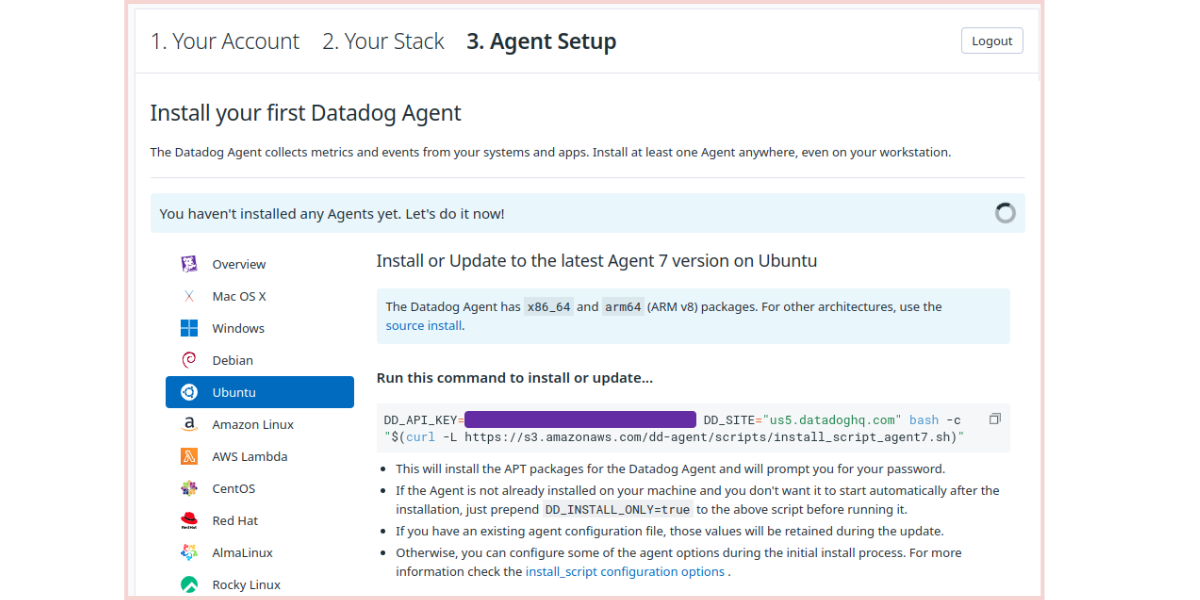
Datadog is more straightforward with its integration function. It allows you to use the same agent for both APM and infrastructure monitoring; however, for the rest of its products, you will have to install individual agents. Apart from this, Datadog also offers integrations for several platforms, cloud providers, and containers.
Comparing Product Performance
With both products offering a similar set of tools, we decided to compare them in order to determine which one delivered superior performance.
Application Performance Monitoring: Datadog
The process is almost similar for both—you install their general agent, then install a language-specific agent to configure the tool for your application.
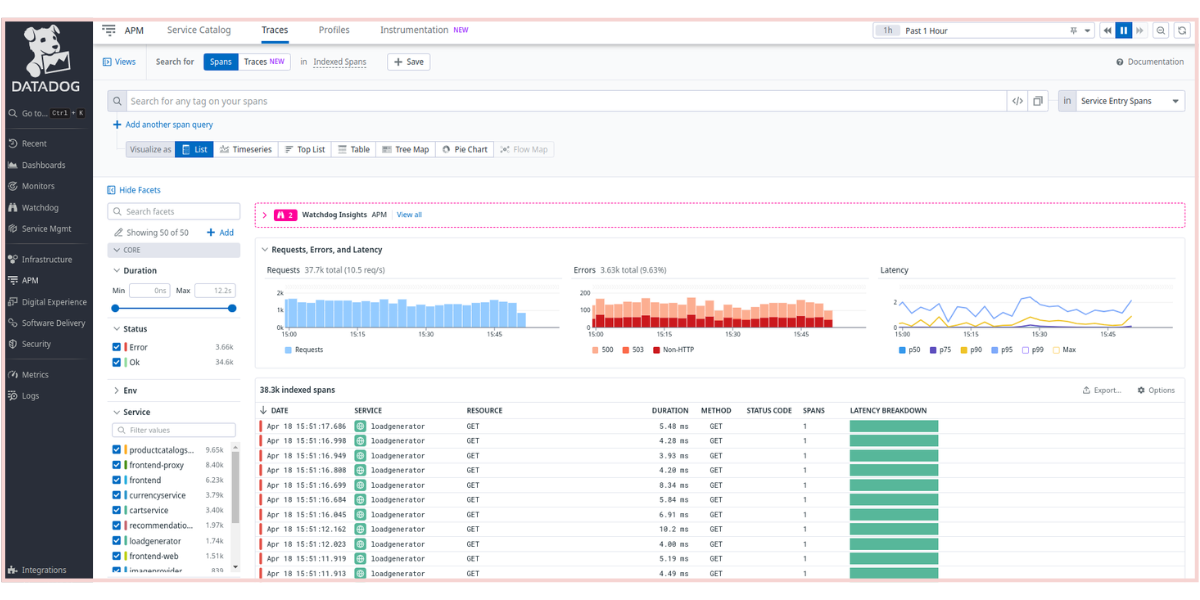
Datadog is more controlled and you can customize what to collect - for example, metrics, sampling rate, traces and logs data correlation. When the setup is complete, you will be able to view the flamegraphs for your data. The other good thing I found with Datadog is that you can easily correlate the information collected in other tools, like infrastructure, network and others and see how they come together.
When it comes to New Relic, the traces pages will show all traces in groups and not as individual spans, so it will be easier to filter root spans, especially when you are dealing with large trace groups. When you consider New Relic vs Datadog , the former showed much more spans for the same call than it showed in Datadog. In New Relic too, traces can be viewed in the form of flamegraphs.
Comparing both of these, I found New Relic’s APM was easier to navigate, but when it comes to control, Datadog definitely beats it far ahead.
| Features | Datadog | New Relic |
|---|---|---|
| Tracing | Automatically injects trace IDs, linking traces to logs, infrastructure metrics, network calls, and processes. | Observes all traces, offering actionable insights |
| Live visibility | Displays all traces and service dependencies within the last 15 minutes | Streams real-time updates every 5 seconds for viewing, visualization, and querying |
| Control | Sets SLOs, tracks trends, and monitors KPIs using span-based metrics with any tag set | Manages SLOs through automated service level management |
| Supported languages | Compatible with Java, .NET, PHP, Node.js, Ruby, Python, Go, or C++ applications | Supports Java, .NET, PHP, Node.js, Ruby, Python, Go, or C applications |
| Performance monitors | Monitors applications, hosts, containers, serverless functions, and PaaS | Tracks applications, hosts, containers, database services, or their groupings |
| Related products | Offers Continuous Profiler for additional functionality | Provides New Relic Edge with Infinite Traces |
| Support for OpenTelemetry | Supports OpenTelemetry | Supports OpenTelemetry |
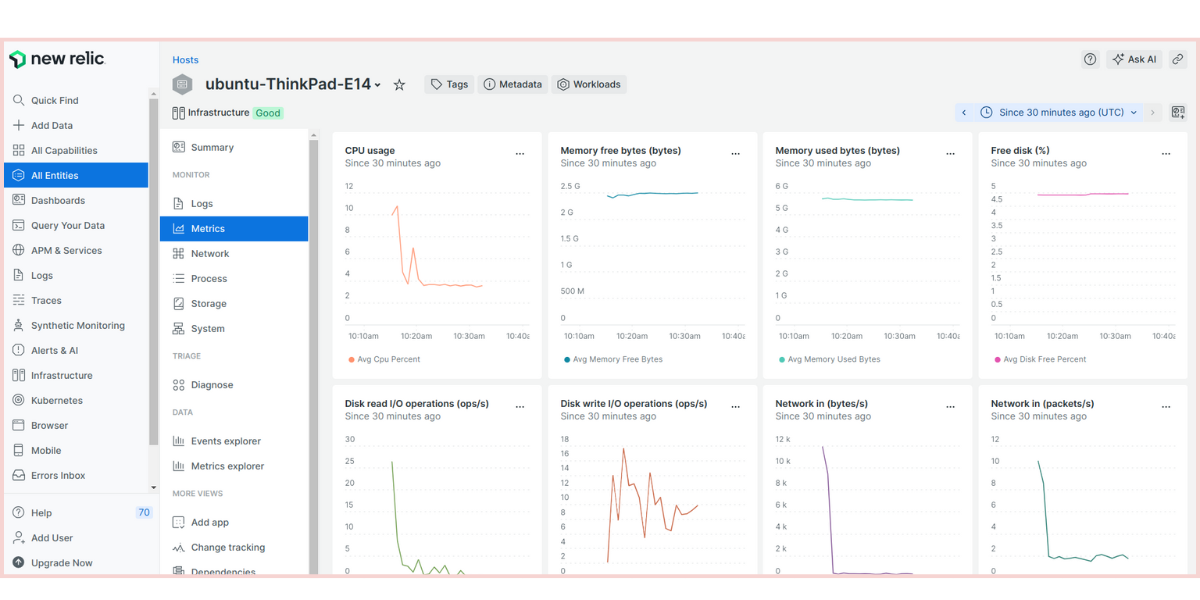
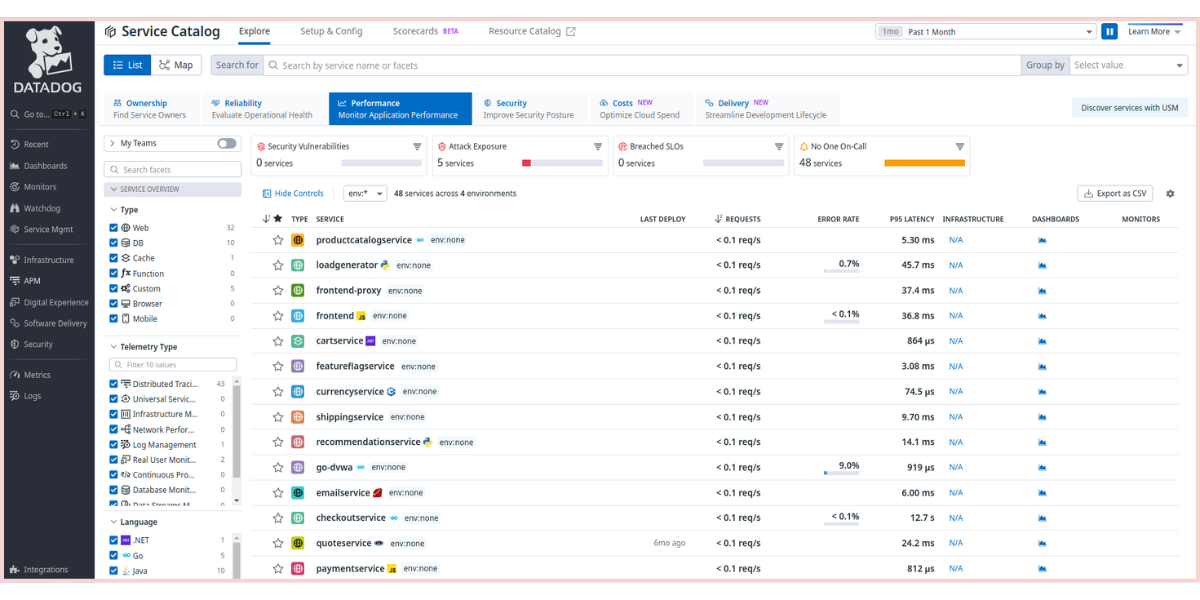
Infrastructure Monitoring: Datadog
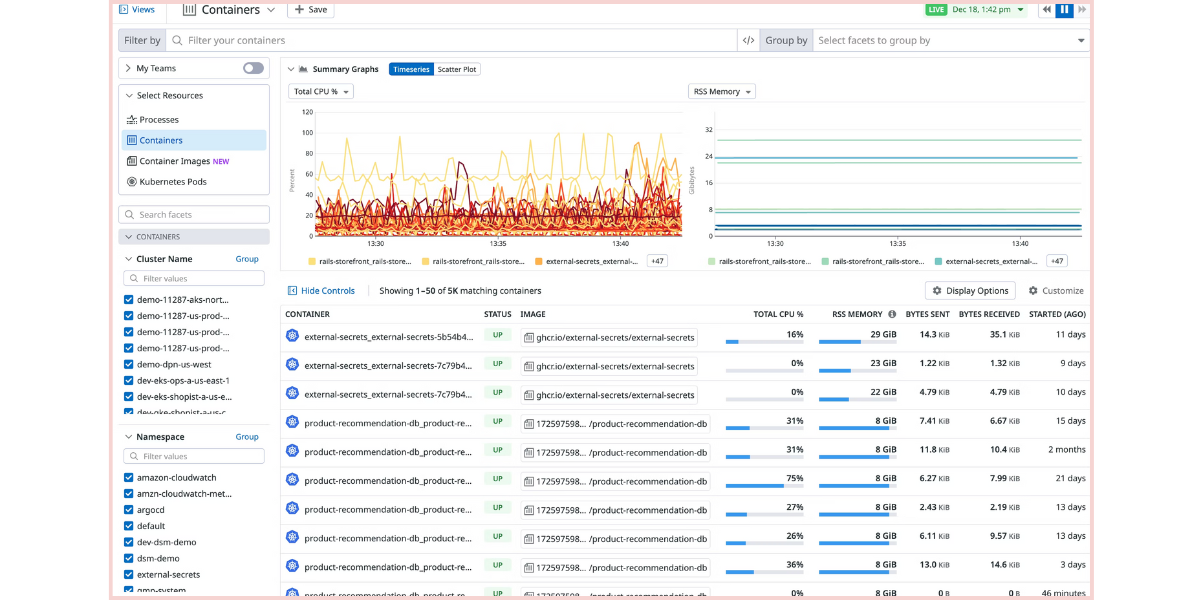
Datadog’s Infrastructure Monitoring comes with four components - one listing all the available hosts or infrastructure, then a separate tracing feature for containers (Kubernetes) and processes.
They use a honeycomb chart to display Infrastructure metrics with green showing 0% utilized CPU and orange being 100% utilized CPU. Furthermore you can click on each hexagon and view the host metrics inside for upto six integrations.
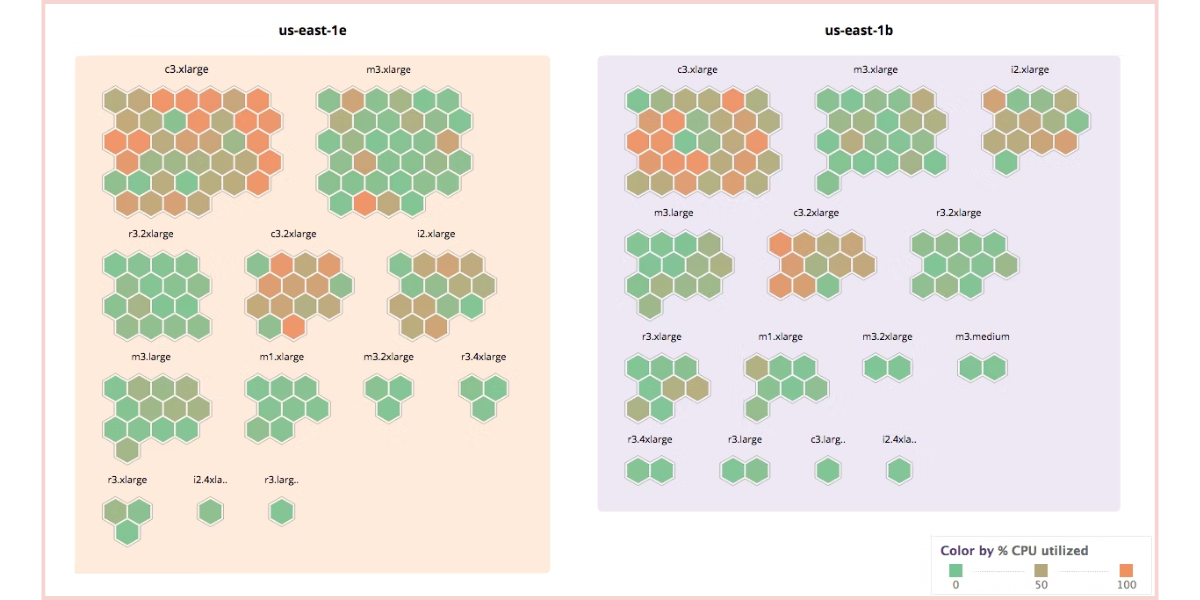
With the filter input bar in the top left, you can filter metrics by tags or attributes. You can also group them using the Group input, into hosts falling under a particular category.
When we come to New Relic, the product is almost similar to Datadog. They also have metrics view for hosts, kubernetes, network, inventory and events, and the same integrations involving Azure, Google Cloud, AWS etc.
Both were comparable in terms of visualizations too. So, if I have to choose one then it will have to totally depend on which I liked better for the interface and at what cost do they get it done for me?
Coming to that, Datadog starts at $15 per host per month while in New Relic there is no cost per host given, it is rather based on data ingestion and number of users.
| Features | Datadog | New Relic |
|---|---|---|
| Environments | Supports on-premise, hybrid, IoT, and multi-cloud setups | Works seamlessly with cloud and on-prem infrastructure |
| Visibility | Provides tens of thousands of metrics with easy correlation | Offers insights to troubleshoot hybrid infrastructure and microservices |
| Integrations | Offers vendor-backed integrations for Kubernetes, serverless, and 700+ technologies | Features close to 750 integrations and pre-built dashboards |
| Historical records | Maintains historical data, even for resources that no longer exist | Enables time travel to incidents origins and replay historical states |
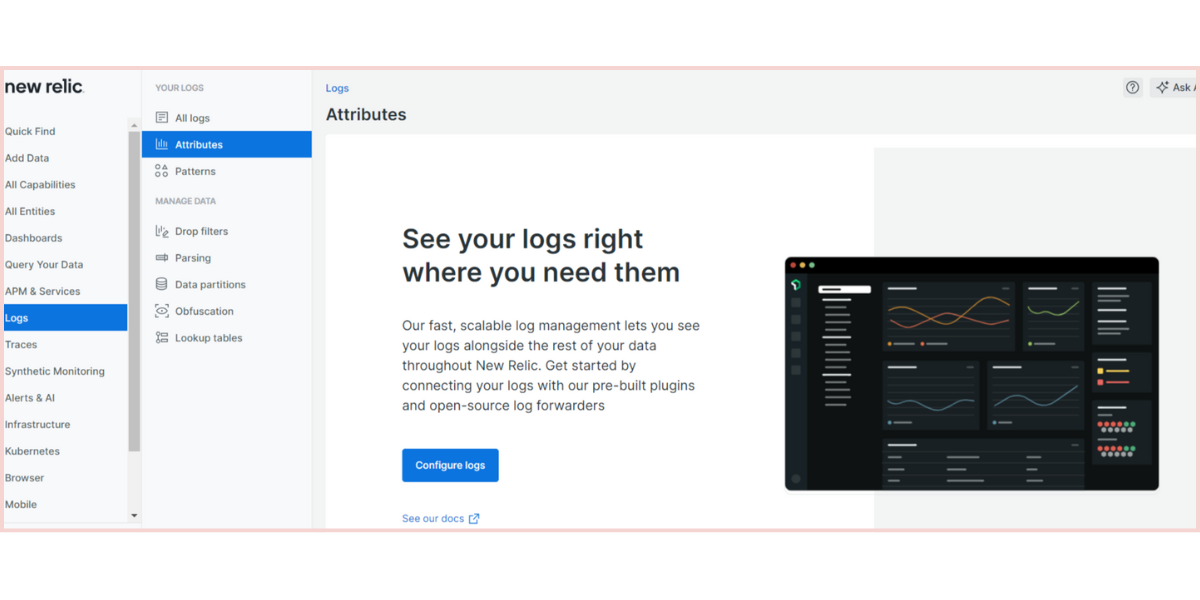
Log Monitoring and Management: New Relic
In Datadog Logs management, as a first step you will have to enable their agent in the config file (because by default, it is disabled and thus logs will not be collected automatically). Once you’ve done this, activate whatever integration you have used in your application. For example, if you have a java integration in your project, activate java agent.
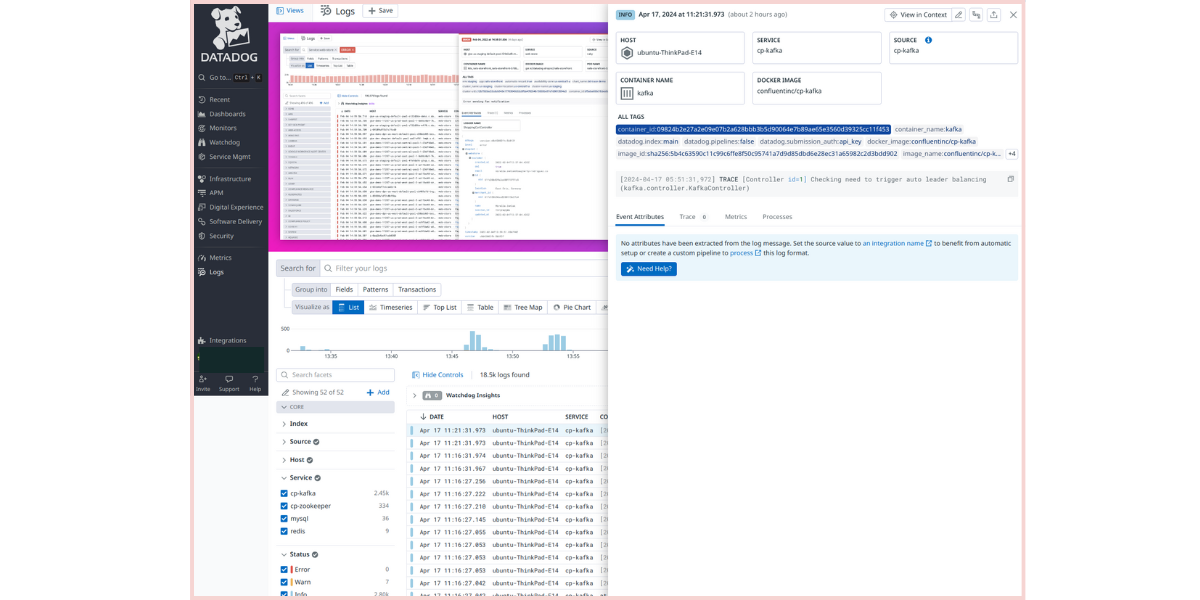
Both Datadog and New Relic offer automatic log pattern detection, but Datadog provides more extensive options for analyzing log data in its user interface. Datadog also allows users to utilize their own cloud storage for long-term log storage, which is a convenient feature for scaling log data ingestion. Although setting up log collection may take longer in Datadog compared to New Relic, Datadog offers more visualization options for log analysis.
| Features | Datadog | New Relic |
|---|---|---|
| Ingest data from | Any source, at any scale | Any text-based data using optimal forwarders |
| Tracking | Tracks trends, metrics, and KPIs from all logs | Blends logs with real-time metrics for context |
| Dashboard | Visualizes logs data on customizable dashboards | Automatically clusters logs into patterns |
| Search and query | Allows easy search, filter, and analysis without complex queries | Provides no-code search with unified filters |
| Related Features | Offers Live Tail & Logging Without Limits | Provides Infinite Logging using S3 buckets |
| Ingest | Starts at $0.10 per GB ingested or scanned GB/month | Starts at $0.10 per host per GB ingested/month |
| Retention | Offers various retention options, starting at $1.06/million log events/month for 3-day retention | Standard retention is 30 days |
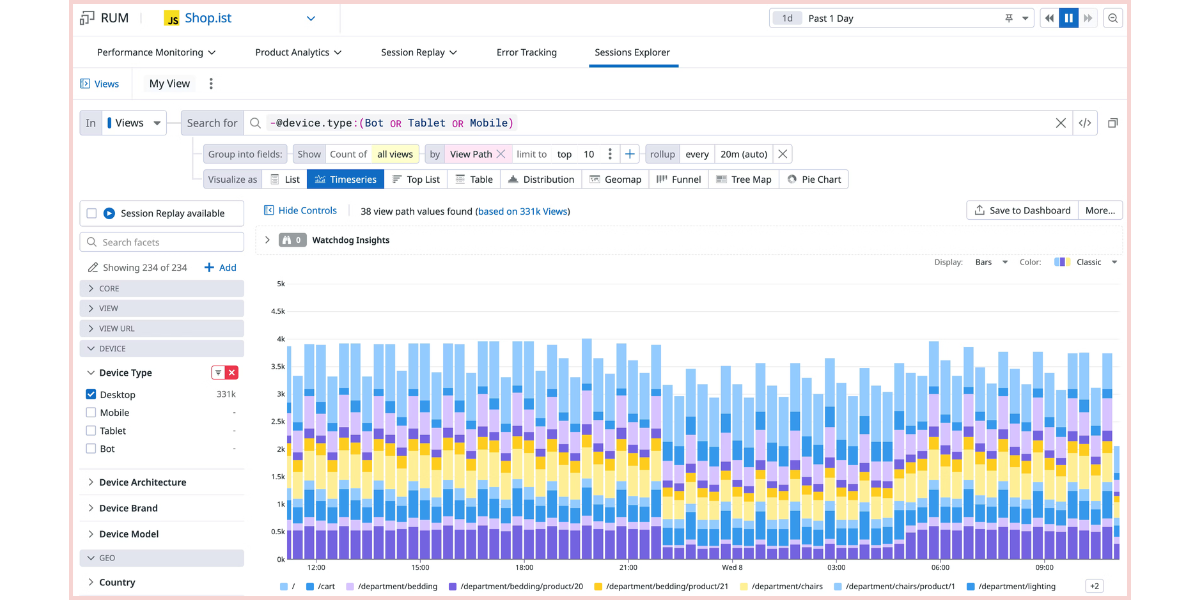
Real User Monitoring: New Relic
Datadog’s RUM was not up to date when comparing New Relic’s. Their single session lasted up to four hours which is a good thing, because in New Relic, if your application is not used for 15 minutes, the session ends.
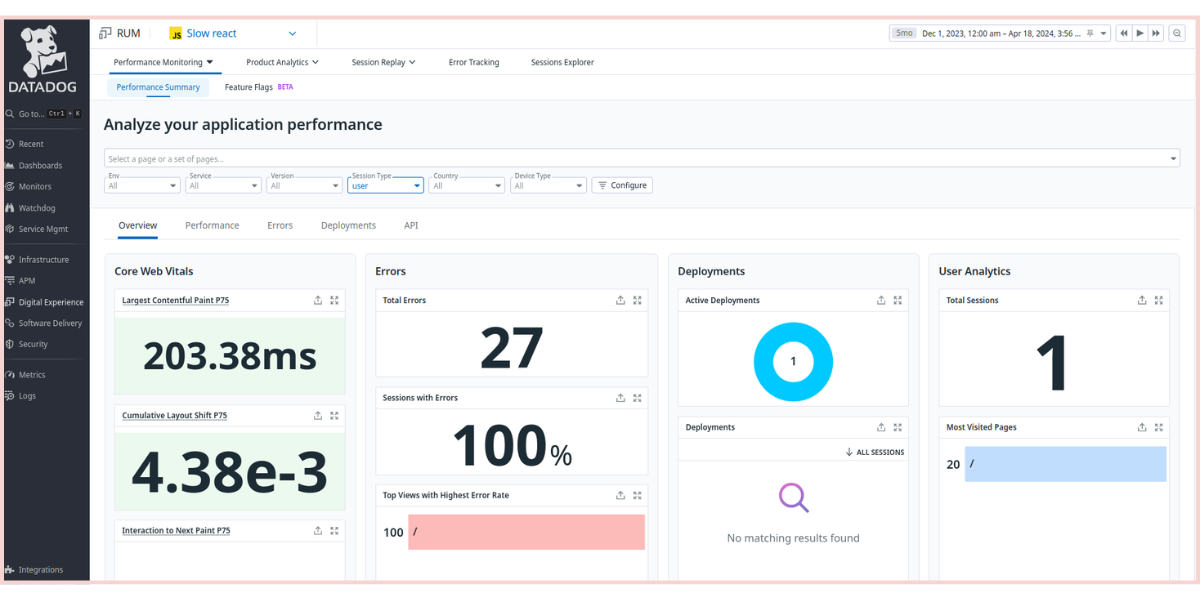
Datadog has a session replay with which you can see the entire transactions in a particular session. RUM coupled with Session Replay is considerably a good deal.
New Relic offers RUM as Browser Monitoring. They collect data on core web vitals, user time on the site, page load time , among others. The best feature when it comes to New Relic RUM is that it provides the four golden signals without even any additional configuration ( as soon as a project is integrated, it will automatically show if the page is experiencing latency, or errors and so on). Apart from this, they have the regular transaction time measurement, apdex scores and SPA performance errors.
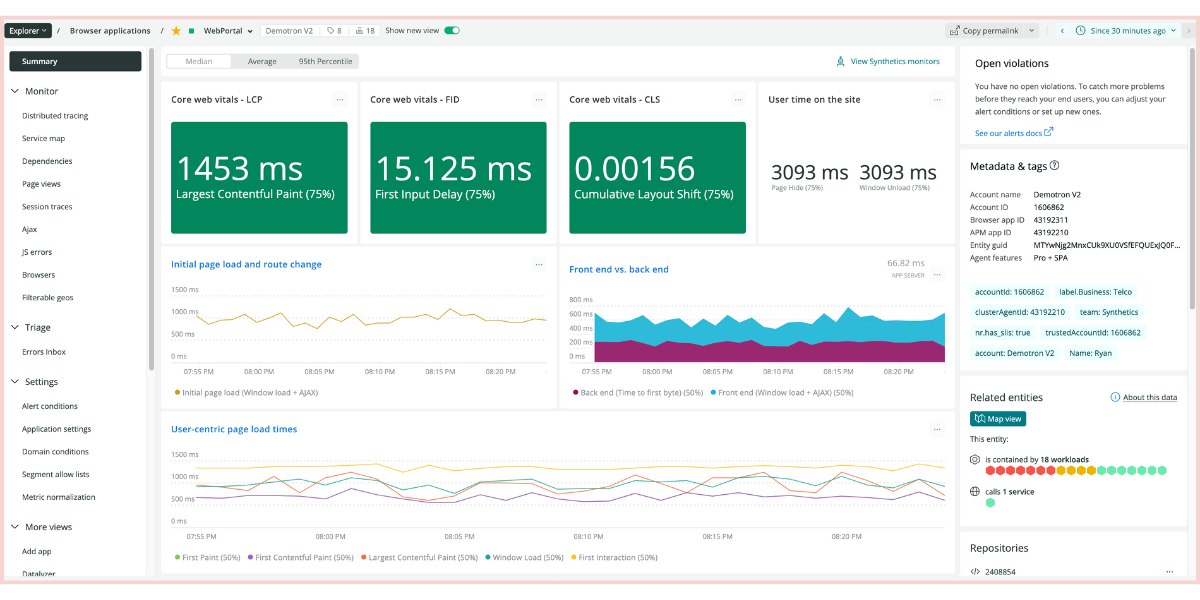
As you can see New Relic has more information when it comes to RUM. New Relic is a clear winner here.
| Features | Datadog | New Relic |
|---|---|---|
| Visibility | Monitors web apps, native mobile apps, and app backends | Provides browser and mobile monitoring capabilities |
| Core web vitals | Tracks page load, interactivity, and visual stability, with filters for location, device, etc. | Monitors page load, interactivity, and visual stability, with alerting when vitals drop |
| Full session analysis | Offers contextualized user session attributes and ingestion of custom metrics, tracking critical user actions | Provides insights into route changes, API calls, and resource impact on user experience |
| Native mobile apps | Troubleshoots app crashes, connects server-side and client-side metrics | Auto-captures common client attributes, offers full app lifecycle visibility |
| Session replay | Allows session replay with a 30-day retention policy | Enables incident reproduction using event trails and mobile breadcrumbs |
| Integrates with | logs, APM, and profiler | APM |
Synthetic Monitoring: Tie
New Relic’s Synthetics offers simulation for web applications and APIs. In New Relic you can integrate Synthetics with APM and Browser.
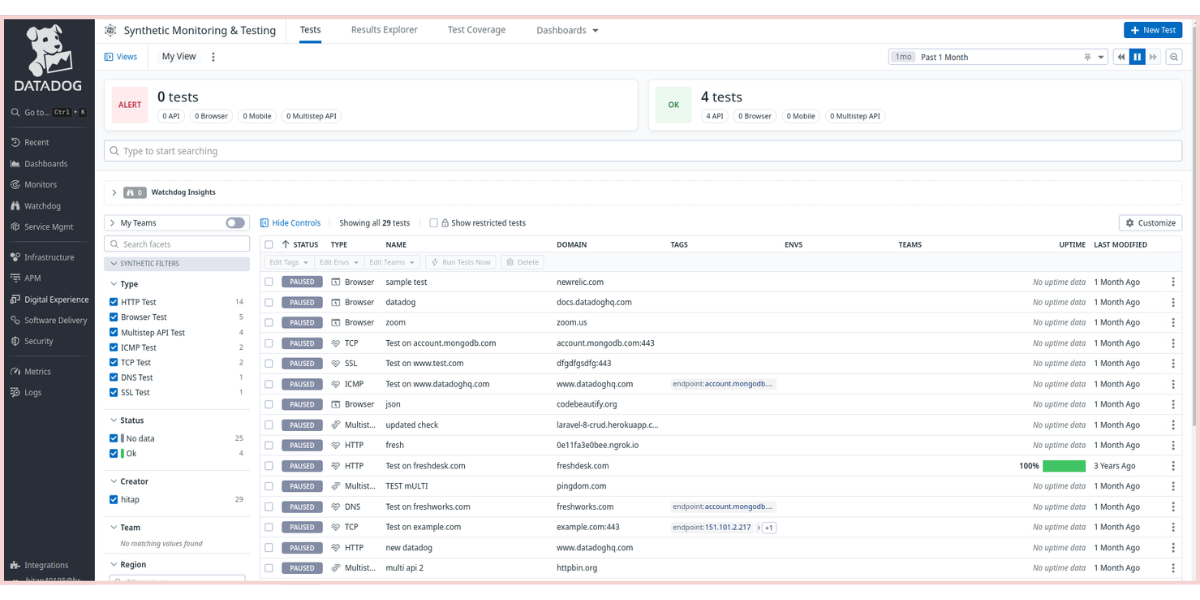
When it comes to Datadog, they provide screenshots of simulated sessions and how your application responds to that. For further details, look into the table below.
| Features | Datadog | New Relic |
|---|---|---|
| Locations | Simulates requests and actions globally, including synthetic private locations | Simulates traffic from multiple public and private locations |
| Monitor types | Supports various request types such as HTTP, SSL, DNS, WebSocket, TCP, UDP, ICMP, and gRPC health checks | Offers broken link, certificate check, ping, step, and scripted browser monitors |
| Troubleshooting | Provides full context for troubleshooting failed test runs with correlated metrics, traces, and logs | Tracks and reports SLOs and SLAs for uptime and performance, with over 300 optimization recommendations |
| Record | Records browser tests and monitors customer experiences with end-to-end tests | Captures screenshots and simulated sessions, allowing configuration of test schedules and alerts |
| Test in CI/CD | Integrates with CI/CD pipelines for seamless testing | Automatically passes/fails builds based on performance budget in CI/CD pipelines |
Security Monitoring: Datadog
New Relic does not have any Security Monitoring feature yet, but Datadog is quite strong with its Cloud SIEM.
Datadog Security Monitoring has a set of solutions starting with Application Security Management, Cloud SIEM and Cloud Security Management. Their Cloud SIEM is coupled with Log Management, so you can automate threat detection and respond faster and more efficiently.
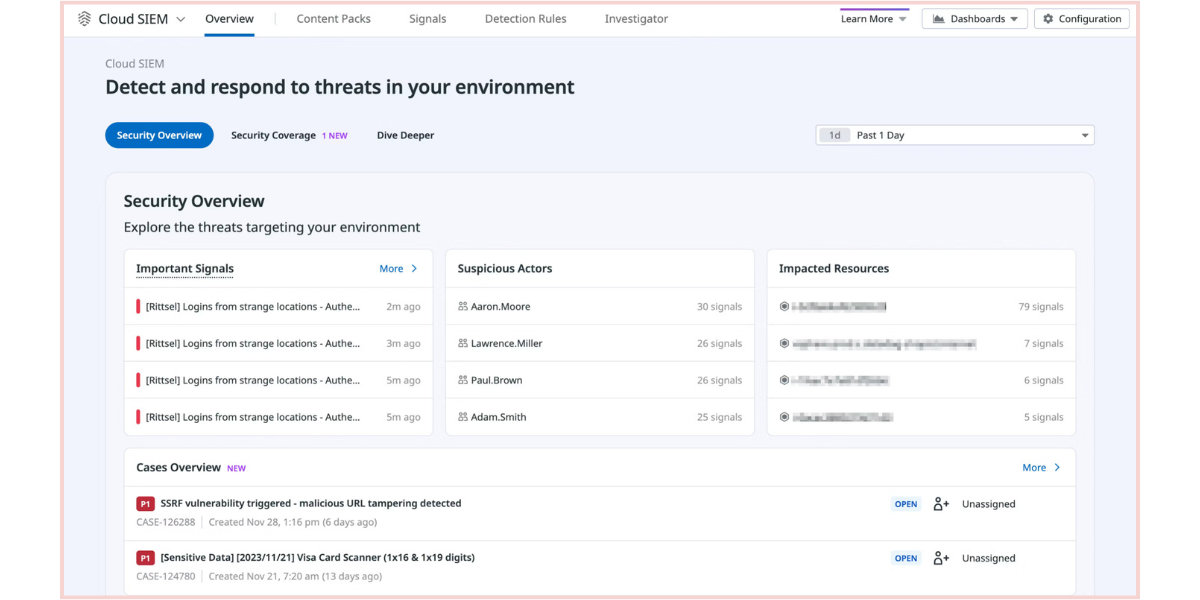
Datadog's new security integrations provide additional contextual information about user authentication history available on their Google Workspace and this will help in improving our investigation into threats and alert us promptly. With Datadog's Detection rules you can apply conditional logic to the entire event stream which will automatically assign severity based on set thresholds.
All this being said, but some reviews were wary of retention periods and the additional costs of shipping data to their servers from Cloud providers.
However, since New Relic doesn't offer any solutions in this area yet, it is only right to give a point to Datadog here.
User Interface and User Experience: New Relic
The user interface in both tools is starkly different. Upon attempting to log into my Datadog account, I was immediately struck by the challenge of navigating their site. The interface could be described as confusing. For instance, when accessing their APM dashboard, I encountered difficulty changing the time period within the main dashboard.
On the side panel, within the APM section, they provided other features like Error Tracking and Explorer. It's not a neat interface, but once you get to this point, you can view all the errors in your project as well as set the time for which you need to measure. Further, within the APM section, they bundled up Database monitoring, Data streams monitoring, and API Catalog. To put it in a nutshell, it was clumsy.
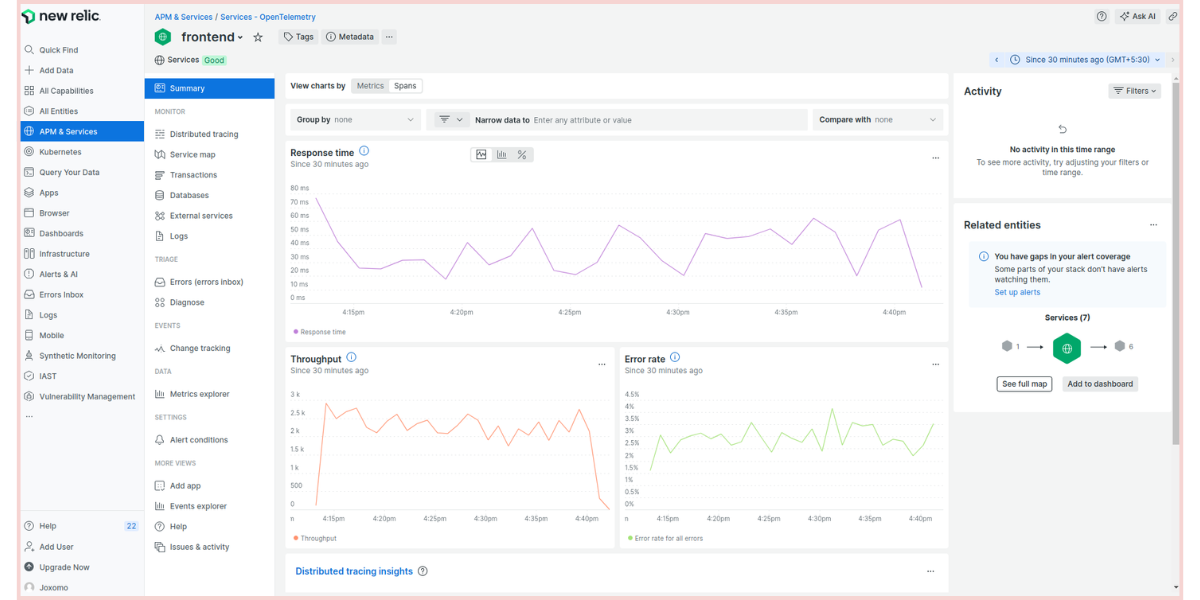
Now, moving on to New Relic, the interface seemed easier. All of their services were listed on the side panel. So the first thing for me was definitely easier navigation. New Relic scored a point here. I’ve attached a screenshot and you can see the difference for yourself. You can change the time period on the right side top corner.
New Relic’s UI is more intuitive, much easier to navigate (you can feel it while querying data), they have done a pretty good job with arranging all that data considering the tool’s complexity.
Data Querying and Visualization: New Relic
When we come to the visualization capabilities of these tools, they are definitely one of the best in the market. Both provide exceptional methods to visualize the data through charts, query languages, and other visualization types for making customizable dashboards.
Datadog has Lists, Timeseries, Top Lists, Nested tables, Funnels, Tree Maps, and related events as part of their visualization overview.
Lists - to view paginated results of a single event organized by timestamps. You can rearrange the column, add or remove columns as you see fit here.
Time Series - to measure the evolution of a single measure in a particular time frame. Additionally, you can choose to view them in the form of bars or line graphs.
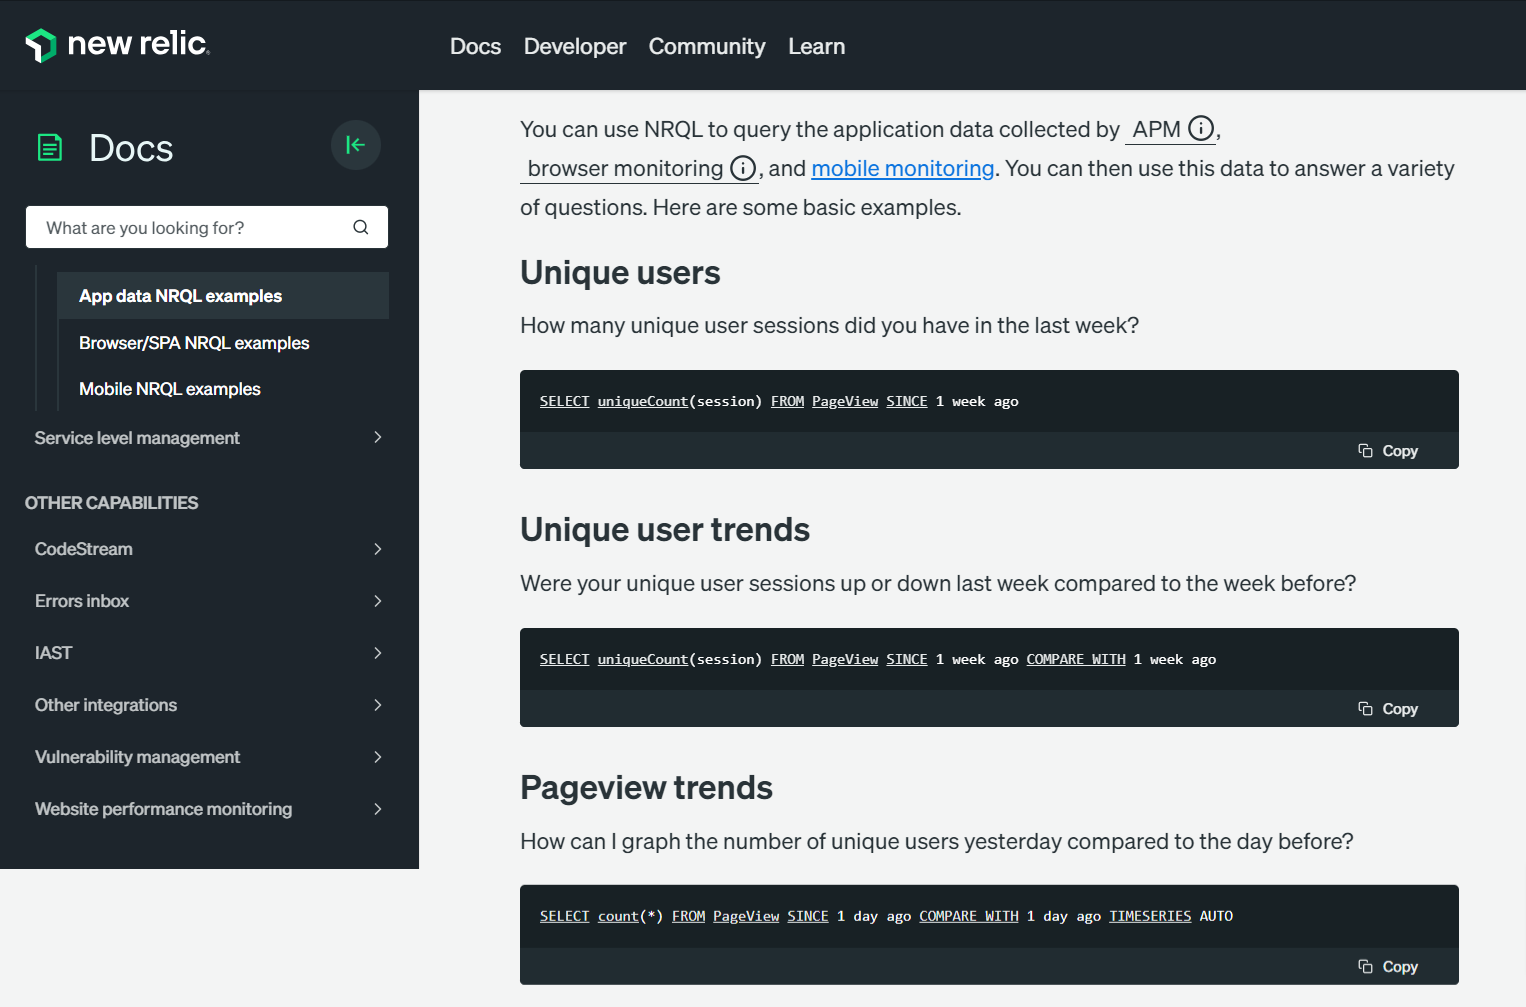
New Relic also has all of the visualization features listed above as Datadog, but what sets it apart is its self-scripted query language - the NRQL.
New Relic Query Language (NRQL)
New Relic uses a separate Query Language, NRQL to query data and visualize them into charts and Dashboards. While charts are representations of singular events or queries, dashboards correlate them with each other and give us a complete picture. In New Relic, you can export the chart or download it as PDF.
Since they use a separate query language, they have given how to use it in their docs, which seemed an easy read.
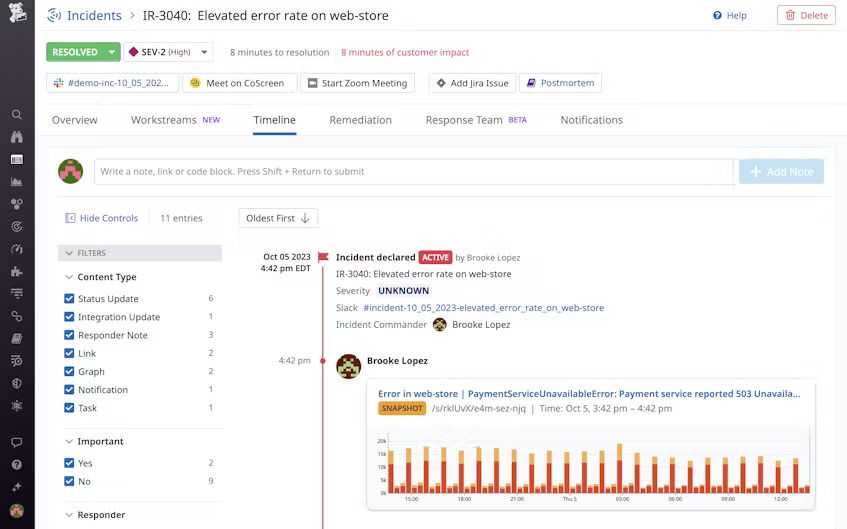
Incident Handling and Alerts: Tie
Incident management is all about whether you are up to date on some metrics like - latency, traffic, errors and saturation. Incident management is something very important but always overlooked.
New relic automatically triggers the Four Golden Alerts as soon as you add a project and was prompt in identifying any latency or errors within the application. The AI enhancement in New Relic can alert you for each incident and pinpoint the exact issue and location. This saves time and effort in troubleshooting and makes monitoring and observability more efficient. It's good to see that monitoring tools are incorporating advanced AI capabilities.
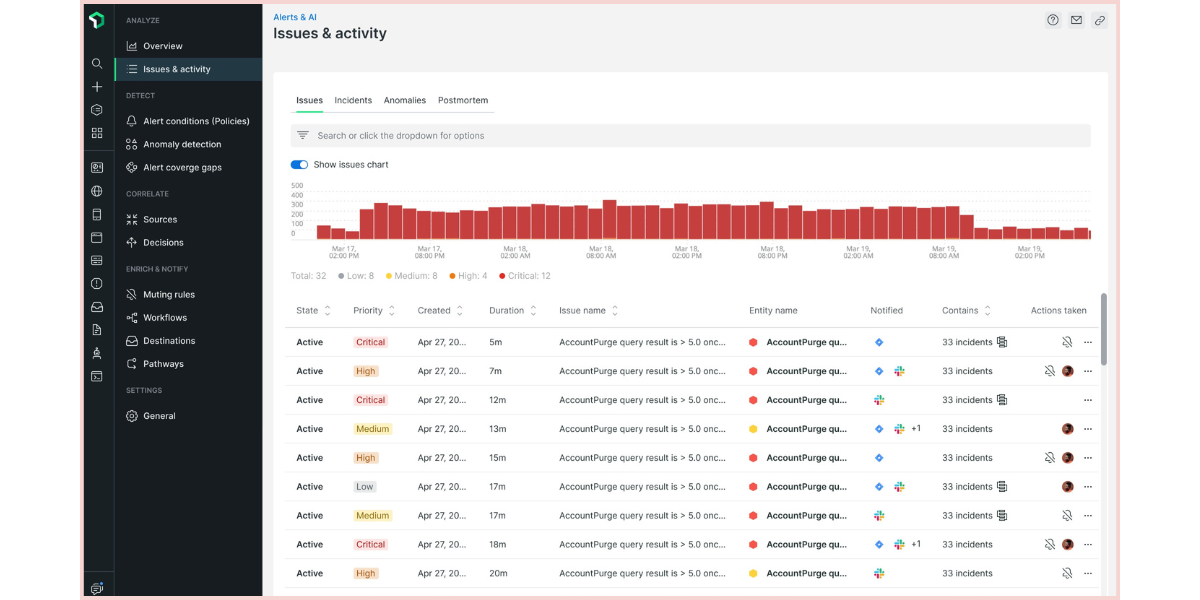
Datadog doesn’t have a detailed AI feature yet. But keeping that aside, their incident management is very effective. You can declare incidents directly from a graph, clipboard, or monitor using the declare_incident function. They follow a five-level severity scale for incidents. Datadog uses a Bits AI copilot which provides a summary of incidents during the post-mortem analysis.
Price Points and Comparison: Depends
In Datadog, each product, such as APM, logs, or infrastructure monitoring, carries its own pricing, making it challenging to calculate your exact expenses. Further, Datadog establishes a standard metric framework; any metrics beyond this framework are classified as custom metrics. Carelessness in monitoring these custom metrics could result in a substantial portion of your bill.
- Custom metrics have a separate charge, which is not priorly informed
- Monthly billing is 20 - 50% higher than annual billing
- Infra monitoring has a limited free plan with Pro plan going upto $15 per host per month
New Relic
New relic pricing is based off mainly two things: Amount of data ingested and Users
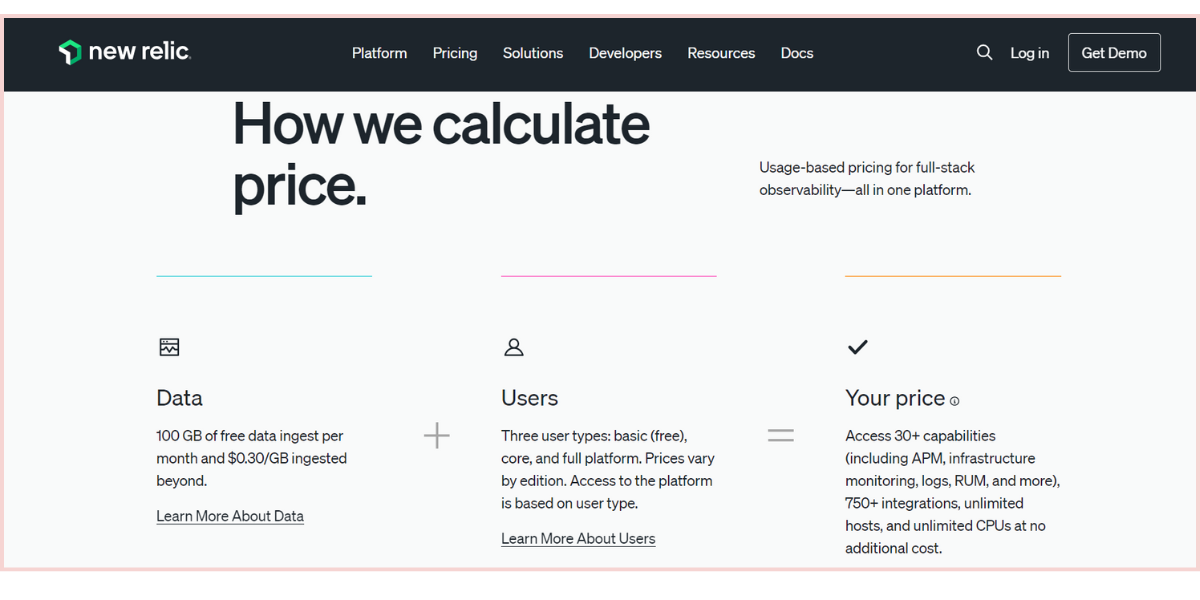
- 100GB free data ingestion monthly
- Additional usage will cost $0.3 - $0.5 depending on the subscription tier
- Standard plan allows only 5 user seats for full platform usage
- If you upgrade to enterprise plans, the cost will come upto $549 per month.
User Reviews: What the Community is Saying?
User reviews are a great source of information on what happens within the platform. As each user encounters a different problem, we will see how the tool is capable of handling a variety of these issues and incidents.
While I was going through some of the G2, Reddit, and X (formerly Twitter) reviews, there were tons of experiences shared by developers and their community users.
New Relic
- The first thing that caught everyone’s attention was the free New Relic subscription. As much as it surprised me, I found so many others were, too. People were optimistic about their APM and particularly pointed out the accuracy of the data. However, documentation-wise, New Relic was not of much help.
- Some people also commented about tool grouping, but I’m not very sure if it was after they updated their new UI. Now, when I use it, I find the interface very neat and well-arranged. NRQL was another pain point; users found it less friendly than SQL.
- If you are going to try out New Relic hereafter, just keep in mind that they charge according to the quantity of data ingested. So, implore if they give enough control over metrics transferred.
Datadog
- Coming to Datadog, everyone was all praise for its unified observability—users applauded the way data was available in a single place. Another good feature was its documentation—it’s a really well-written document, I must say.
- However users were wary of the high pricing, and I’ve discussed the pricing in the previous section.
When to Choose What?
We have thoroughly discussed both of these tools. However, if you are short on time, here is the content you were looking for.
Choose Datadog If:
- You are looking to compare data (platform status, network status, performance traces and logs) from all platforms in a single dashboard.
- You require robust correlation between signals.
- Log imports from AWS work better and faster than using AWS Cloudwatch.
- You are looking for Cloud SIEM uses.
Cons:
- Pricing is expensive. Custom metrics are not included initially and will cost you extra.
- Steep learning curve, you will need to go through tutorials if you’re a beginner.
- You cannot pull data as csv/txt file without installing their agents (if you’re worried about using a new agent in your instances and servers)
Choose New Relic If:
- You want transparent Pricing - they bill based on usage.
- You are looking for tools, especially for Real User Monitoring.
- Azure VM data reports are detailed - includes garbage collection, heap, memory allocation, objects allocation etc.
- You desire for AI recommendations on your application metrics.
Cons:
- The quota on users for billing can be a concern if you are taking the tool for your entire company but only require dont require advanced features for all employees.
- Service discovery was not up to the mark as reviewed by some users. You will have to manually install agents many a time, and their documentation remains outdated.
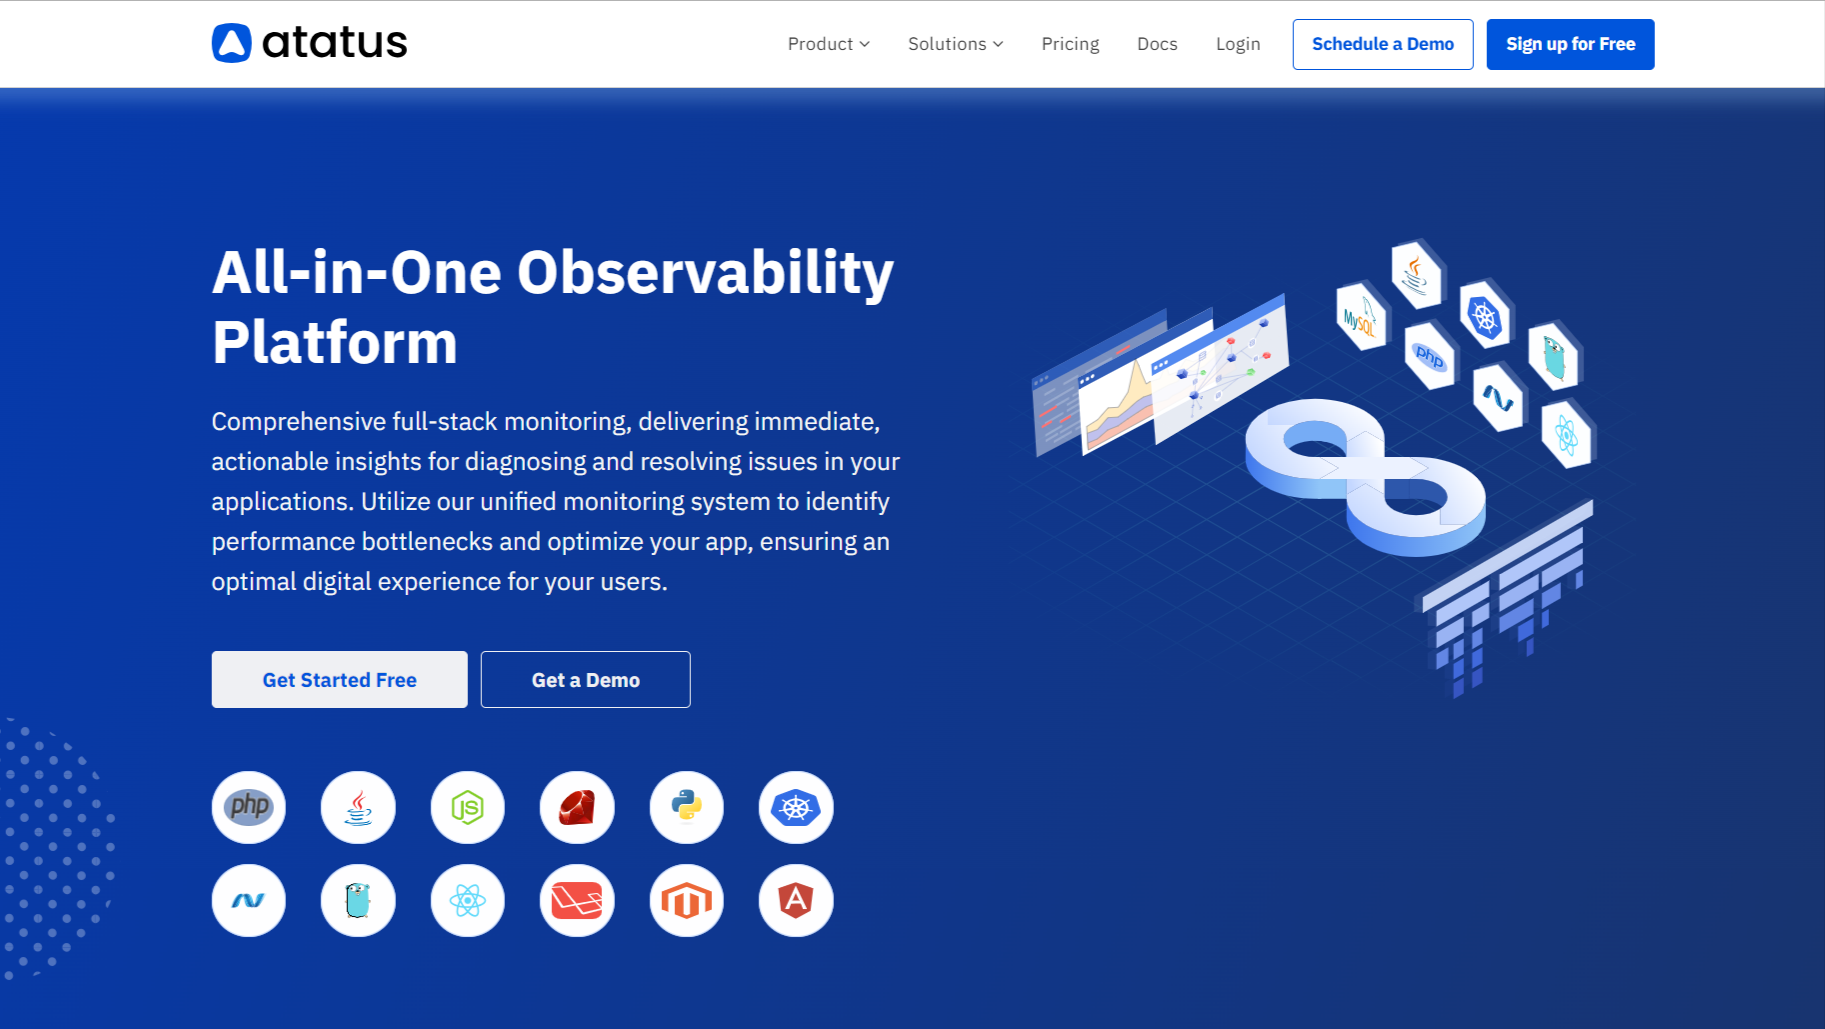
Atatus: Your Affordable Alternative to Datadog and New Relic
Atatus is a comprehensive Observability solution that provides an excellent alternative to Datadog and New Relic.
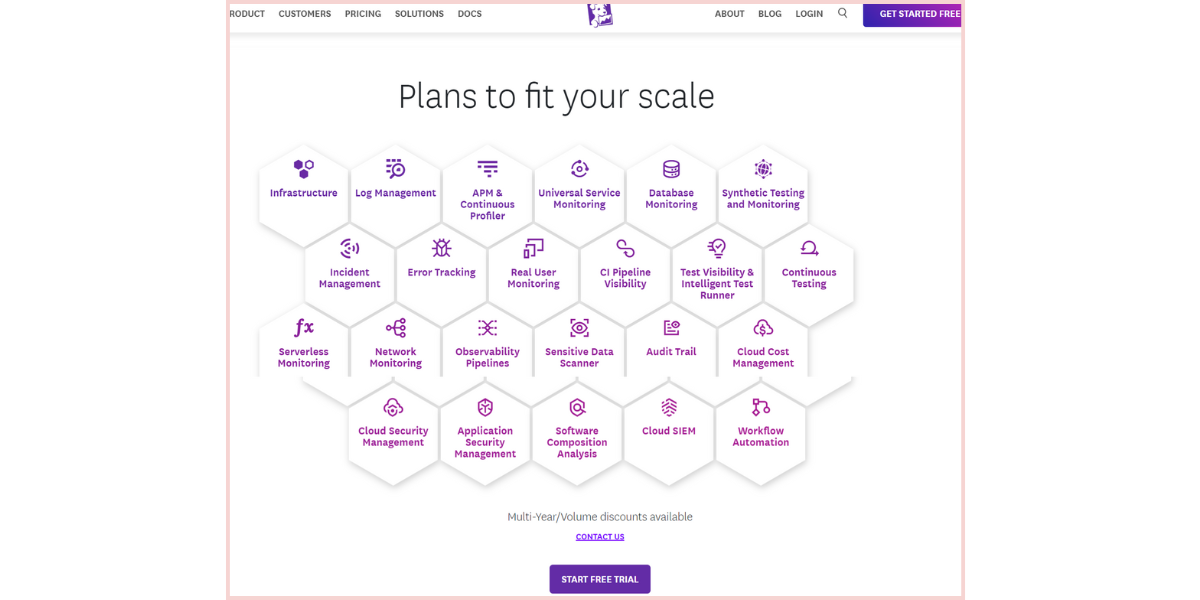
Atatus hosts a list of products including Application Performance Monitoring, Infrastructure Monitoring, Database Monitoring, Logs Monitoring, Real User Monitoring, API Analytics, and Uptime Monitoring (Synthetics) among others.
With Atatus, you get real-time insights into your application's performance, user experience, and infrastructure health. Our customizable dashboards allow you to track performance metrics tailored to your specific needs, while our intelligent alerting system notifies you of performance anomalies in real-time, enabling proactive troubleshooting. With end-to-end tracing capabilities, you can trace transactions across distributed systems and identify bottlenecks.
Atatus offers 100+ integrations and now we also offer OpenTelemetry support. You can directly pull data from OpenTelemetry code instrumentation or Collectors.
Compared to New Relic, Atatus allows you to see the percentile for your XHR performance, the individual AJAX call and REST API issues causing the application to slow down, and also see each AJAX event individually using their AJAX monitoring.
The advanced error tracking feature of Atatus captures all backend errors that occur in your application, by pointing to the exact location of the code, causing the exception.
Atatus is incredibly easy to use, with a user-friendly interface and intuitive setup process, allowing your team to focus on delivering exceptional user experiences without the complexity.
Don't just take our word for it - listen to what our customers have to say. Look at these G2 reviews.
Try our 14-day free trial and let us know your thoughts on it.
#1 Solution for Logs, Traces & Metrics
![]() APM
APM
![]() Kubernetes
Kubernetes
![]() Logs
Logs
![]() Synthetics
Synthetics
![]() RUM
RUM
![]() Serverless
Serverless
![]() Security
Security
![]() More
More