Debugging in PHP
PHP is a great language to start with when you are learning how to code. It has a simple syntax, it’s easy to learn and you can make dynamic websites with it. But even though it’s easy to write PHP code, it’s not always easy to debug. There are a lot of tools out there that can help you, but since PHP is an interpreted language, you can also use a couple of debugging techniques to help you find bugs in your code.
In this blog post I'll cover the the following sections.
#1 What is Debugging?
The term bug was first used by Thomas Edison. Debugging is nothing but diagnosing the errors in the programs and determining how to correct them. The most common type of mistakes are:
- Programming without thinking
- Writing code in an unstructured manner
The debugging process involves multiple steps like
- Identifying the bug
- Identify the location of the bug
- Analysis of the bug
- Fix the bug
- Apply the fix and test
Why do we need Debugging?
- Reports an error immediately so that we can detect the errors in it’s earlier stage.
- It assists the developer in reducing useless and distracting information.
#2 Debugging Techniques In PHP
If the application has some fatal or syntax error we can find it easily since the terminal or console will itself show where the error has arisen. When it comes to logical error or show erroneous data one has to debug the code. The simple way to debug code is by echoing the output values.
Here are a few functions which you can use for debugging, will help you in printing the output values.
- Method 1: var_dump()
- Method 2: print_r()
- Method 3: get_defined_vars()
- Method 4: debug_zval_dump()
- Method 5: debug_print_backtrace()
- Method 6: debug_backtrace()
Method 1: var_dump($var)
- Used to dump information about a variable.
- Displays structured information such as the type and value of the given variable.
Syntax: var_dump(variable1, variable2, ….variable n)
Sample Code:
<?php
$var_name3="678";
$var_name4="sara";

echo var_dump($var_name1)."<br>";
echo var_dump($var_name2)."<br>";
?>
Output:
string(3) "678"
string(4) "Sara"
Method 2: print_r($var)
- Prints the information stored in a variable.
- Prints the value stored in the variable in a human-readable format.
Syntax: print_r(var_name, return_output)
Code:
<?php
$var1="sara";
$var2=123456;

print_r($var1);
echo "<br>";

print_r($var2);
echo "<br>";

$arr = array("Name"=>"Sara" ,"Age"=>20);
print_r($arr);
?>
Output:
sara
123456
Array ( [Name] => Sara [Age] => 20 )
Method 3: get_defined_vars()
- Gets all the defined variables including built-ins and custom variables.
- It returns an array of all the defined variables.
Syntax: get_defined_vars()
Sample Code:
<?php
$array1 = array("Nathan", "Brown");
$arr = get_defined_vars();

print_r($arr["array1"]);
?>
Output:
Array ( [0] => Nathan [1] => Brown )Method 4: debug_zval_dump()
- Dumps the variable with its reference counts. This is useful when there are multiple paths to update a single reference.
Syntax: debug_zval_dump (var_name)
Sample Code:
<?php
$var1 = "Hello World";
$var2 = "";
$var2 = $var1;

debug_zval_dump($var1);
?>
Output:
string(11) "Hello World" refcount(4)Method 5: debug_print_backtrace()
- Prints a backtrace that shows the current function call-chain.
Syntax: debug_print_backtrace() (var_name)
Sample Code:
<?php
$var1 = "Hello World";
$var2 = "";$var2 = $var1;

debug_print_backtrace($var1);
?>
Output:
string(11) "Hello World" refcount(4)Method 6: debug_backtrace()
- Generates a back-trace.
- It will print out the chain of code that leads up to the point where the back-trace function is called.
Sample Code:
<?php
function sample($str) {
    echo "Hi: $str";
    var_dump(debug_backtrace());
    }

sample('Debugging');
?>
Output:
Hi: Debuggingarray(1) {
[0]=> array(4) {
["file"]=> string(61) "/home/vaishnavi/testphp/index.php"
["line"]=> int(6)
["function"]=> string(6) "sample"
["args"]=> array(1) {
[0]=> string(9) "Debugging"
		}
  	}
}
#3 Debugging Tools In PHP
While there are a number of debugging tools PHP developers can use, the best way to debug PHP code is to use the tools that PHP makes available. Here I have listed few most used tools, you can find the best one out of it.
- Xdebug
- ZendDebugger
- phptrace
- phpdbg
- ltrace
- Inotify
Debugging Xdebug in VS Code
It was first released in May 2002 by Derick Rathans. Xdebug is a PHP extension which provides debugging capabilities. It uses the DBGp debugging protocol.Xdebug is a PHP extension which provides debugging and profiling capabilities. It uses the DBGp debugging protocol. At this end this tool is responsible to enable the debugging on PHP, and Xcode takes advantage of it.
Basic Features in Xdebug
- We can set and remove the break points.
- Allows remote debugging.
- Enable call logging functions.
- Sets a manual variable watch.
- Enable profiling.
Installation with VS Code
Visual Studio Code is a free source-code editor which is light-weight yet more powerful made by Microsoft for Windows, Linux and macOS. It supports features like syntax highlighting, snippets, embedded git, debugging and so on.
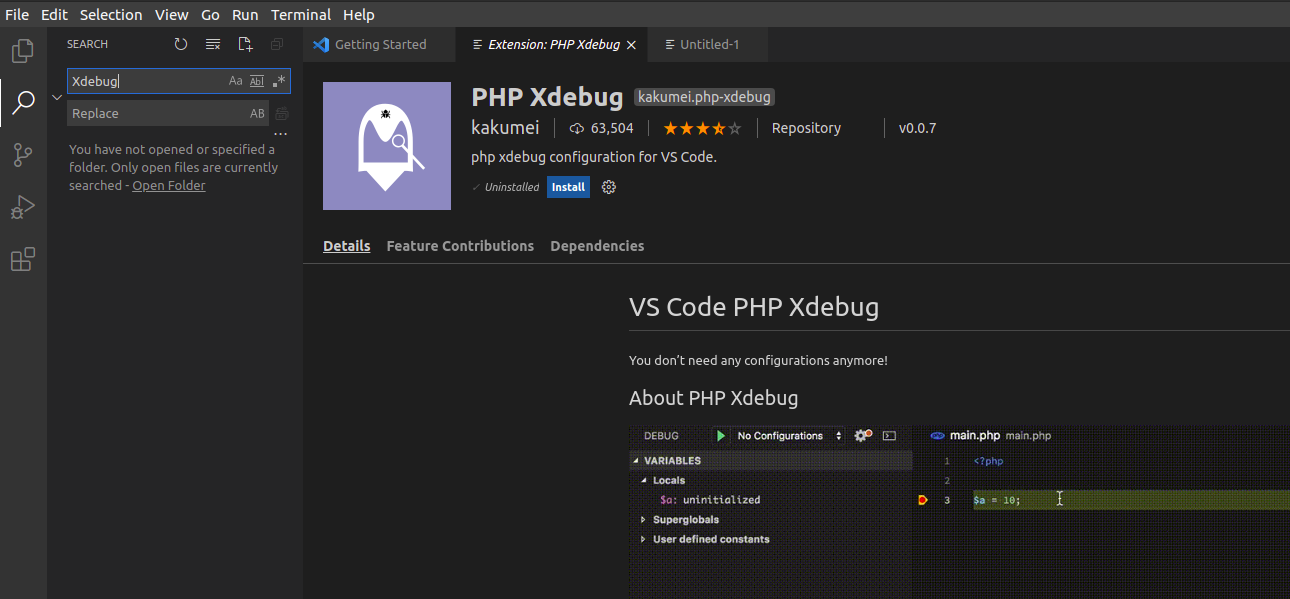
- Install the Xdebug extension plugin.
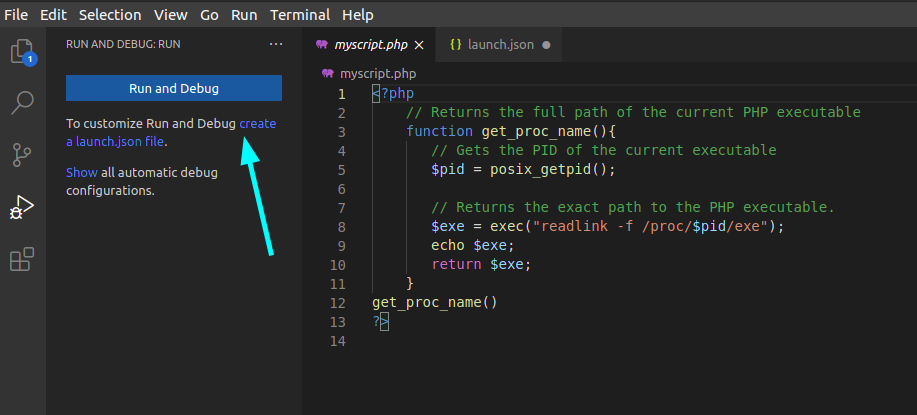
- Click on the debug tab on the left panel and click on the create a launch.json file, select Add configuration.
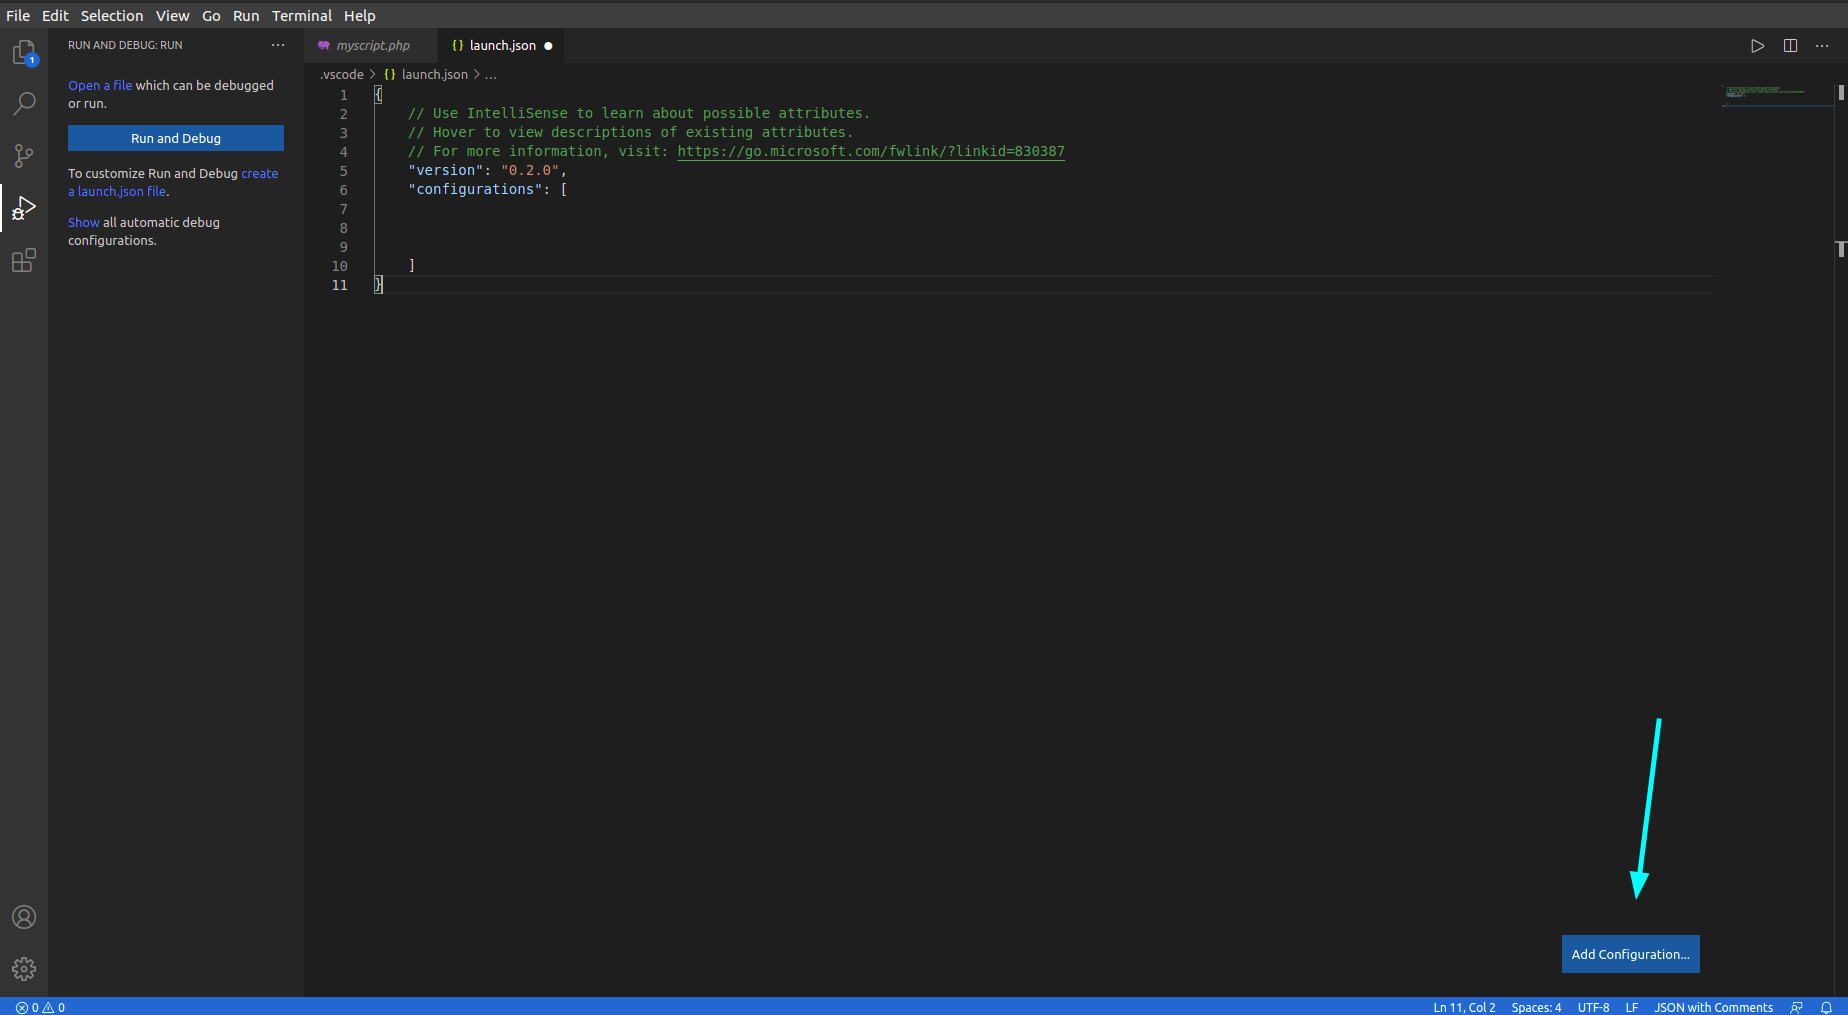
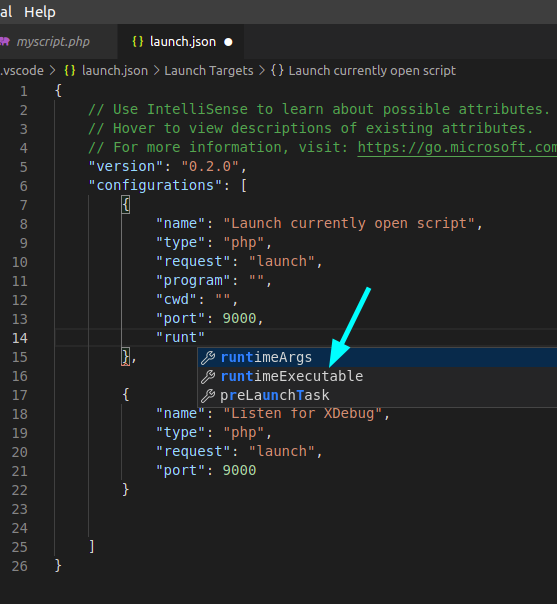
- A launch.json file will get opened and click on the Add configuration button at the right corner of the page.
- Click on the PHP Listen for Xdebug option and click on add configuration button again to add the PHP Launch currently open script option.
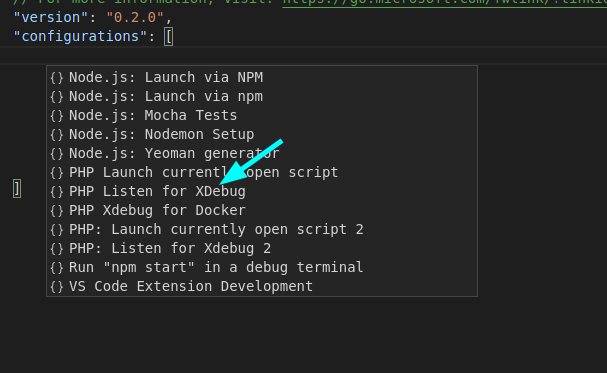
- Click on the PHP option from the drop down menu. A launch.json file will get opened, specify the runtimeExecutable which is the path of your PHP.exe interpreter and save the changes in your launch.json file.
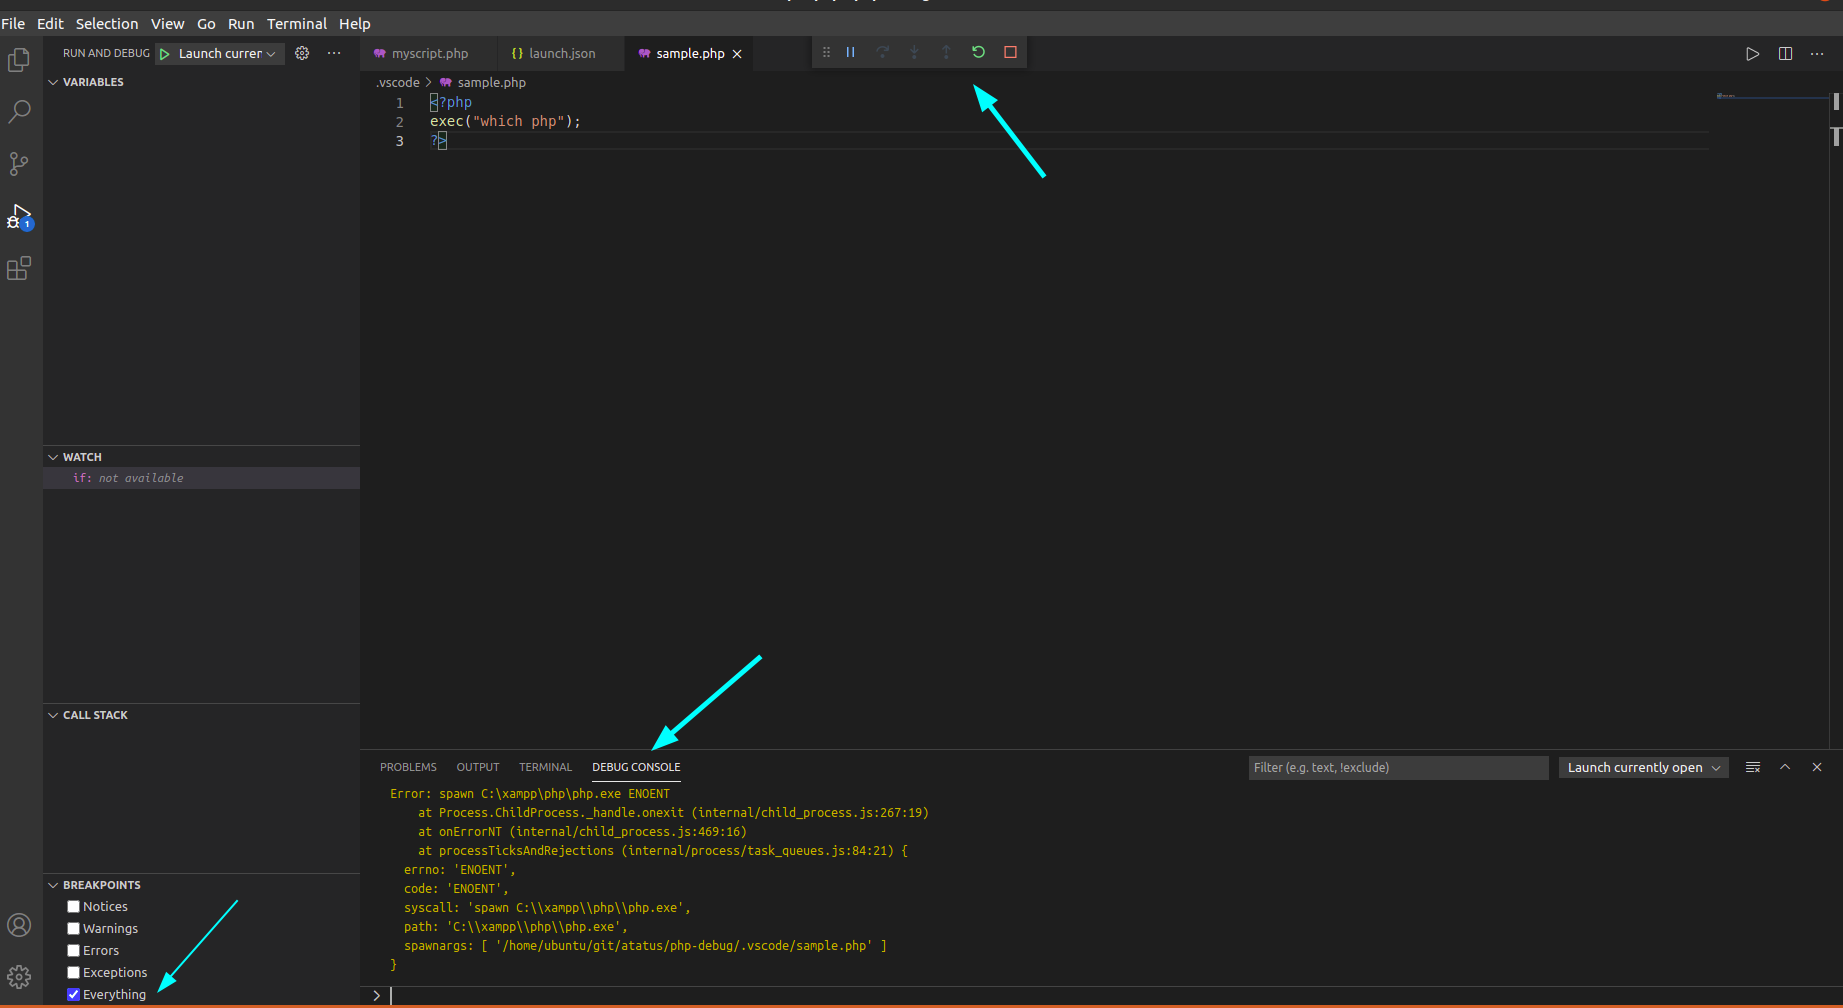
How to debug the code using Xdebug?
After the setting up in VS code you can add the PHP file to start the debugging process. Here I have explained in detail about how to run debug using both Launch currently open script and Listen for xdebug methods.
a.) Using Launch Currently Open Script method:
1. Open a .php file, add breakpoints to your code.
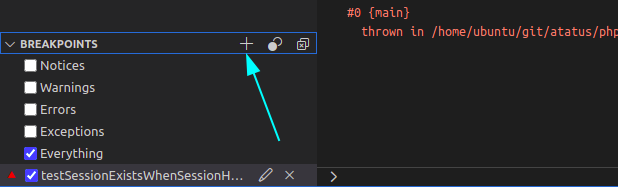
Click on the plus icon and add breakpoints. Breakpoints stop the code execution at every breakpoint so that you can see variables output in only one iteration of code.
You can also add breakpoints in a single click. Click on the line of the code in VS code where you want to add breakpoint.
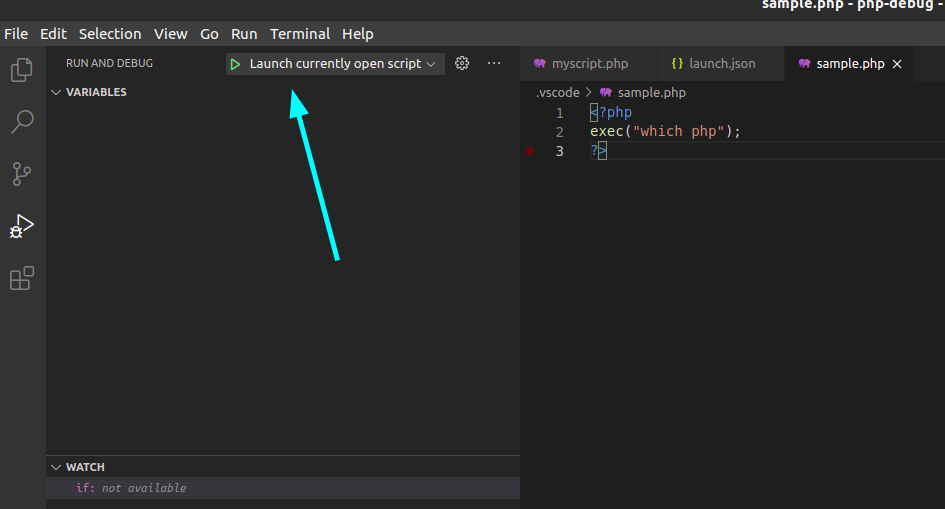
2. Set the debugger to "Launch Currently Open Script". Click on the green play button to implement the "Launch currently open script" feature which helps you in debugging the single script without using a browser.
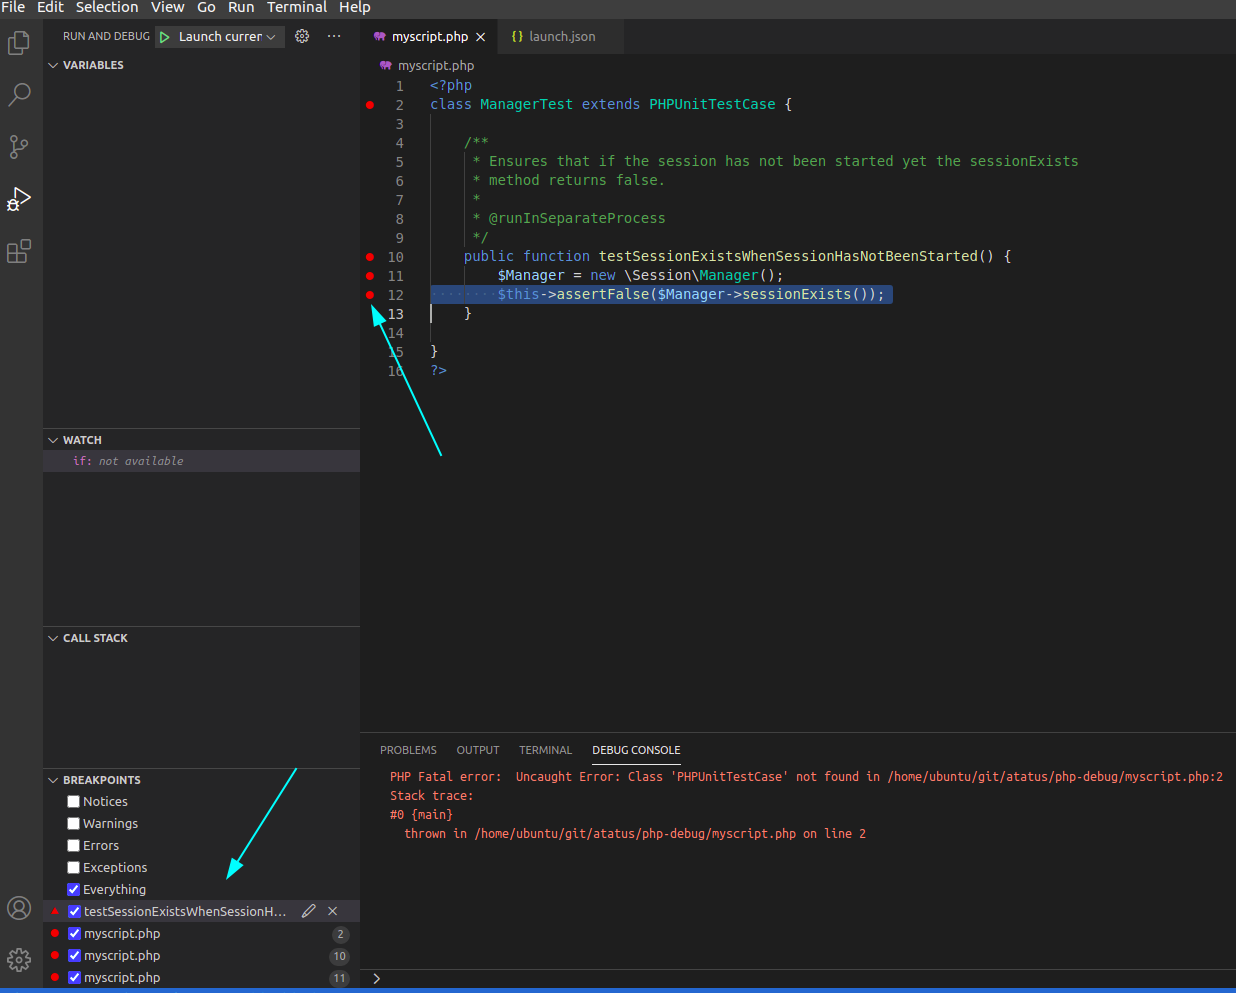
3. To start the debug process, press F5 or click on the green arrow in the top right corner.
4. You will be able to see the debugger break at your breakpoint.
5. Upon clicking on the green arrow button, it starts a listener that will be triggered once you run the PHPUnit test.
b.) Using Listen for xDebug method:
In this method you will need the browser to debug.
- Open a .php file and add some breakpoints.
- Select the debug option to ‘Listen for xDebug’.
- To start the debug process, press F5.
- Open Chrome and navigate to your index.php file.
- Click the new XDebug Helper extension and click the Debug option.
- The helper icon would have turned green.
- Start the debugging process by refreshing the page.
- Go back into VS Code and you will see that it has stopped at the breakpoint.
Advantages Of Debugging:
- Allows the detection of errors in the initial stage and makes the software development process easier using the error reports.
- By finding errors in software, it allows developers to fix the errors before releasing them and provides bug-free software to the customers.
Here are a few steps that can help a programmer to repair errors easily:
- Make sure you have the right information about the error.
- Always refer to the user's guide for more information about the error.
- Make sure that your program is working properly.
- Use the debugger to fix the error.
- Use the resources available on the internet to find
Are You All Set To Debug Your PHP Code?
Every organization wants to be at the top of the market and this is possible only if our software is bug-free. Using debugging we can resolve bugs and produce a bug-free software to our customer. Identifying errors in the early stage while debugging saves time. One can find bugs with their previous experience, learning the product carefully, using print statements and so on.
To boost your revenue keep debugging your code to find all the possible errors before your customer experiences it. In this blog post I have given the brief explanation on Xdebug tool about how to set up it in VS code and how to run. I will cover the other tools in the next blog.
Hope this article helps in debugging your application!!
#1 Solution for Logs, Traces & Metrics
![]() APM
APM
![]() Kubernetes
Kubernetes
![]() Logs
Logs
![]() Synthetics
Synthetics
![]() RUM
RUM
![]() Serverless
Serverless
![]() Security
Security
![]() More
More