Implementing Jaeger for Distributed Tracing in Microservices
Earlier, applications were mostly monolithic, meaning that several programs were written in the same language and placed in the same web stack. However, it is no longer the case today.
Today, every software is comprised of several small application programs coming together each providing a service of its own. These applications are what we call microservices.
A microservice is an architectural and organizational approach to software development in which software is composed of small, independent services that communicate over well-defined APIs. Small, self-contained teams own these services. Microservices also make applications easier to scale and faster to develop.
With the rise of microservices, the need for comprehensive visibility into the flow of requests and responses across multiple services has become increasingly crucial. This is where distributed tracing systems like Jaeger come into play.
You can learn all about Distributed Tracing here - Distributed Tracing: A Complete Guide.
By capturing detailed information about the flow of requests as they propagate through microservices, Jaeger empowers organizations to gain visibility into system behavior, pinpoint performance bottlenecks, and enhance reliability.
In this blog, we will discuss how Jaeger offers distributed tracing capabilities and helps out tracing context across a microservices architecture. Let's get started!
Table Of Contents:
- What is Jaeger?
- How Jaeger Works?
- Distributed Tracing Overview
- How can Jaeger help with Distributed Tracing in Microservices?
- How to Create Traces in Jaeger: A Sample Program
What is Jaeger?
Jaeger traces its roots back to Uber Technologies, where it was developed to address the challenges of monitoring and troubleshooting their microservices-based architecture.
Recognizing the need for a scalable, open-source solution for distributed tracing, Uber open-sourced Jaeger in 2017, thereby making it available to the broader software engineering community.
Since its inception, Jaeger has undergone significant evolution and adoption. It has garnered a vibrant ecosystem of contributors and users from both industry and academia. This collaborative effort has led to continuous improvements, making Jaeger a mature and feature-rich tracing system.
With Jaeger, you can:
- Monitor and troubleshoot distributed workflows
- Identify Performance Bottlenecks
- Track down root causes
- Analyze service dependencies
Organizations across various industries leverage Jaeger for a multitude of use cases:
- End-to-End Visibility: Jaeger provides insights into the entire request lifecycle across microservices, facilitating troubleshooting and optimization.
- Latency Monitoring: Detailed timing information helps identify performance bottlenecks and optimize system latency.
- Error Tracking: Correlating logs and errors with traces enables efficient debugging and issue resolution.
- Service Dependencies: Visualizing service dependencies helps understand system architecture and identify potential risks.
- Sampling Strategies: Configurable sampling strategies balance trace volume and performance overhead.
Now, let's understand how Jaeger works.
How Jaeger Works?
Before getting to Jaeger's workflow, you must know what it is made of. Jaeger is composed of several key components that make it function smoothly and efficiently.
Major Components of Jaeger:
1. Jaeger Client Libraries
- Jaeger provides client libraries for various programming languages, such as Java, Python, Go, Node.js, C++, and others.
- These libraries allow developers to instrument their applications with tracing code to generate spans and propagate tracing context. They also provide utilities for injecting and extracting tracing context from request headers when communicating between services.
2. Jaeger Agent
- The Jaeger Agent is a network daemon that listens for spans sent over UDP or gRPC protocols.
- It receives spans from instrumented applications and forwards them to the Jaeger Collector.
3. Jaeger Collector
- The Jaeger Collector receives traces from multiple Jaeger Agents and is responsible for storing and processing them.
- It supports various protocols for receiving traces, including Thrift over UDP, gRPC, and HTTP/JSON.
- The Collector can perform operations such as span aggregation, sampling, and storage.
4. Storage Backend/ Collector
- Jaeger requires a backend storage system to store trace data. It supports several storage options, including Elasticsearch, Cassandra, and Kafka.
- The storage backend stores spans, traces, and associated metadata in a scalable and efficient manner. It allows for querying and retrieving trace data for visualization and analysis.
5. Query Service
- The Jaeger Query Service provides an interface for querying and retrieving trace data from the storage backend. It serves as the backend for the Jaeger UI and other visualization tools.
- The Query Service supports various query operations, such as searching for traces based on service names, operation names, tags, and timestamps.
External Integrations
Jaeger can integrate with external monitoring and observability tools, such as Prometheus, Grafana, and Zipkin. Integration with these tools allows for a comprehensive view of system performance and interoperability with existing monitoring setups.
How Jaeger Works?
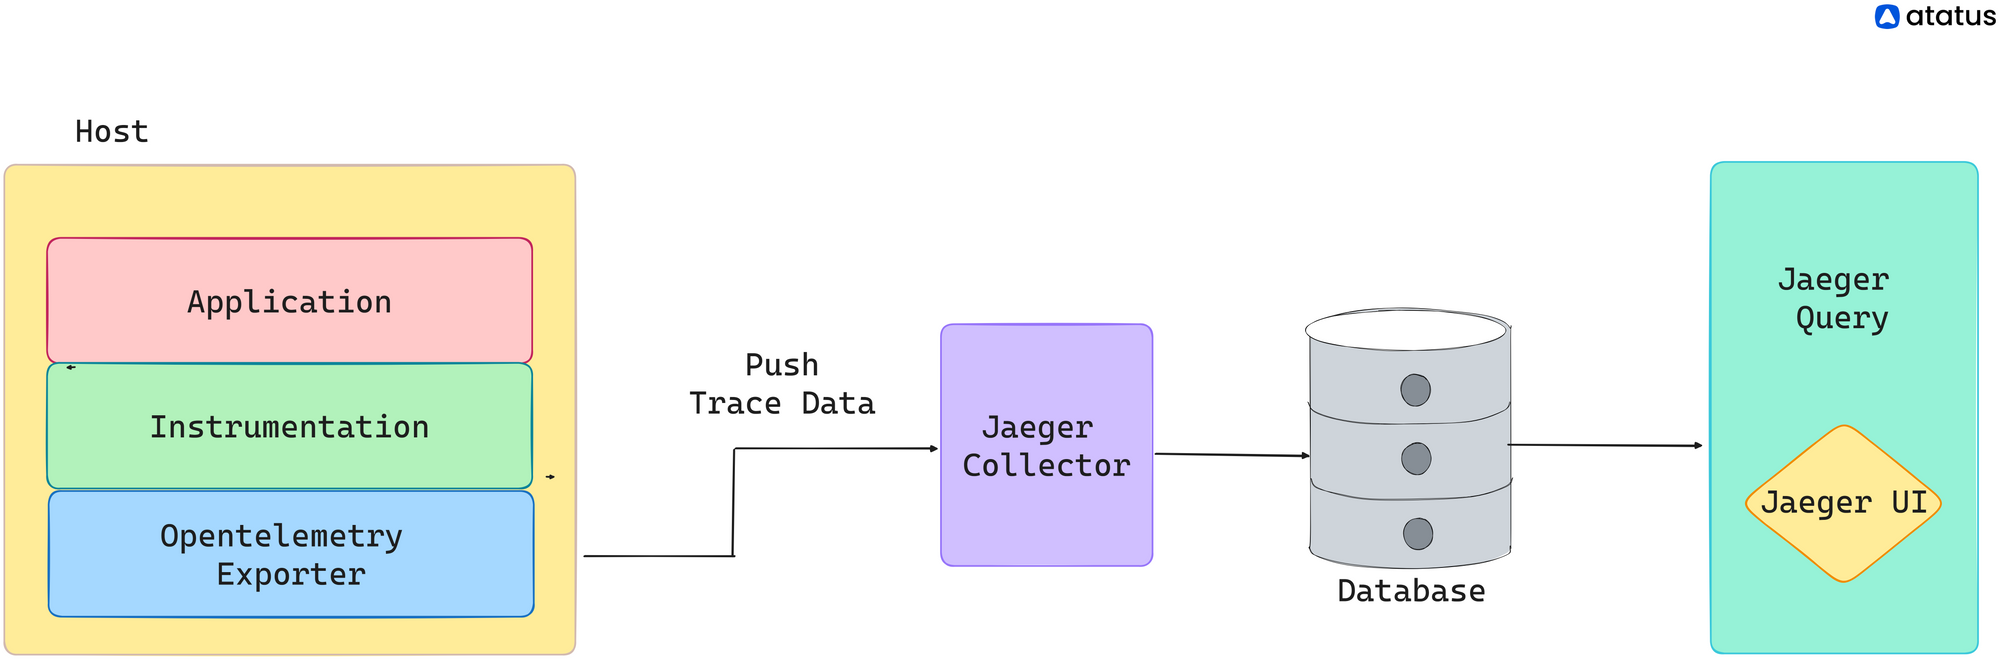
When a request enters the system, Jaeger generates a unique identifier called a Trace ID and propagates it across microservices. Spans are created to represent individual units of work within the system, and tracing context is injected into outgoing requests and extracted from incoming requests. Trace data is stored in a backend storage system, allowing for querying and visualization through the Jaeger UI.
You will find this in more detail in the next sections of this blog.
Distributed Tracing Overview
If you look at an application, it is not a single-service provider. There are various provisions within an application. It is almost like a commercial supermarket when you have products arranged on one side, a payments counter at one end, and several staff to help you with your needs.
An application also works similarly, just that you don't have physical entities dealing with you. Here, everything works virtually. So, all the facilities present in an application are made more or less interactive.
Since an application program consists of several services, there is a great deal of inter-communication to ensure the smooth flow of customer requests.
In this way, you can understand how every service, individually and collectively, contributes to the overall outcome.
Today, arguably, most of the applications are distributed in nature.
Distributed systems are deep systems in terms of their complexity. There are multiple layers, and each outsourced service might even have a dependency that you don't know about.
Identifying and singling out one request transaction that faulted from this myriad of requests would not be easy. It would be like finding a needle in the hay, more so because most of your services might have been outsourced. You don't know where it went wrong or what made it go wrong. Most of the time, even teams that made this service might themselves be inaccessible (just the worst-case scenario, though!)
This is where distributed tracing fills in these gaps. It easily comprehends your system's workings and tells exactly what went wrong.
Terms you must know:
- Span - It refers to a standard unit of work with a defined operational name, start time, and duration.
- Trace—A set of spans makes up a trace. Each component in a distributed system contributes its own span. A trace can be seen as a workflow between all these components. Also, all spans in a trace share the same TraceID.
How can Jaeger help with Distributed Tracing in Microservices?
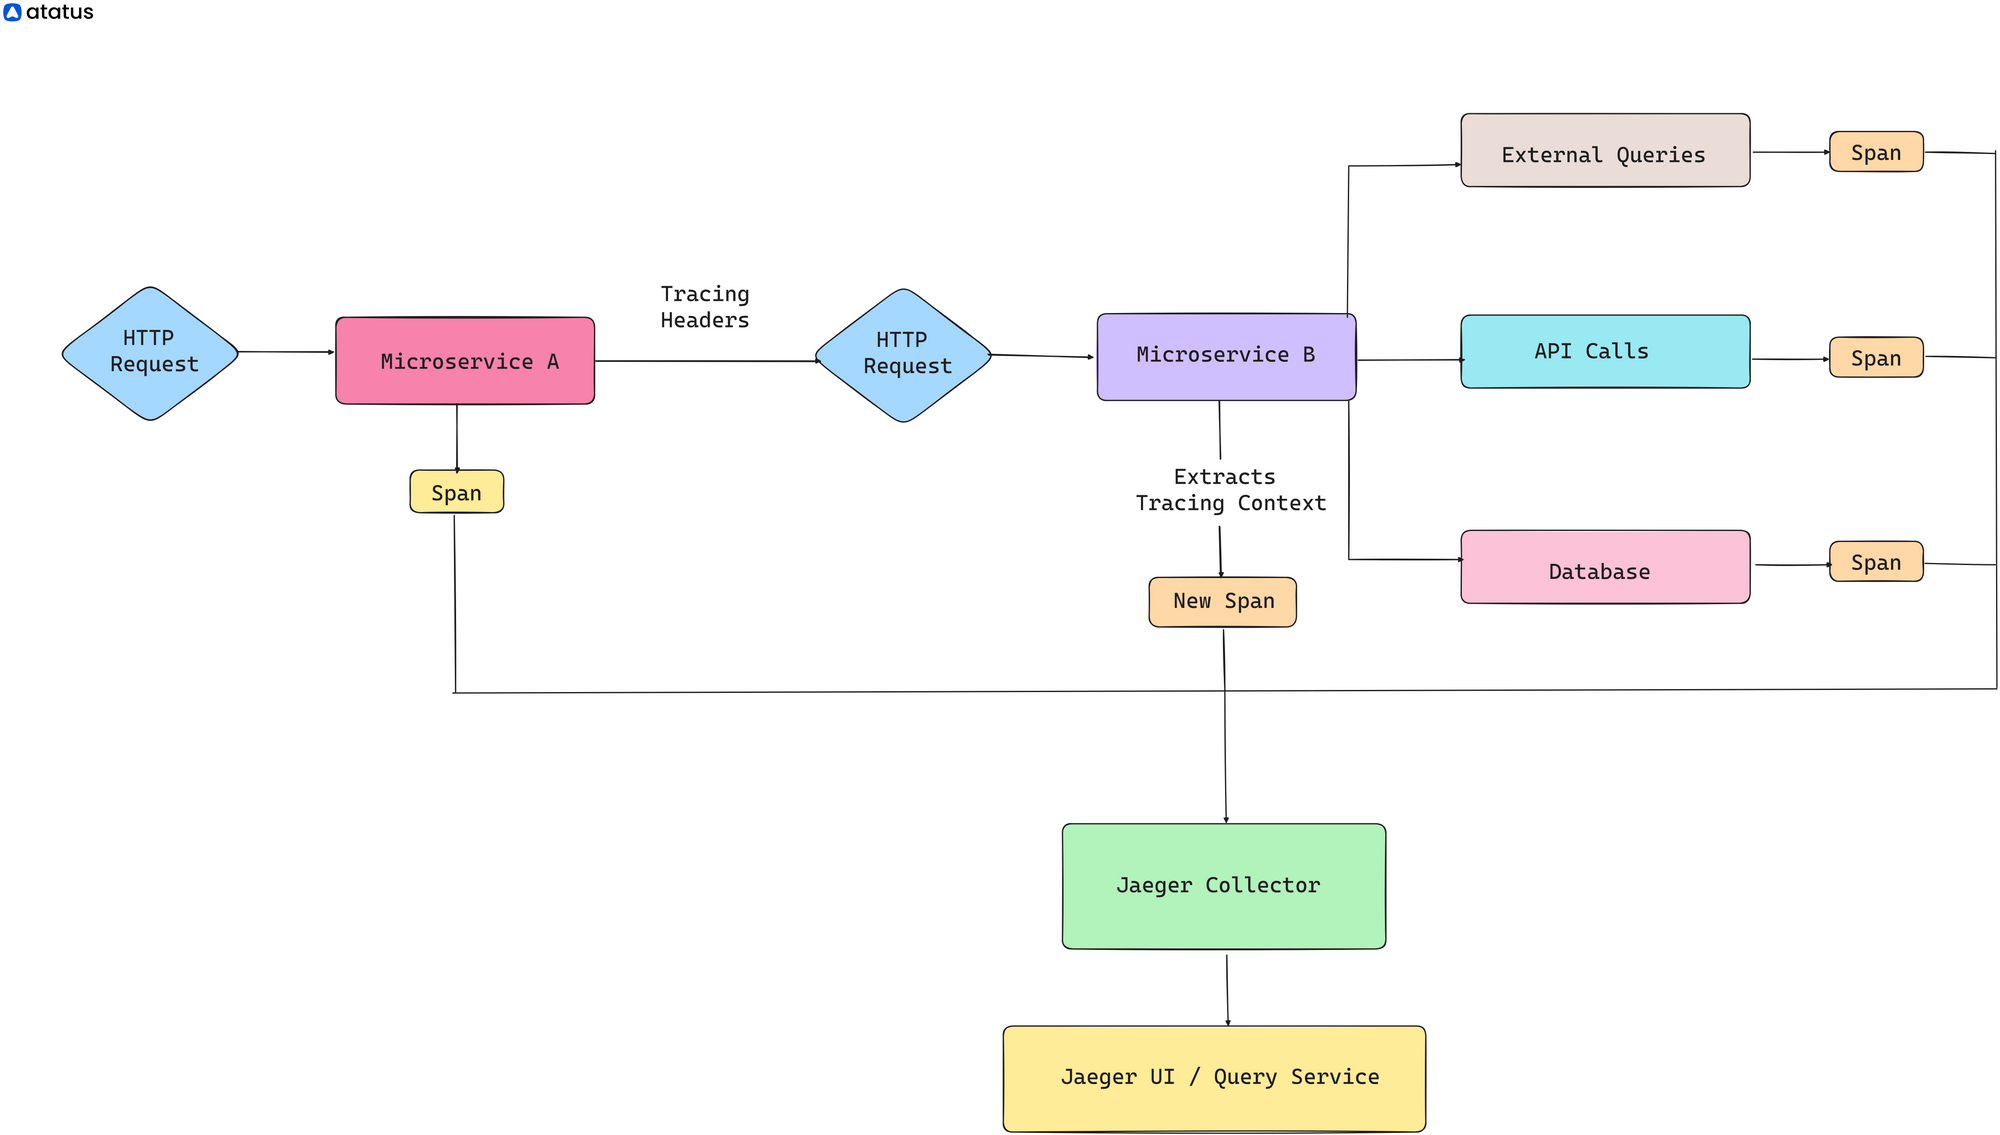
Let's walk through a simplified workflow example to see how Jaeger helps with distributed tracing in a microservices architecture:
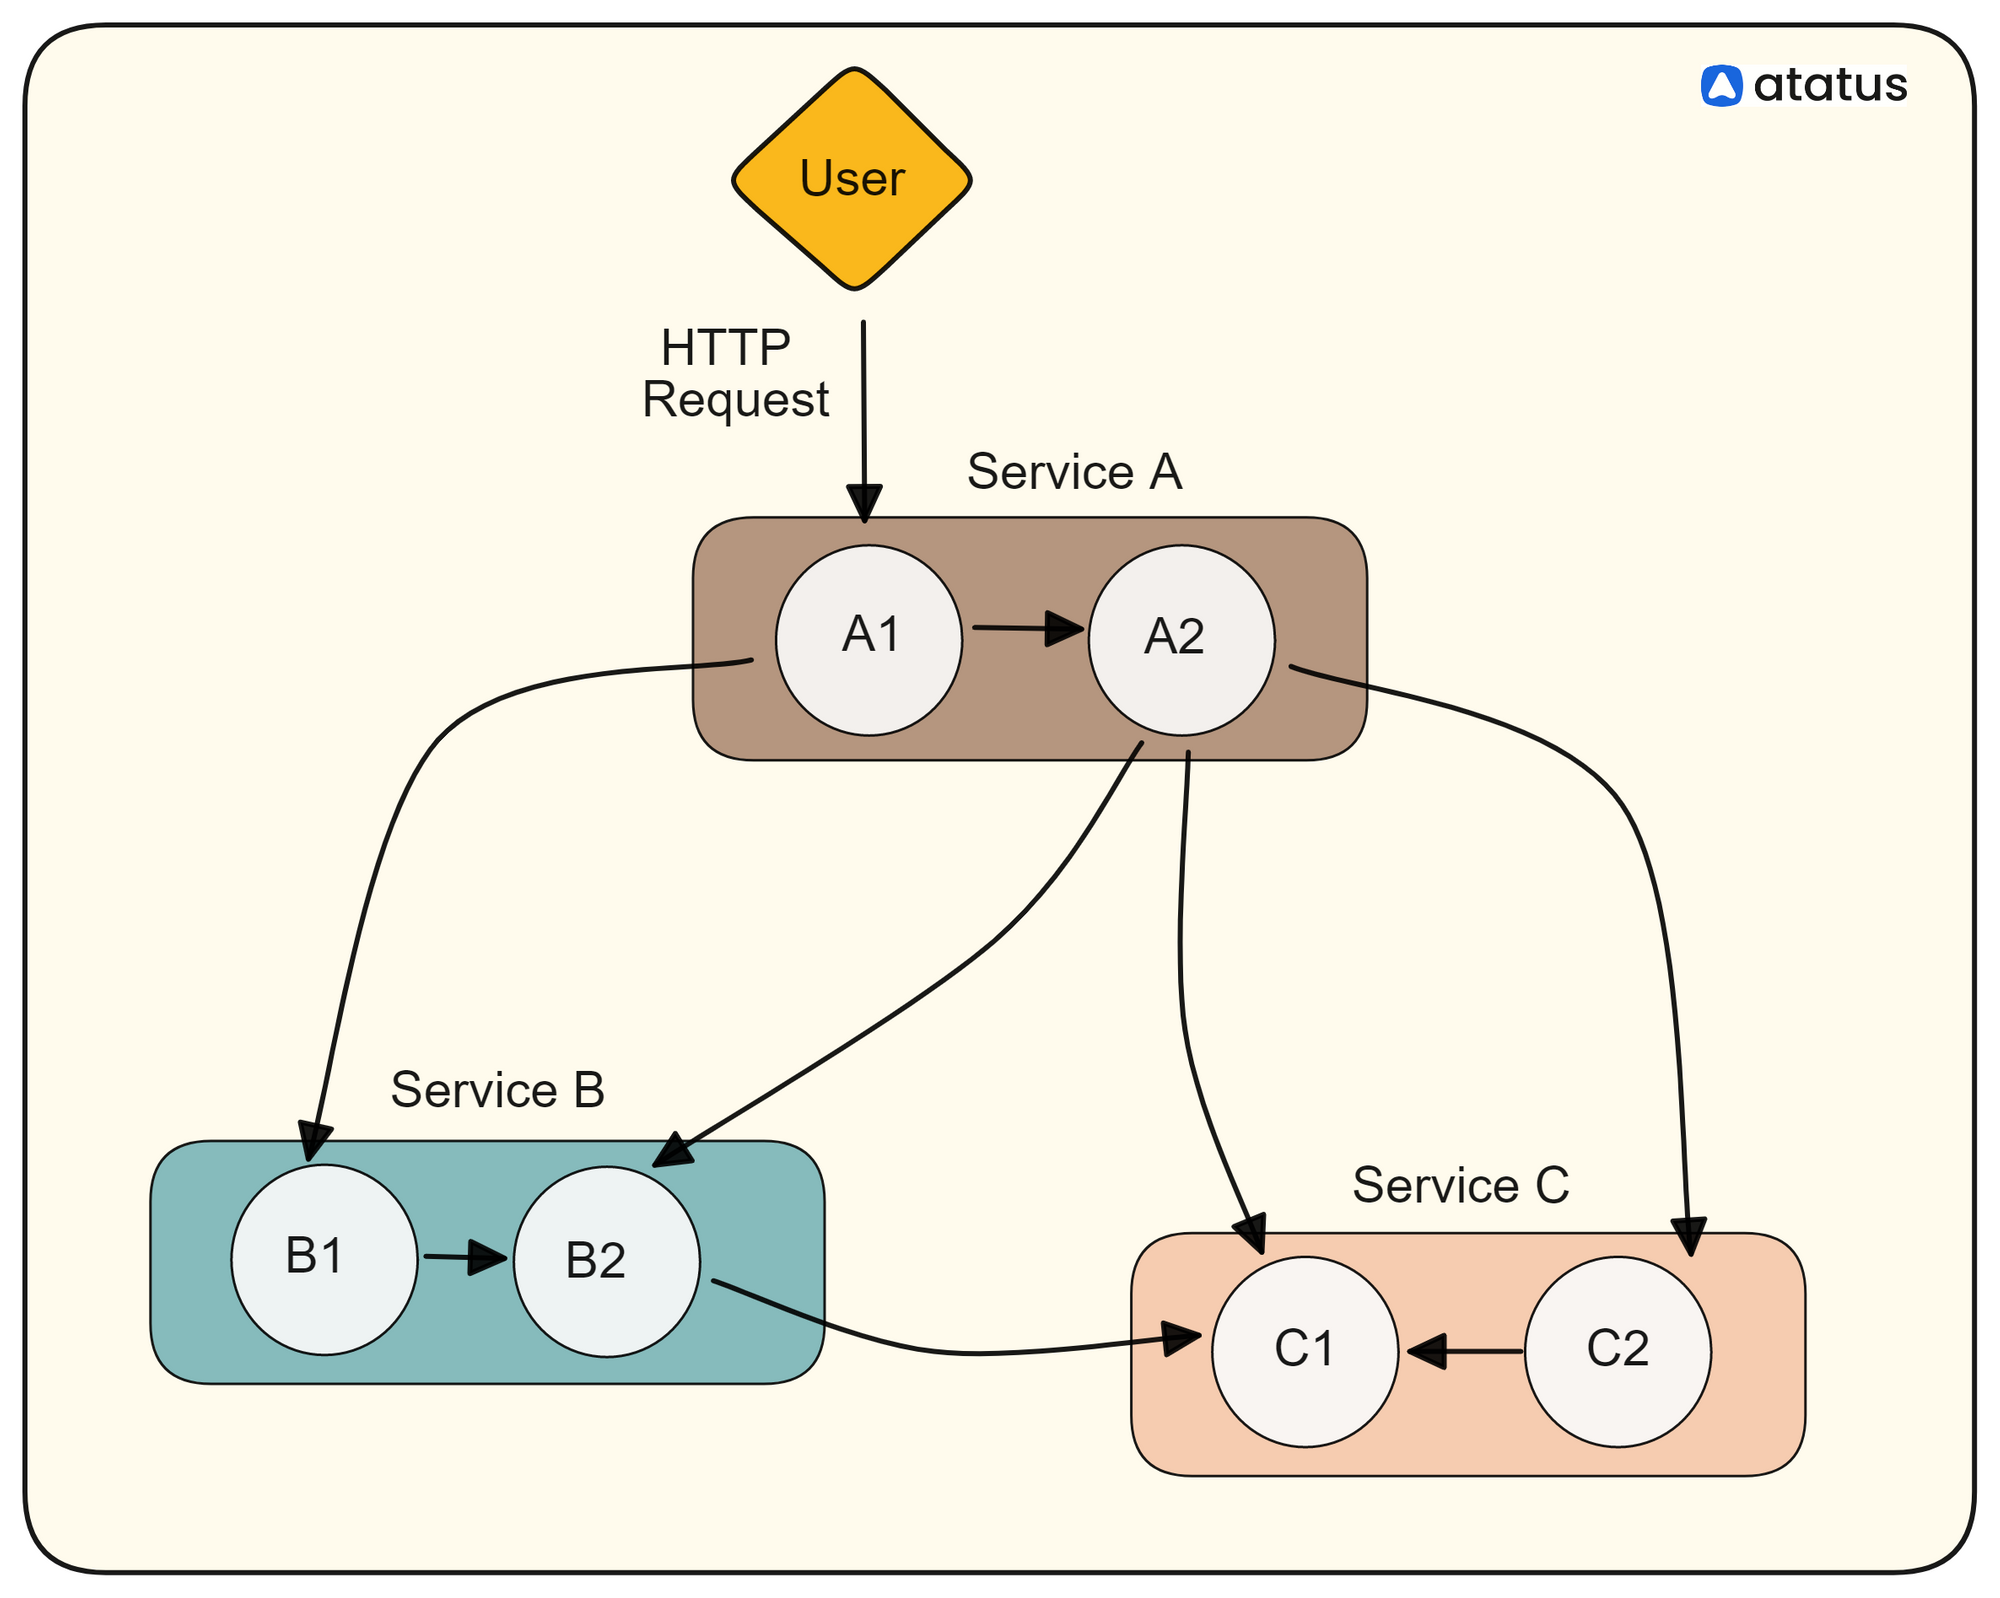
i.) A client sends an HTTP request to a microservice A, initiating a workflow that involves multiple microservices.
ii.) Microservice A receives the incoming request and begins processing it. (Before processing, Microservice A starts a new span representing the handling of this request.)
iii.) During the processing of the request, Microservice A needs to interact with Microservice B to fulfill part of the business logic.
Microservice A makes an outbound HTTP request to Microservice B. (Before sending the request, Microservice A injects tracing headers into the outgoing request to propagate the tracing context.)
iv.)Microservice B receives the incoming request from Microservice A. Microservice B extracts tracing context from the incoming request headers.
v.) Microservice B begins processing the request, starting a new span to represent its work.
Throughout the processing, Microservice B generates additional spans to represent different operations, such as database queries or external API calls.
vi.) As part of its processing, Microservice B may need to interact with an external service, such as a database or third-party API.
Microservice B makes an outbound request to the external service. Tracing context is propagated to the external service if possible.
vii.) Responses flow back in a similar manner, with each service creating spans to represent their processing of the response.
viii.) As the request completes its journey through the microservices architecture, the spans generated by each service are assembled into a trace.
(The trace represents the entire journey of the request across multiple services.)
ix.) Each span, along with its metadata, is sent to the Jaeger Collector for storage.
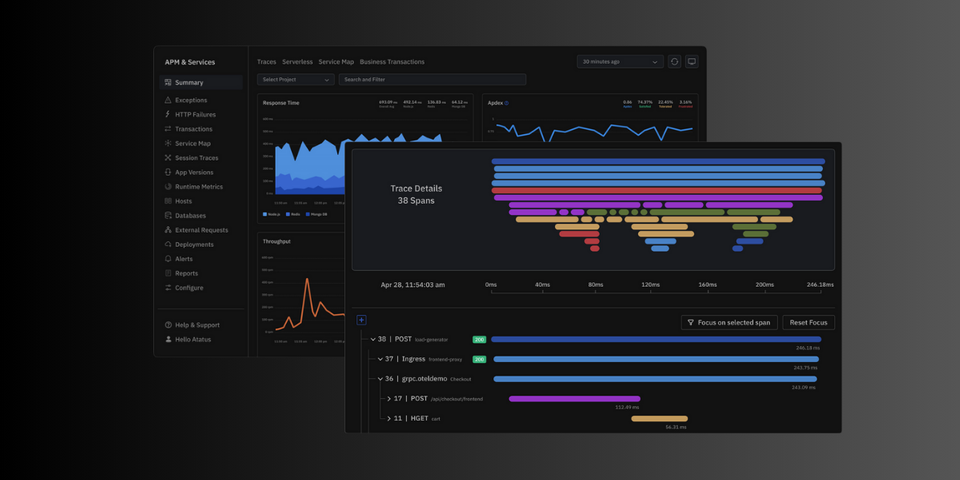
Once stored, the trace data can be queried and analyzed using the Jaeger Query Service and UI. Developers and operators can visualize traces, inspect individual spans, and identify performance bottlenecks, errors, or latency issues.
How to Create Traces on Jaeger: A Sample Program
To create traces in Jaeger, you'll need to instrument your application code with the Jaeger client library. Below is an example Go program that demonstrates how to create traces using Jaeger:
Import necessary packages and libraries:
package main

import (
    "fmt"
    "log"
    "net/http"
    "time"

    "github.com/opentracing/opentracing-go"
    "github.com/opentracing/opentracing-go/ext"
    "github.com/uber/jaeger-client-go"
    "github.com/uber/jaeger-client-go/config"
)
Main Function: This is the entry point of the program where the HTTP server is initialized.
func main() {
    // Initialize configuration
    cfg := config.Configuration{
        ServiceName: "jaeger-example",
        Sampler: &config.SamplerConfig{
            Type:  "const",
            Param: 1,
        },
        Reporter: &config.ReporterConfig{
            LogSpans: true,
        },
    }

    // Initialize tracer
    tracer, closer, err := cfg.NewTracer(config.Logger(jaeger.StdLogger))
    if err != nil {
        log.Fatalf("Could not initialize Jaeger tracer: %s", err.Error())
    }
    defer closer.Close()

    // Set the global tracer
    opentracing.SetGlobalTracer(tracer)

    // Define HTTP server configurations and handlers
    startHTTPServer(tracer)
}
HTTP Server Initialization: This function sets up HTTP servers with request handlers.
func startHTTPServer(tracer opentracing.Tracer) {
    // Define a handler function for the "/hello" endpoint
    http.HandleFunc("/hello", func(w http.ResponseWriter, r *http.Request) {
        handleRequest(w, r, tracer)
    })

    // Start the HTTP server
    port := ":8080"
    log.Printf("Starting server on port %s...", port)
    log.Fatal(http.ListenAndServe(port, nil))
}
Request Handling - to handle the incoming HTTP requests
func handleRequest(w http.ResponseWriter, r *http.Request, tracer opentracing.Tracer) {
// Extract tracing context from incoming HTTP request headers
spanCtx, _ := tracer.Extract(opentracing.HTTPHeaders, opentracing.HTTPHeadersCarrier(r.Header))
// Start a new span for this request
span := tracer.StartSpan("say-hello", ext.RPCServerOption(spanCtx))
defer span.Finish()
// Simulate some work
time.Sleep(100 * time.Millisecond)
// Add a tag to the span
span.SetTag("http.method", r.Method)
// Send a response
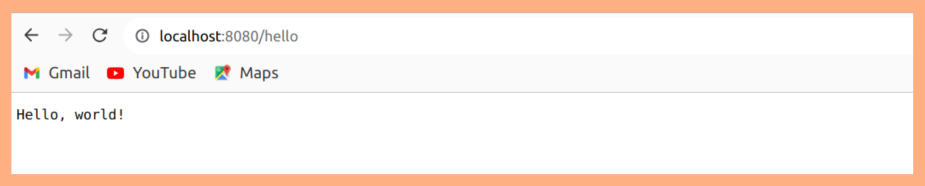
w.WriteHeader(http.StatusOK)
fmt.Fprintf(w, "Hello, world!\n")
}
In this example:
- We import necessary packages, including the Jaeger client library and the net/http package.
- We initialize the Jaeger tracer with a specific service name, sampler configuration, and reporter configuration.
- We define a handler function for the HTTP endpoint
"/hello". - Inside the handler function:
- We extract tracing context from the incoming HTTP request headers.
- We start a new span for the request.
- We simulate some work with a time.Sleep call.
- We add a tag to the span indicating the HTTP method used in the request.
- We send a response back to the client.
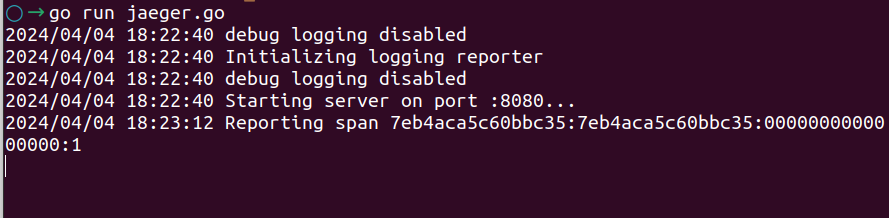
5. We start an HTTP server on port 8080, serving the "/hello" endpoint.
With this program, when you make HTTP requests to the "/hello" endpoint, Jaeger will create traces containing spans representing the request processing. You can then visualize and analyze these traces using the Jaeger UI or other monitoring tools.
Conclusion
As microservices architectures continue to evolve and grow in complexity, the role of distributed tracing becomes increasingly critical.
Jaeger's ability to provide end-to-end visibility into the flow of requests and detailed insights into latency, errors, and dependencies makes it invaluable for monitoring and troubleshooting complex systems.
With Jaeger at the helm, organizations can more effectively navigate the intricacies of distributed systems, ultimately delivering better user experiences and driving business success in today's dynamic digital landscape.
Atatus API Monitoring and Observability
Atatus provides Powerful API Observability to help you debug and prevent API issues. It monitors the consumer experience and is notified when abnormalities or issues arise. You can deeply understand who is using your APIs, how they are used, and the payloads they are sending.
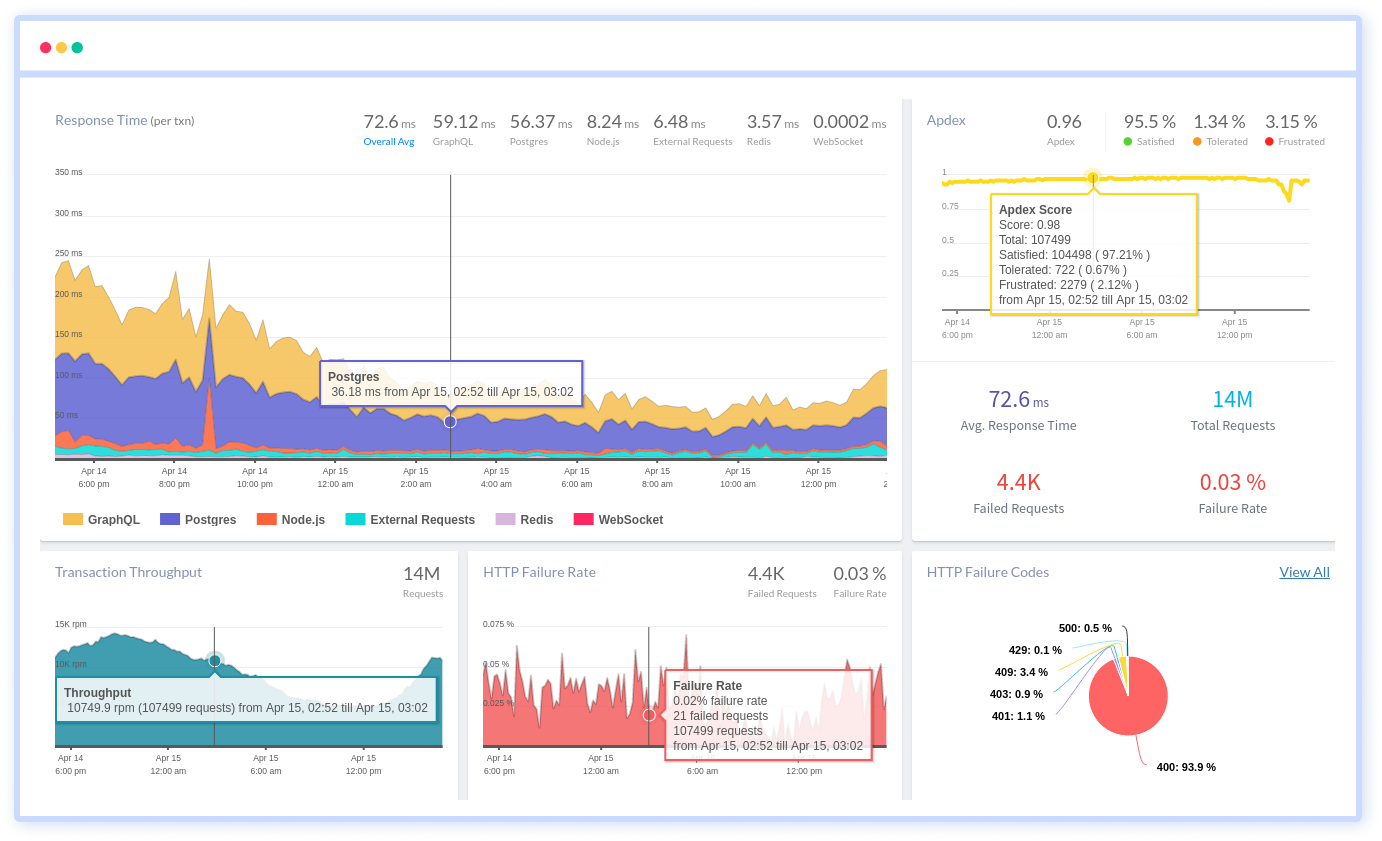
Atatus's user-centric API observability tracks how your actual customers experience your APIs and applications. Customers may easily get metrics on their quota usage, SLAs, and more.
It monitors the functionality, availability, and performance data of your internal, external, and third-party APIs to see how your actual users interact with the API in your application. It also validates rest APIs and keeps track of metrics like latency, response time, and other performance indicators to ensure your application runs smoothly.
#1 Solution for Logs, Traces & Metrics
![]() APM
APM
![]() Kubernetes
Kubernetes
![]() Logs
Logs
![]() Synthetics
Synthetics
![]() RUM
RUM
![]() Serverless
Serverless
![]() Security
Security
![]() More
More