Distributed Tracing: A Complete Guide
Any application you build has three distinct layers - a server-side interface, a client-side interface and the central codebase. In a monolith application, all these programs are written in a single language, and placed in the same web stack as well.
Earlier web applications were written this way. The problem with a monolithic application is that whenever you had to make changes in a particular component within this program or while tweaking the capacity for storing data, you had to practically untwirl the entire application stack and make the necessary changes. This not only results in increasing the workload of the developers but also gives chances for new mistakes to happen.
A Software is composed of several independent services that communicate over well-defined APIs. These services owned by small, self-contained teams are called microservices.
With microservices architectures, applications can be scaled and developed more quickly, enabling innovation and accelerating time-to-market.
Although microservices have been such a blessing, they have certainly complicated the monitoring process. It is difficult to ascertain what component faulted, at what time, and where.
But fret not! For here we are with all the details about Distributed Tracing - the method of tracking application requests through the entire distributed systems framework.
Table Of Contents
- What is Distributed Tracing?
- How Distributed Tracing Works?
- Difference between Open Tracing and Distributed Tracing
- How Distributed Tracing helps?
- Distributed Tracing Tools
What is Distributed Tracing?
If you look at an application, it is not a single-service provider. There are various provisions within an application. It is almost like a commercial supermarket when you have products arranged on one side, payments counter at one end, and several staff to help you with your needs.
An application also works in a similar manner, just that you don't have physical entities dealing with you. Here, everything works virtually. So all the facilities present in an application are made more or less interactive.
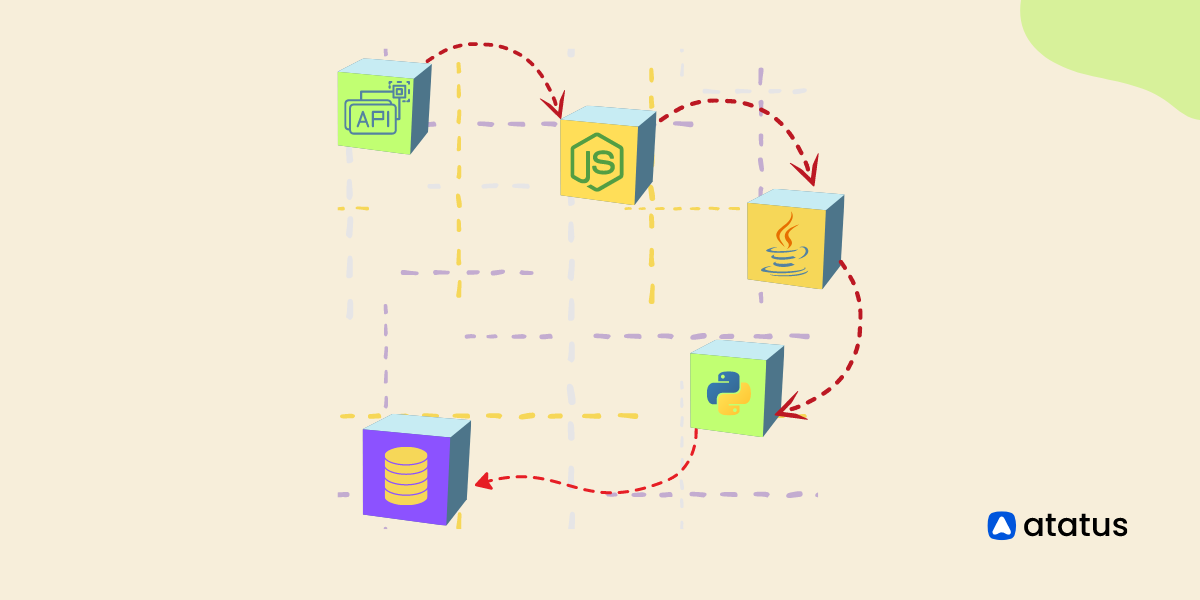
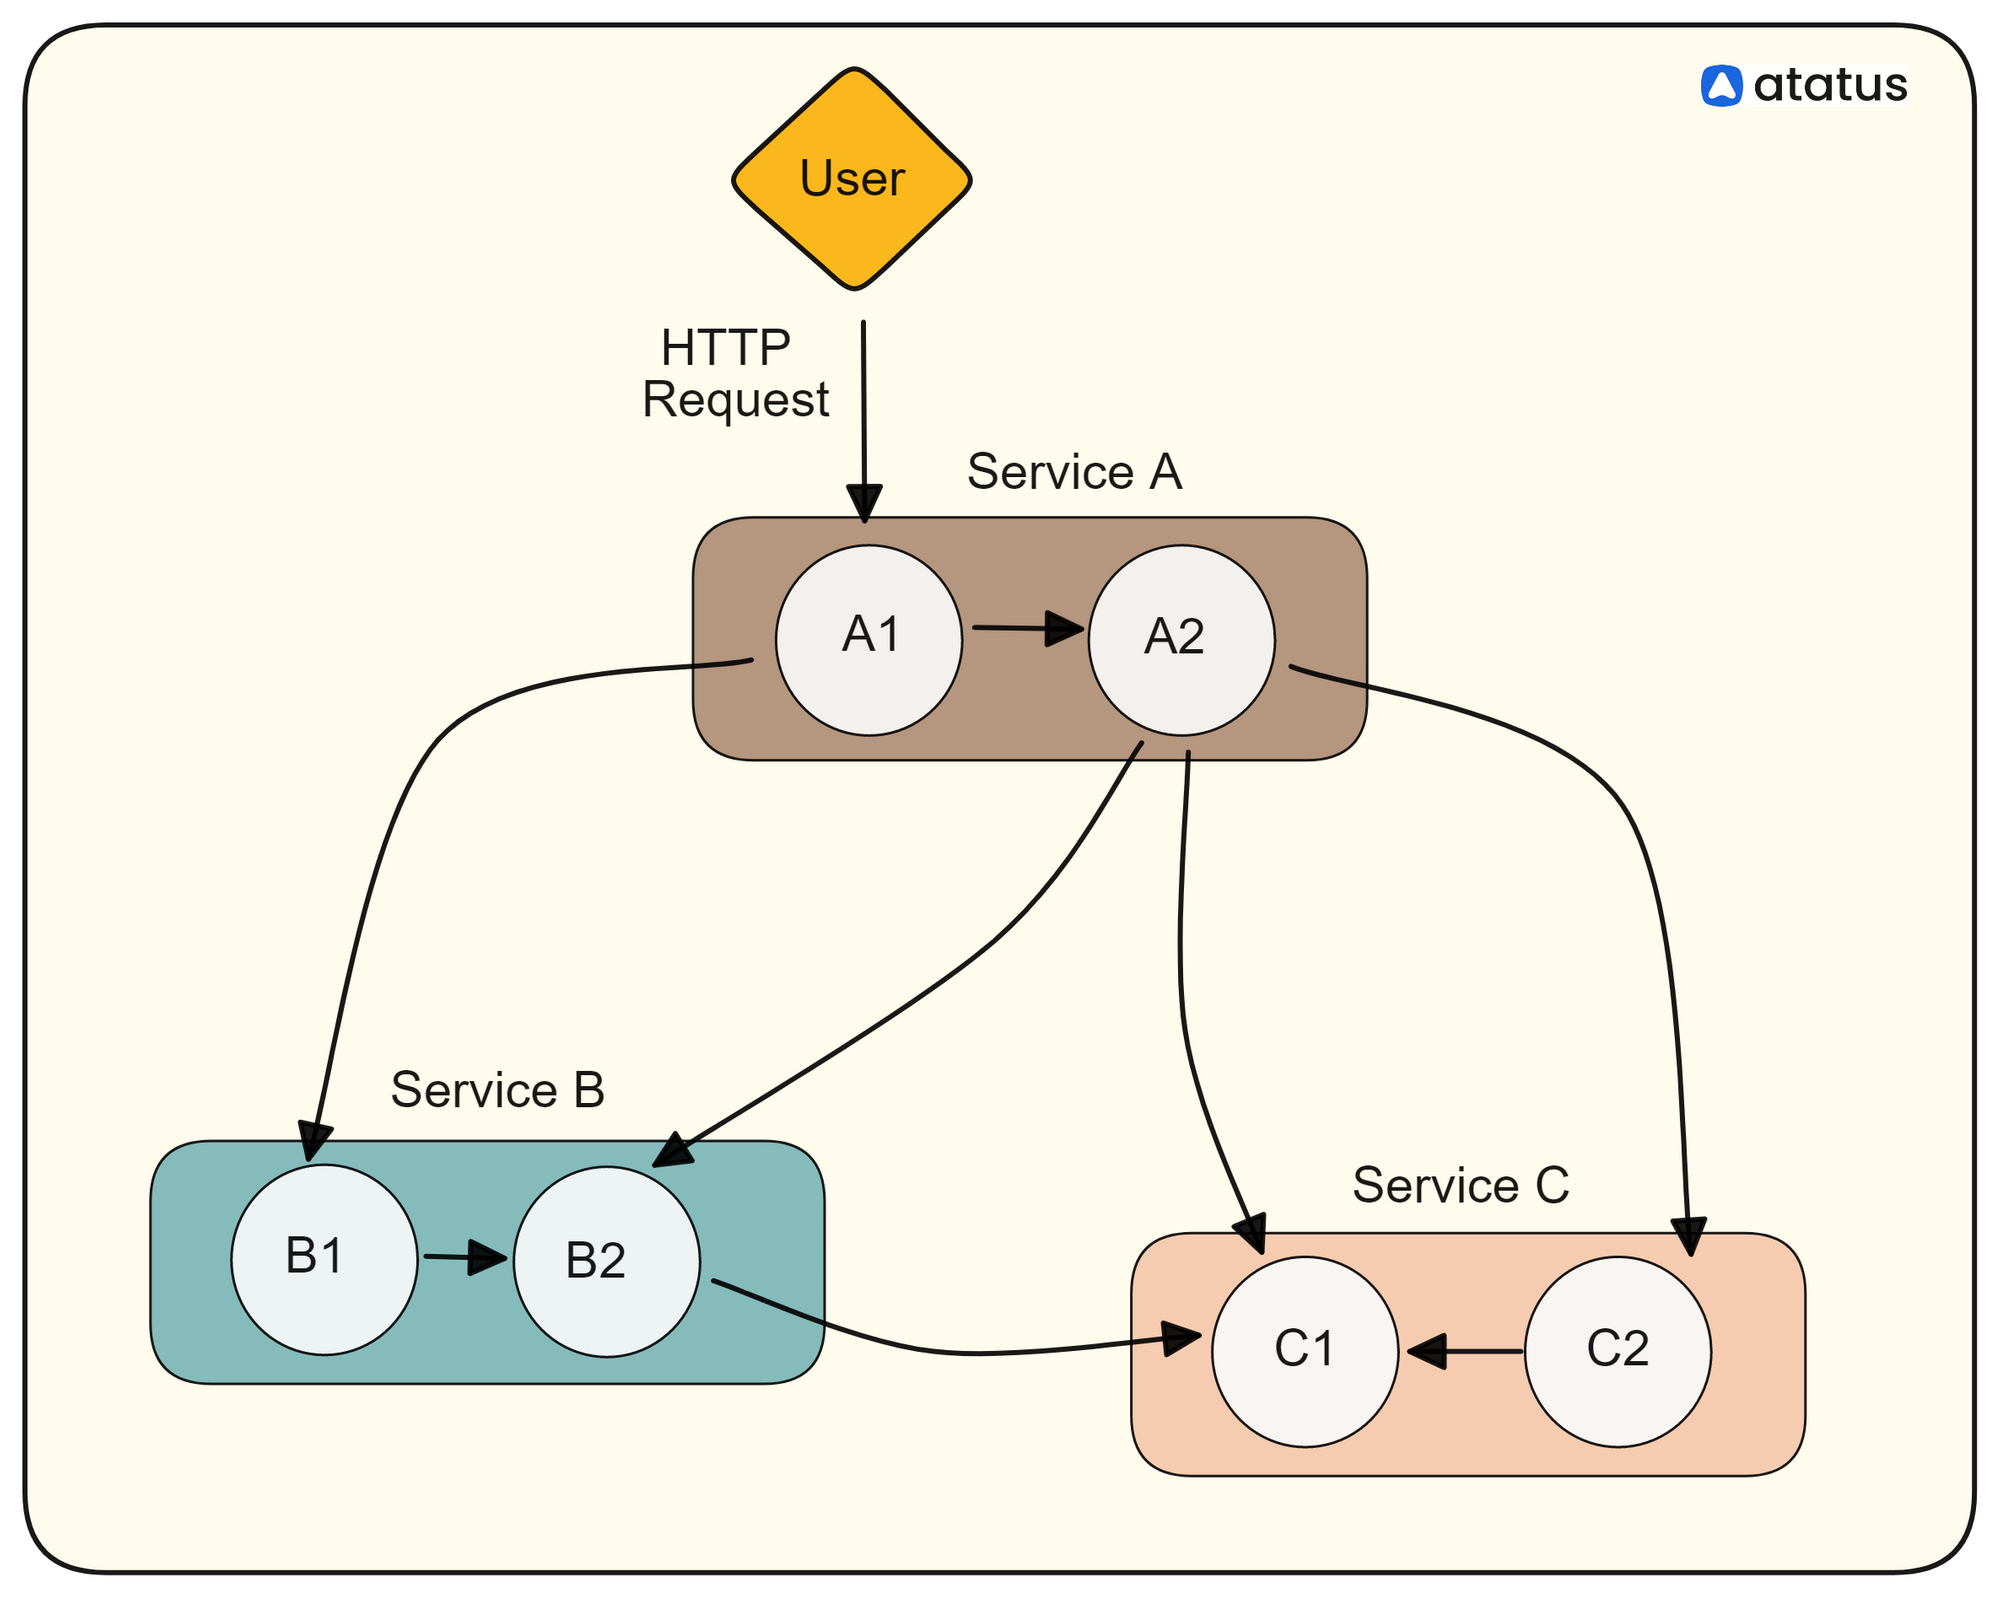
Since an application program is made of several services, there is a great deal of inter-communication that has to happen to ensure smooth flow of customer requests.
A trace examines the service transactions provided in response to an individual request.
In this way, you can understand how every service, individually and collectively, contributes to the overall outcome. It is mostly used in profiling application performance, debugging, and for root cause analysis.
Earlier, people deployed horizontal scaling of monolithic applications, but this turned out to be a complete failure. It resulted in performance trade-offs, duplicating server functions, etc. But with the passage of time, engineers built containerization platforms like docker and Kubernetes which revolutionized the way scaling was seen.
Today, arguably, most of the applications are distributed in nature.
What makes distributed software popular?
- Scalability - demand-based scaling of individual services
- Reliability - failure in one component will not bring down the entire application
- Maintainability - dividing services helps in maintaining them more easily
How Distributed Tracing Works?
Distributed systems are deep systems, in terms of their complexity. There are multiple layers, and each outsourced service might even have a dependency that you dont know about.
This enormity creates problems that are humanly insolvable.
Identifying and singling out one request transaction that faulted from this myriad of requests would not be easy. It would be like finding a needle in the hay. More so, because most of your services might have been outsourced. You dont know where it went wrong or what made it go wrong. Most of the time, even teams that made this service might themselves be inaccessible (just the worst-case scenario, though!)
This is where distributed tracing fill in these gaps. They easily comprehend your system's working and tell exactly what went wrong.
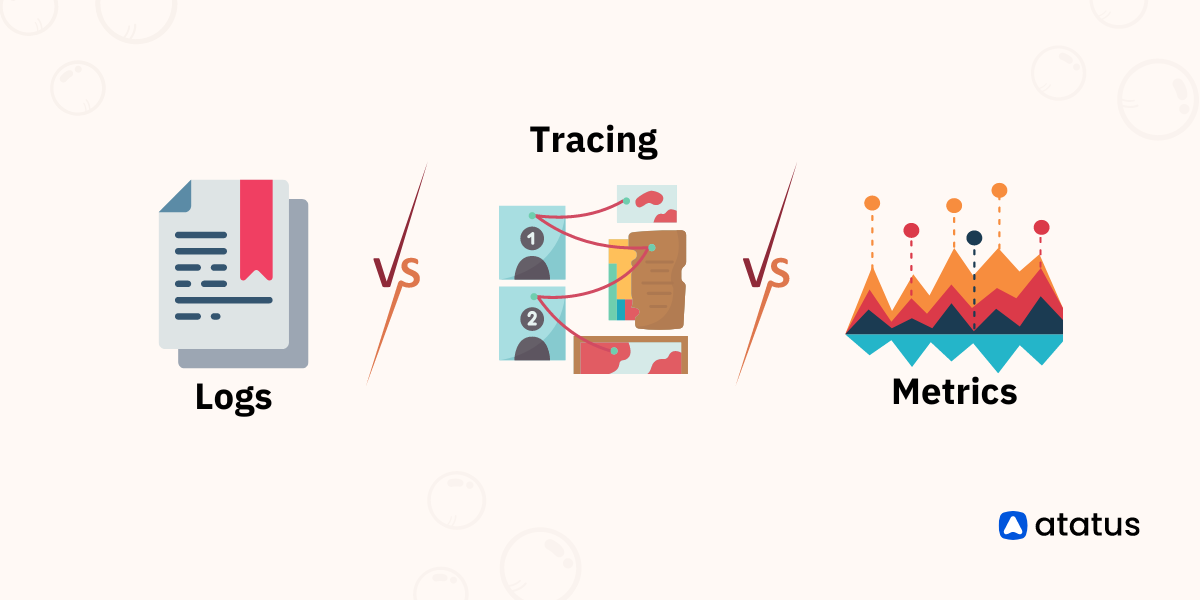
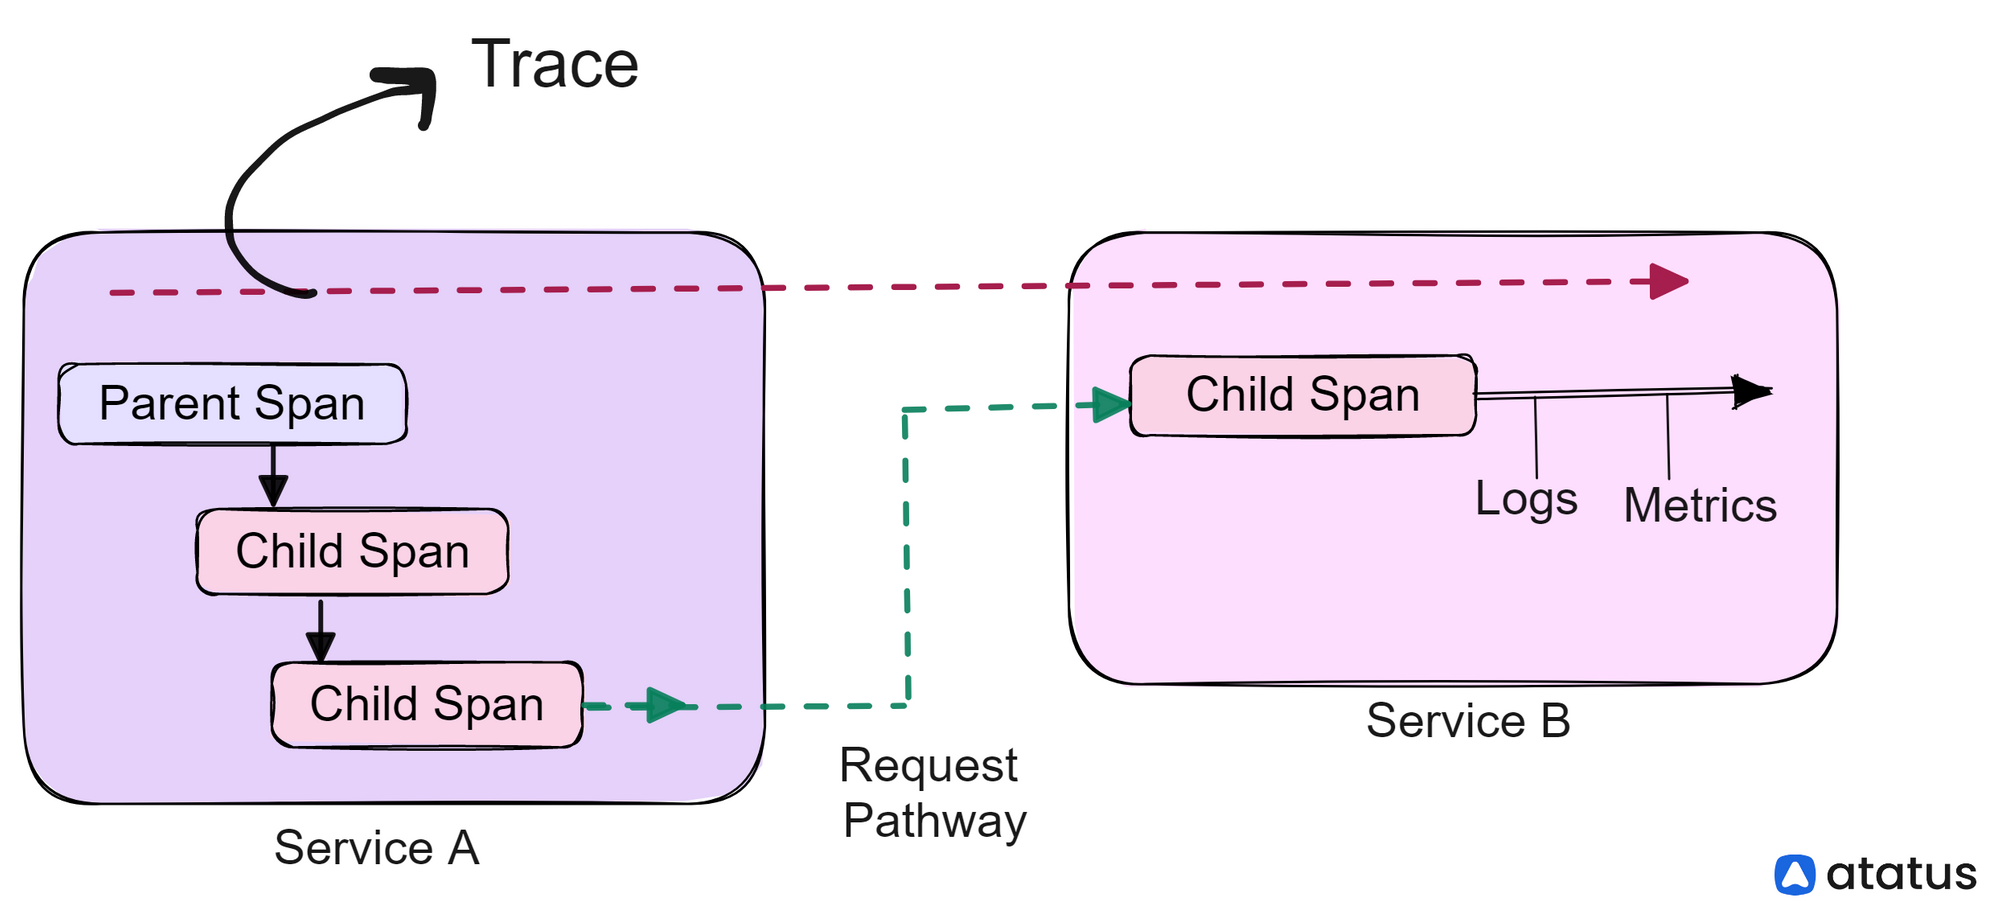
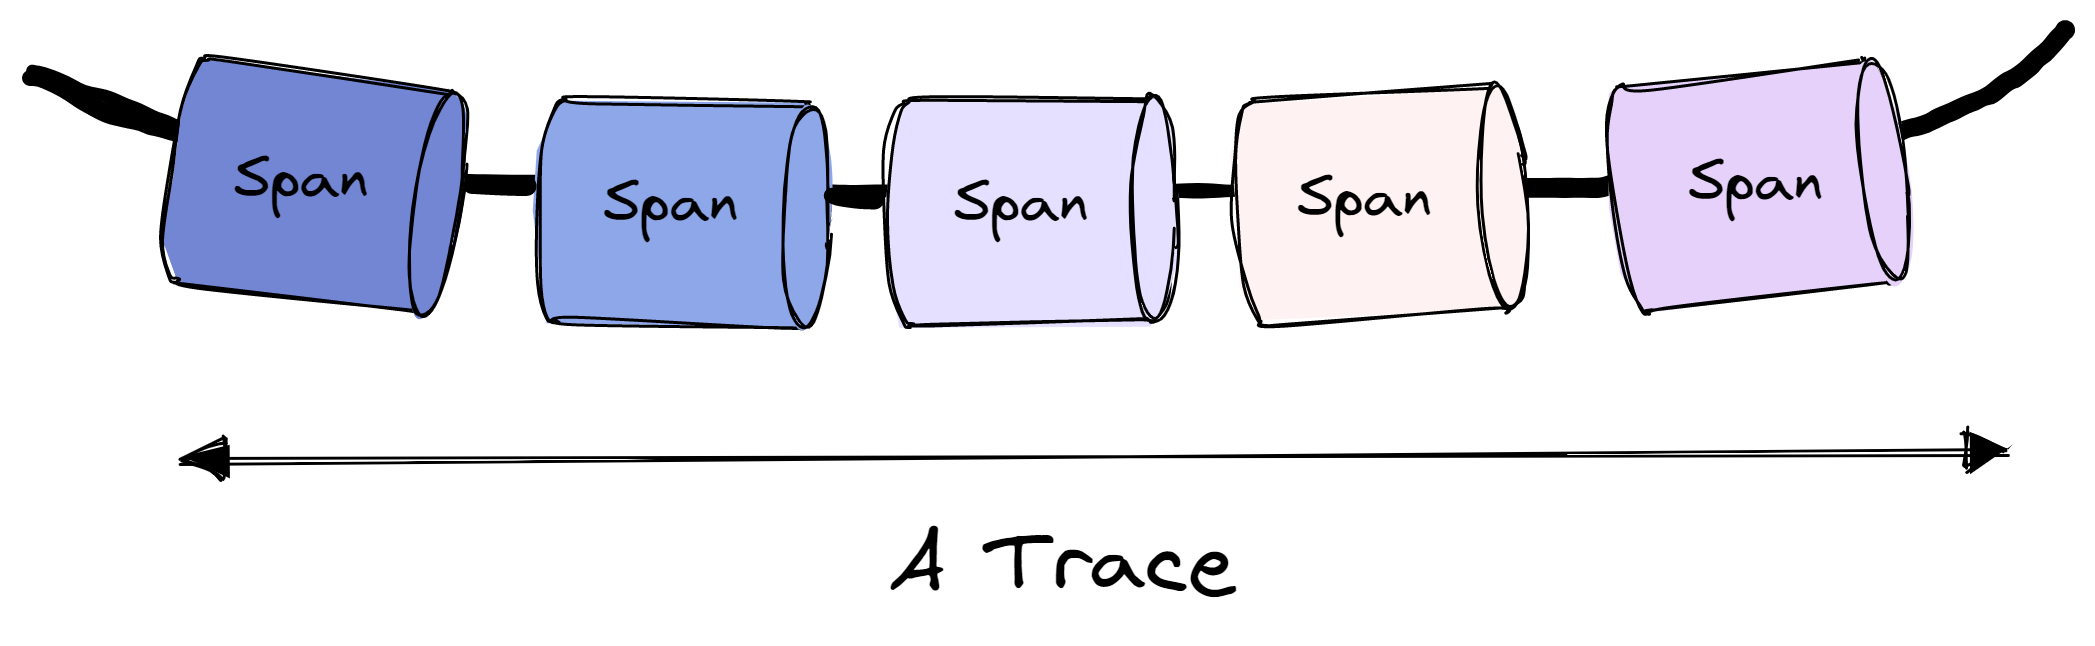
A Trace is like a thread of spans. A span can be considered a single unit of trace. It is a time-bound series telling you how a request flows through to a service. Span is also a harbinger of metadata. It is encrypted with tags and logs, and these will tell you how the fault arose in the first place.
Therefore, distributed tracing provides a central resource for all teams to understand problems from a user's perspective, while microservices enable teams to work independently.
Span work on a parent-child relationship. A child span is created when a request enters a service. Each child span is encoded with the original trace ID, a unique span ID, duration and error data, and relevant metadata, such as customer ID or location. Further, the child span acts as a parent if other child spans are nested within the starting span, usually when the request makes multiple commands within the same service.
Difference between Open Tracing and Distributed Tracing
OpenTracing and distributed tracing are two related but distinct concepts in the field of distributed systems and application performance monitoring.
| Open Tracing | Distributed Tracing |
|---|---|
| An API specification for distributed tracing | A methodology for tracing requests across multiple systems |
| OpenTracing provides a standardized API that can be implemented by various tracing tools and libraries | Distributed tracing is implemented by capturing and correlating trace data from multiple systems |
| Limited to a single application or service | Encompasses multiple services or systems |
| More flexible in terms of tracing instrumentation and tooling due to its standardized API | Less flexible in terms of tracing instrumentation and tooling due to the complexity of system interactions |
| Provides a common language and instrumentation for tracing within an application | Enables tracing of requests across a distributed system, facilitating debugging and performance optimization |
How Distributed Tracing Helps?
Many developers have touted Distributed Tracing to be extremely helpful to them. Let's see what parameters make them advantageous or disadvantageous.
Benefits
Distributed tracing provides several benefits for understanding the behavior of complex distributed systems, including:
#1 Troubleshooting:
Distributed tracing helps identify performance bottlenecks, errors, and other issues in distributed systems. By capturing detailed timing and other data about requests as they propagate through the system, distributed tracing can help pinpoint the source of issues and speed up troubleshooting.
#2 Optimization:
By providing visibility into the performance of individual components of a distributed system, distributed tracing can help identify areas for optimization and improvement. This can lead to better overall system performance and efficiency.
#3 Capacity Planning:
Distributed tracing data can also be used to plan and scale system capacity. Understanding how requests are processed and propagated through the system makes it possible to estimate the amount of resources needed to handle different levels of traffic.
#4 Architecture Design:
Distributed tracing data can help inform the design and architecture of distributed systems. By understanding how requests flow through the system, it is possible to design systems that are more resilient, fault-tolerant, and efficient.
Overall, distributed tracing provides a powerful tool for understanding the behavior of complex distributed systems and improving their performance and reliability. It can be particularly useful in microservices architectures, where multiple services and components may process requests, and traditional monitoring tools may not provide sufficient visibility into system behavior.
Limitations
While distributed tracing can provide valuable insights into the behavior of complex distributed systems, there are also some limitations to consider. Here are some of the most common limitations:
- Overhead: Distributed tracing can add overhead to a system, as it involves capturing and propagating tracing data across multiple components. This can impact system performance and increase resource usage, especially in high-throughput environments.
- Cost: Tracing systems can be expensive to deploy and maintain, especially at scale. In addition to the cost of the tracing software and hardware infrastructure, there may be additional costs associated with storing and analyzing large volumes of tracing data.
- Sampling: Because distributed tracing can generate a large amount of data, many tracing systems use sampling to reduce the volume of data that needs to be collected and analyzed. However, this can also reduce the accuracy of the tracing data and make it more difficult to identify issues and troubleshoot problems.
- Compatibility: While OpenTracing provides a standardized API for distributed tracing, not all tracing systems support it. This can limit the interoperability of different tracing systems and make it more difficult to integrate tracing data from different parts of a distributed system.
- Complexity: Distributed tracing can be complex to set up and configure, especially in large and complex systems. This can require significant expertise and resources, and may be challenging for smaller organizations or teams with limited resources.
Distributed Tracing Tools
Tracing takes up a quantum portion of all the available observability tools today. However, tracing isn't the end step; properly traced data has to be converted to readable metric graphs. This can leverage developers and administrators to understand their system’s performance better and keep them on their toes.
OpenTelemetry is the industry-standard open-source platform for instrumentation and data collection. It offers vendor-neutral auto-instrumentation libraries and APIs that allow you to trace the end-to-end pathway and duration of requests. However, OpenTelemetry does not have any built-in analysis or visualization tools.
But these are some of the enterprise tracing solutions which provide the best visualizations along with a quality tracing panacea.
Conclusion
Distributed Tracing can be particularly useful in microservices architectures, where multiple services and components may process requests, and traditional monitoring tools may not provide sufficient visibility into system behavior.
They offer an upfront (head-based) sampling method. This feature sometimes discards outlier data to make the monitoring more concise and to the point. The downside of this approach is that the data which is thrown away may be statistically important performance-impacting transactions.
This brings us to the point that while distributed tracing can be a powerful tool for understanding and troubleshooting complex systems, it is important to consider the potential limitations and tradeoffs and carefully evaluate whether it is the right tool for a particular use case.
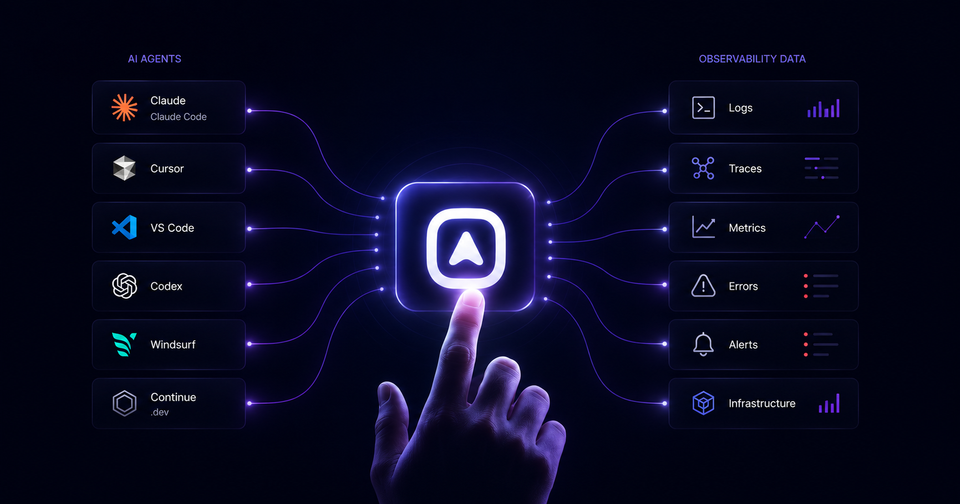
Atatus API Monitoring and Observability
Atatus provides Powerful API Observability to help you debug and prevent API issues. It monitors the consumer experience and is notified when abnormalities or issues arise. You can deeply understand who is using your APIs, how they are used, and the payloads they are sending.
Atatus's user-centric API observability tracks how your actual customers experience your APIs and applications. Customers may easily get metrics on their quota usage, SLAs, and more.
It monitors the functionality, availability, and performance data of your internal, external, and third-party APIs to see how your actual users interact with the API in your application. It also validates rest APIs and keeps track of metrics like latency, response time, and other performance indicators to ensure your application runs smoothly.
#1 Solution for Logs, Traces & Metrics
![]() APM
APM
![]() Kubernetes
Kubernetes
![]() Logs
Logs
![]() Synthetics
Synthetics
![]() RUM
RUM
![]() Serverless
Serverless
![]() Security
Security
![]() More
More