How to Find WordPress Performance Bottlenecks
Monitoring is a critical part of managing a WordPress site since you need to know what's going on with it, such as how many visitors it has, how quickly it loads, and whether it's constantly online. Data on these areas will aid you in making critical decisions, resulting in improved performance, happier visitors, and, if applicable, a higher bottom line.
Many factors can cause WordPress to slow down, but you don't need to be a techie to address them. In this article, I'll go over the most frequent bottlenecks that slow down WordPress and show you how to fix them with Atatus.
Even if your website is simply for fun or you don't have any plans to monetize it, you can follow along with this guide. Not only has it been proven that having a quick website increases revenue, but it also matters in terms of user retention and getting more people to read your content.
However, getting Atatus up and running is only the first step. If you've never used Atatus APM before (or even if you have), you might find it difficult to get the most out of it. In this guide, we'll show you how to detect and fix performance issues on your WordPress site using Atatus APM.
Let's get started!!!
Overview of Atatus APM
Atatus Application Performance Monitoring (APM) monitors the performance of your back-end applications in real-time. You can learn a great deal about how your applications work. Atatus tracks how applications interact with the website in response to requests identify database performance bottlenecks, and much more. Any unexpected behaviour or difficulties in your application will be tracked and reported to you immediately.
The performance of back-end applications is monitored via APM. The user interface of Atatus APM delivers real-time and historical statistics on transaction details, database query performance, external request services, and other useful metrics.
Features of Atatus
APM takes use of a number of features to ensure that back-end applications run smoothly.
- Transaction Monitoring
This feature will give you details on transaction outliers. You can quickly see which components of the application are causing the whole application to slow down. Each transaction is broken down into discrete pieces to make it easier to spot the ones that aren't working. - Database Monitoring
This feature will assist you in better understanding how databases work and identifying all queries that take a long time to respond to. - External Requests Monitoring
Monitor all external network calls to see which calls took the longest time to respond to, the average response time, and the number of calls per minute. - Error Tracking
This feature keeps track of errors, finds the particular line of code that's creating problems, and so on. When a mistake happens, you will be notified promptly. It also logs all exceptions and generates a thorough report with a stack trace, versions, and other information.
WordPress Hooks
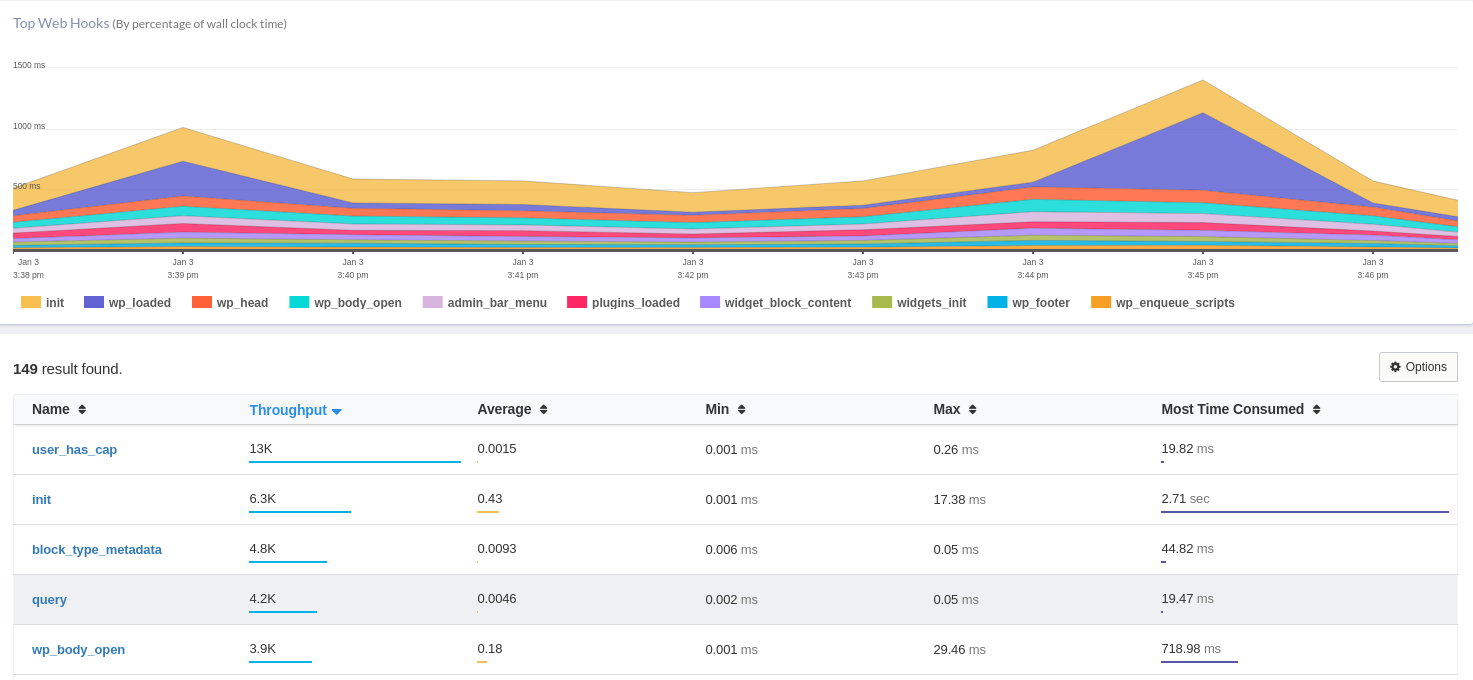
The WordPress hooks tab displays the total amount of time spent by all PHP functions triggered by WordPress action hooks. Experienced developers can utilise this information to work backwards from an overloaded hook to find the functions that are fired by it.
Note: A WordPress hook is a feature that allows you to alter a method without having to edit the core file. A hook can be used for both action (action hook) and filter (filter hook).
Hooks are mostly used to automate the execution of a function. This technique can also be used to change, expand, or limit the functionality of a theme or plugin.
Using hooks in WordPress does necessitate some HTML and PHP understanding. Creating action and filter hooks, however, may not be as tough as you think, even if you are a complete beginner.
WordPress Plugins and Themes
The plugins and themes tab in WordPress displays how much PHP processing time the active theme and plugins consume. This page can help you quickly identify the plugin or theme that is causing the issue if a single plugin or your site theme is using a disproportionately large amount of time.
When troubleshooting a website's performance, it's tempting to start with this tab and just deactivate the most time-consuming plugin. This, however, ignores the useful information available elsewhere in Atatus. It's the equivalent of addressing the symptoms rather than diving deeper and determining the root cause.
A misconfiguration issue might cause plugins to function slowly, such as a membership management plugin running slowly owing to an erroneous SMTP port number.
Learn more about SMTP Port and How to Choose the Best and Right SMTP Port.
It's also possible that a plugin wasn't properly uninstalled. This is the kind of information you'd get by digging into a slow transaction on the Transactions tab, and it's never going to be fixed by simply deleting the slowest plugin.
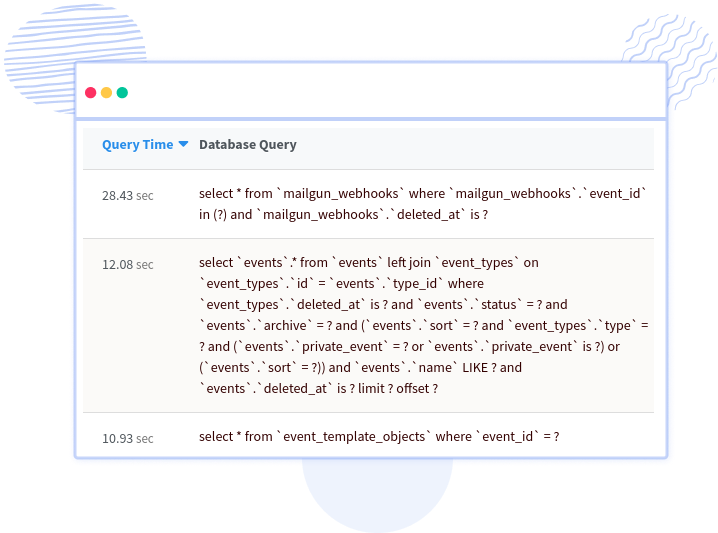
Database Tab
The databases tab allows you to see which database tables and query types are taking up the most time. Atatus connects this data to the transactions that initiated the query. This information can be used to identify database tables that need to be optimised and template files that are putting excessive stress on the database.
External Requests Tab
The majority of WordPress sites rely on a number of third-party services such as WordPress.org, as well as plugin and theme developers, which provide updates for plugins, themes, and core.
External services are typically used to power chat plugins. When content is posted on social media platforms, many sites are integrated with those platforms for the best display and performance.
When one of these external services fails to reply in a timely manner, your entire website can come to a standstill.
You can quickly discover which external services are taking up the most time by using the external request tab. You may then use that information to figure out whether the problem is one of speed (the service is slow) or quantity (too many calls to the external source) and strive to resolve it.
Exception Tab
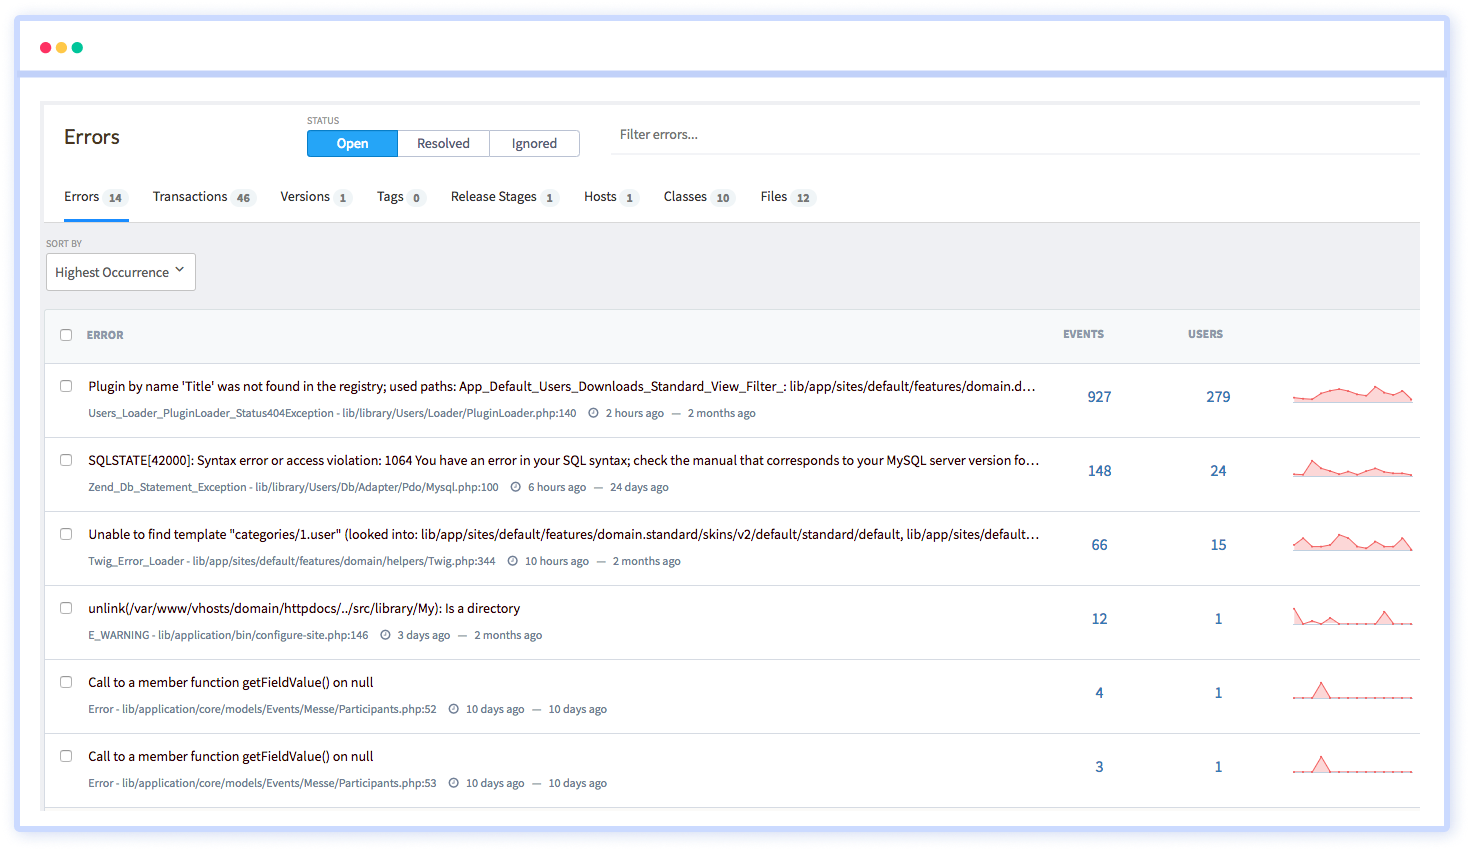
The PHP issues detected while loading your WordPress site are reported on the Exception page. The errors are organised into classes so you can view how many various kinds of errors are being generated rapidly. The errors can also be traced back to the transactions that caused them. You can also see a full stack trace for the transaction that caused the error if you choose a specific error.
How to Debug Slow-Loading Page?
The most common issue is a page or process that takes an abnormally long time to load. The Transactions tab in Atatus APM is generally often the first place to look when this happens.
The procedure for diagnosing a slow-loading page is straightforward:
- Duplicate the time-consuming transaction
- Look for the transaction in the list of slow transactions
- Examine the transaction summary and trace data to figure out what's causing the slowness
Let's take a look at an example of this and how Atatus can help diagnose the issue.
#1 Duplicate the Time-consuming Transaction
For example, when our client loads a single blog post, it takes a long time to load. The rest of the site works correctly, but individual articles take a long time to load.
As a result, the first step is to duplicate the issue. This situation, that involves returning to a single blog post several times to ensure Atatus has the required data.
Note: You'll need to clear the cache between each page load if your website uses page caching. Otherwise, rather than having WordPress construct the page, you'll wind uploading it from the cache.
Learn how to clear cache in Major Browser.
#2 Look for the Slow Transaction
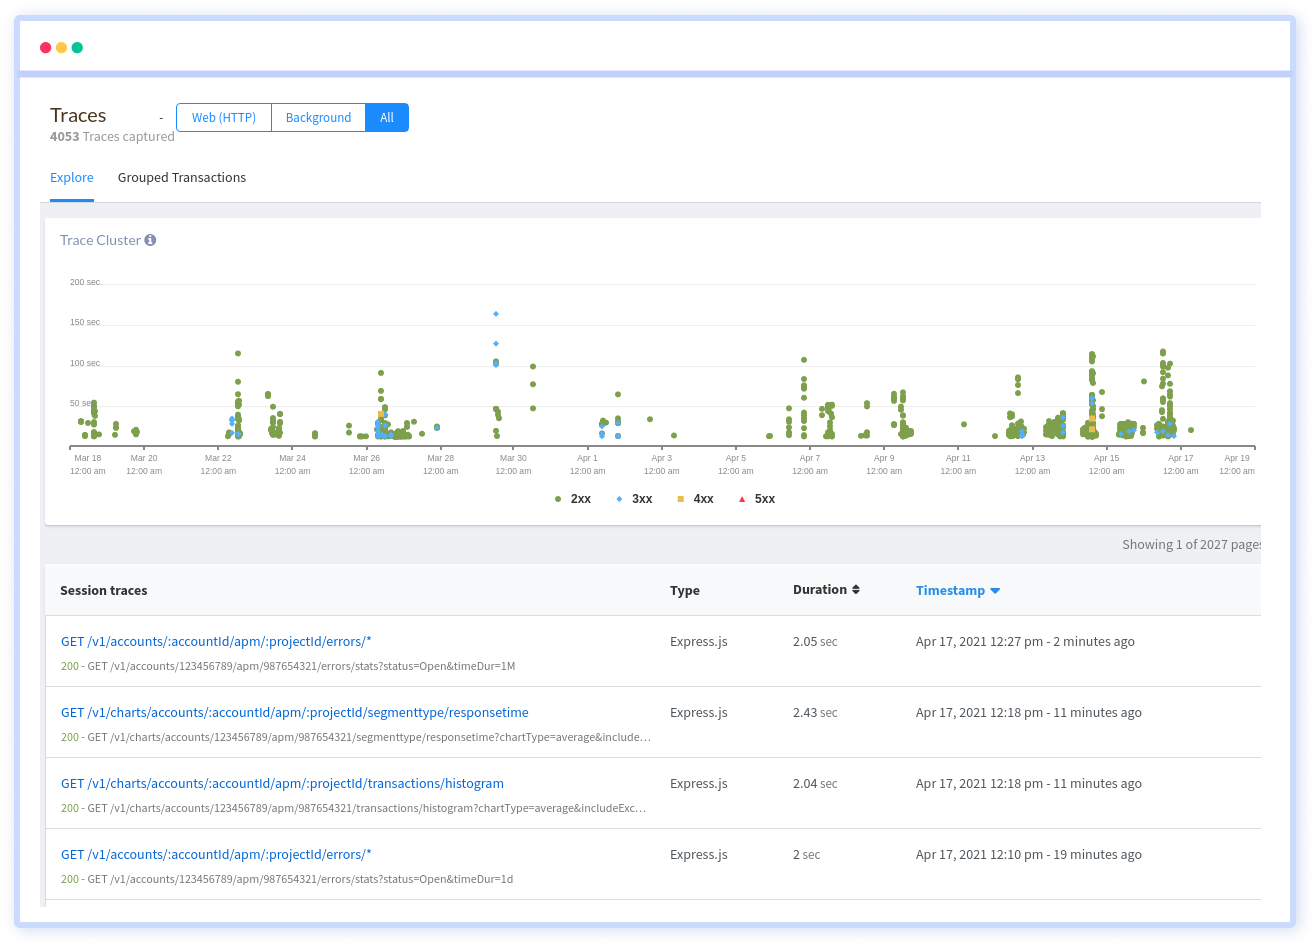
Go to Atatus and select the Transactions tab once you've reproduced the slow transaction a few times. Then, in the Atatus dashboard, scroll down until you see a list of sluggish transactions.
#3 Examine the Transaction Summary and Trace Data
After you've selected the transaction, you'll see a summary of the transaction.
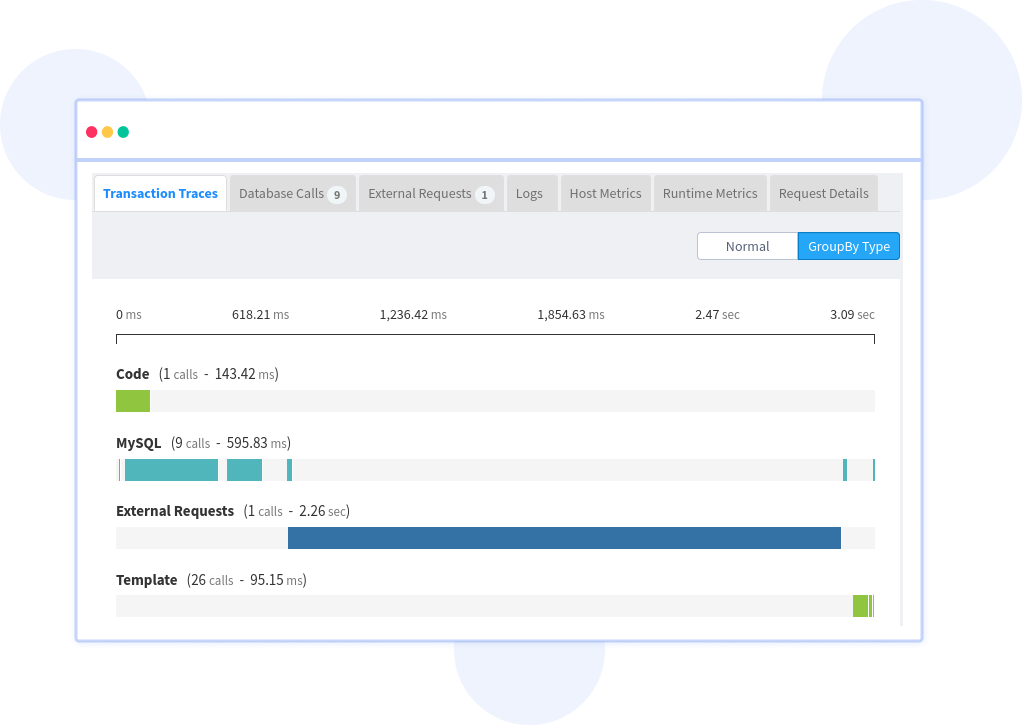
The summary provides a quick overview of the components that contributed to the transaction's processing time. While this is useful information, the trace details tab will provide us with the specifics we need to see what's going on.
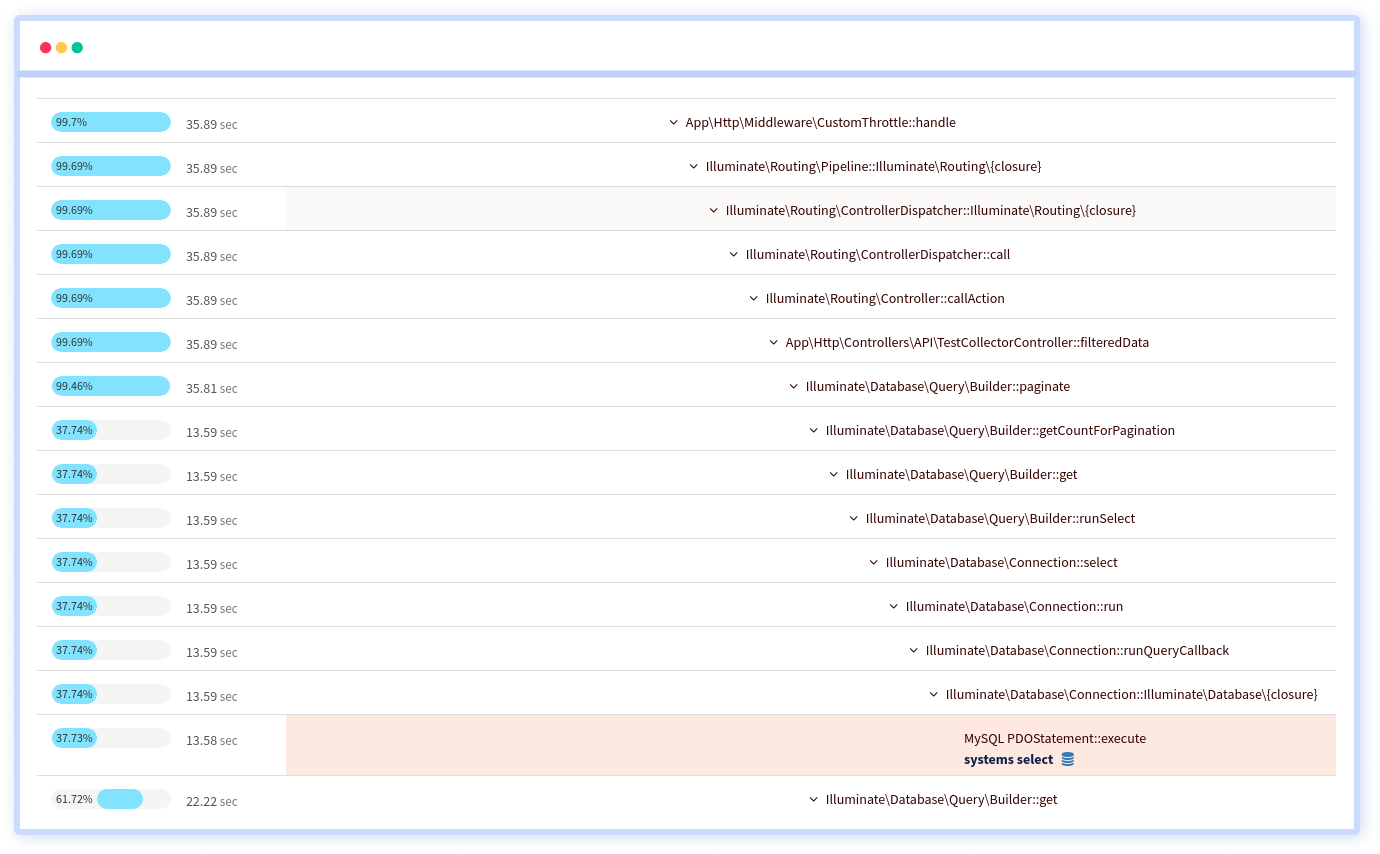
It gives a hierarchical step-by-step waterfall that illustrates PHP's function, database queries, and external calls as the page are being built.
Atatus has just allowed us to pinpoint the view counter in the sticky header bar as the primary cause of the site's delayed loading of single blog entries. Now the site's owner knows exactly which component to focus on in order to fix the delayed loading of individual blog entries.
How to Fix Common WordPress Site Slowness?
The complaint that the entire site is loading slowly is the second most prevalent sort of issue we troubleshoot for our clients. One of three things is probably going on when every transaction takes a long time to load:
- The site is suffering from a lack of server resources
- The active theme or a plugin is causing issues
- The site database is having trouble keeping up with the volume of requests
Here are some examples of overall slowness that each of these tabs can detect.
#1 Slowness Caused by a Plugin
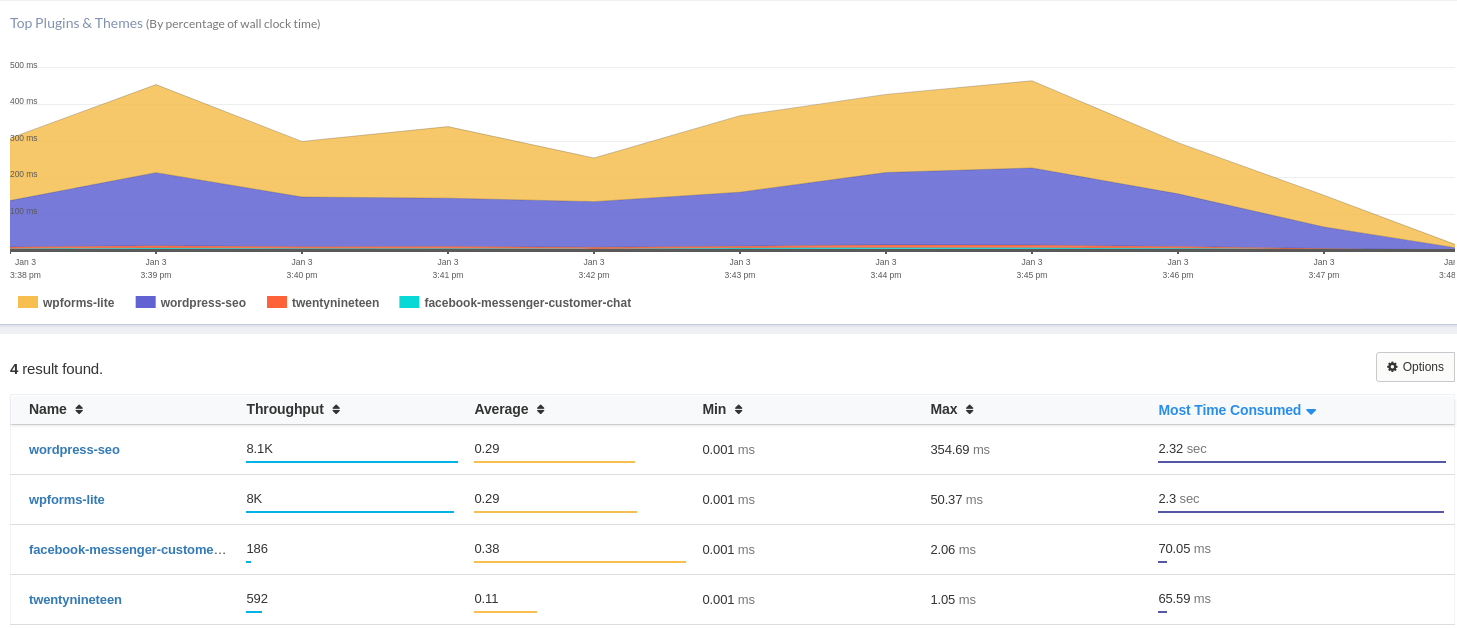
The symptoms of a plugin causing slowness differ depending on the activity the plugin is conducting. On the other side, a slow plugin will frequently affect every page of a WordPress site. Overall slowness was detected on every front-end page of the site in the case of the site whose data you can see in the figure below.
This is what Atatus had to say about the site's plugin performance.
When you look at the data, you'll notice that one plugin takes 15 times as long as the next slowest. It's easy to condemn the plugin as being badly designed or ineffective right away. This is true in some cases, but not in all. A plugin can take a long time to load due to misconfiguration, database slowness, or external resources that are slow to react.
So, if a plugin is taking a long time to reply, it's a good idea to check several other screens in Atatus for more information. Before deciding that disabling the plugin is the best or only option, examine the transactions, databases, and external resources.
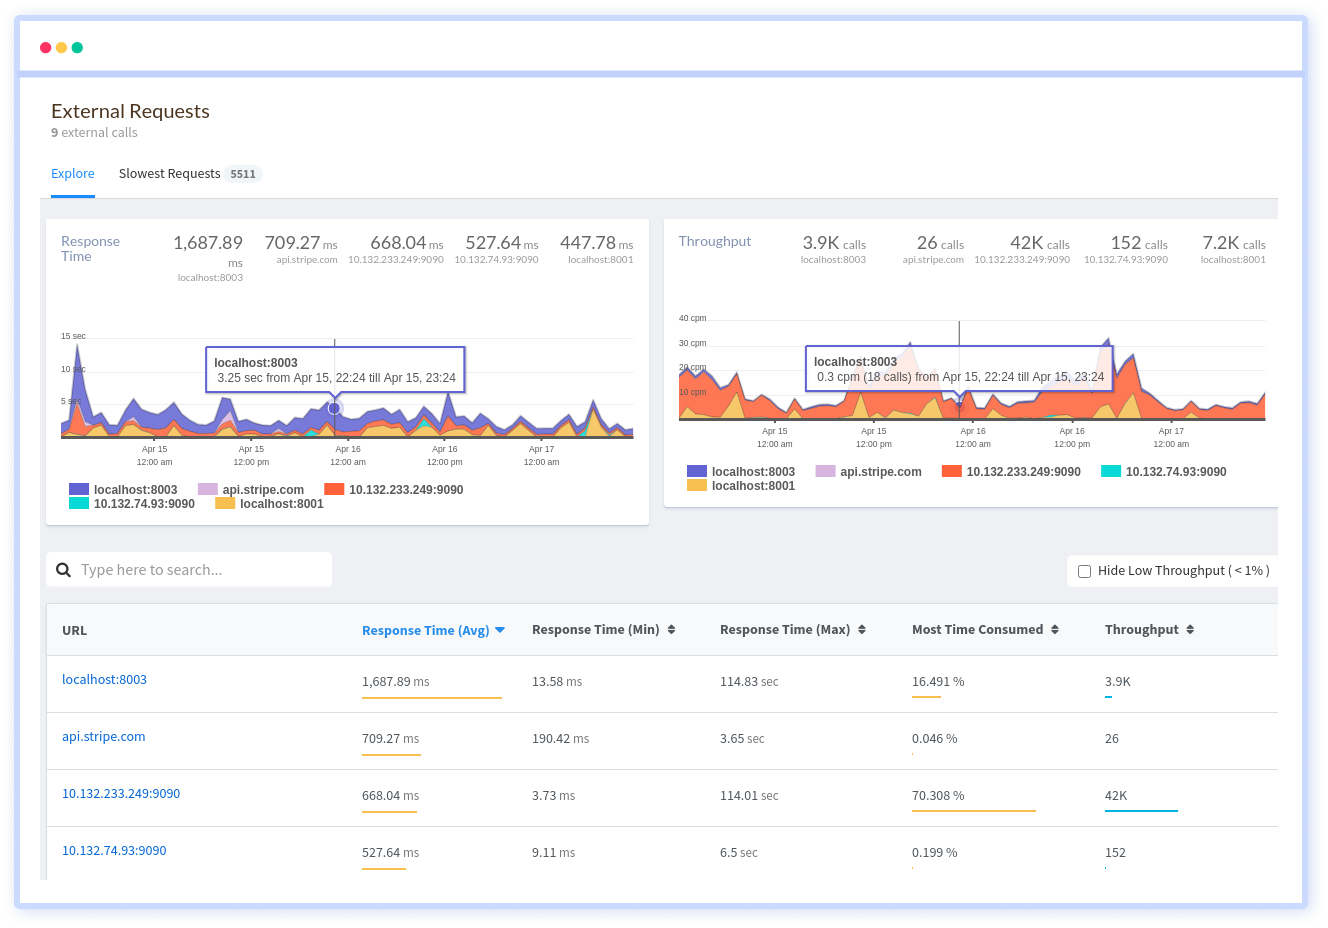
#2 Slowness Caused by External Services
If a site relies on a call to an external service to generate page views, and that service is down or takes a long time to react, the outcome can be a WordPress site that refuses to load.
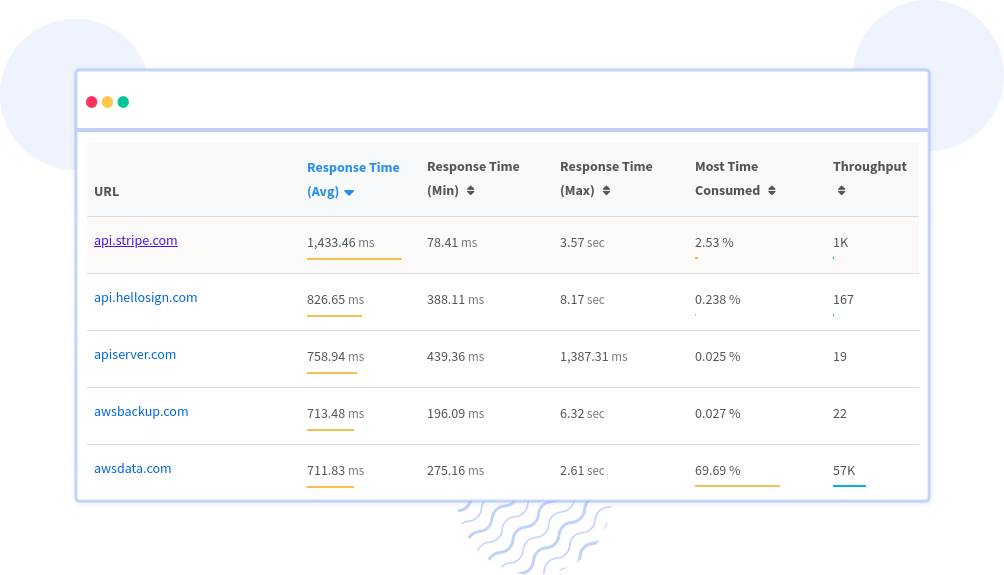
The image above comes from the same source as the snapshot of slow plugins above. As you can see, one external service accounts for a significant portion of the total time spent waiting for external services.
This example demonstrates why it's important to look at data in context before drawing conclusions. The developer of the plugin indicated in the previous step is the service being called in this scenario.
This information gives the situation more depth. It isn't the plugin's code that is the problem. Instead, it appears that the plugin makes numerous requests to the developer's website, which, when added together, consume a significant amount of processing time.
If we look at a slow transaction for this site, we can notice that this external call appears to be checking on the licence status of the plugin in issue, implying that the licence for this plugin may have expired.
In any case, we can now inform the site's owner that the plugin is causing the slowness and that the slowness is due to repeated visits to the developer's website to check on the plugin's licensing validity.
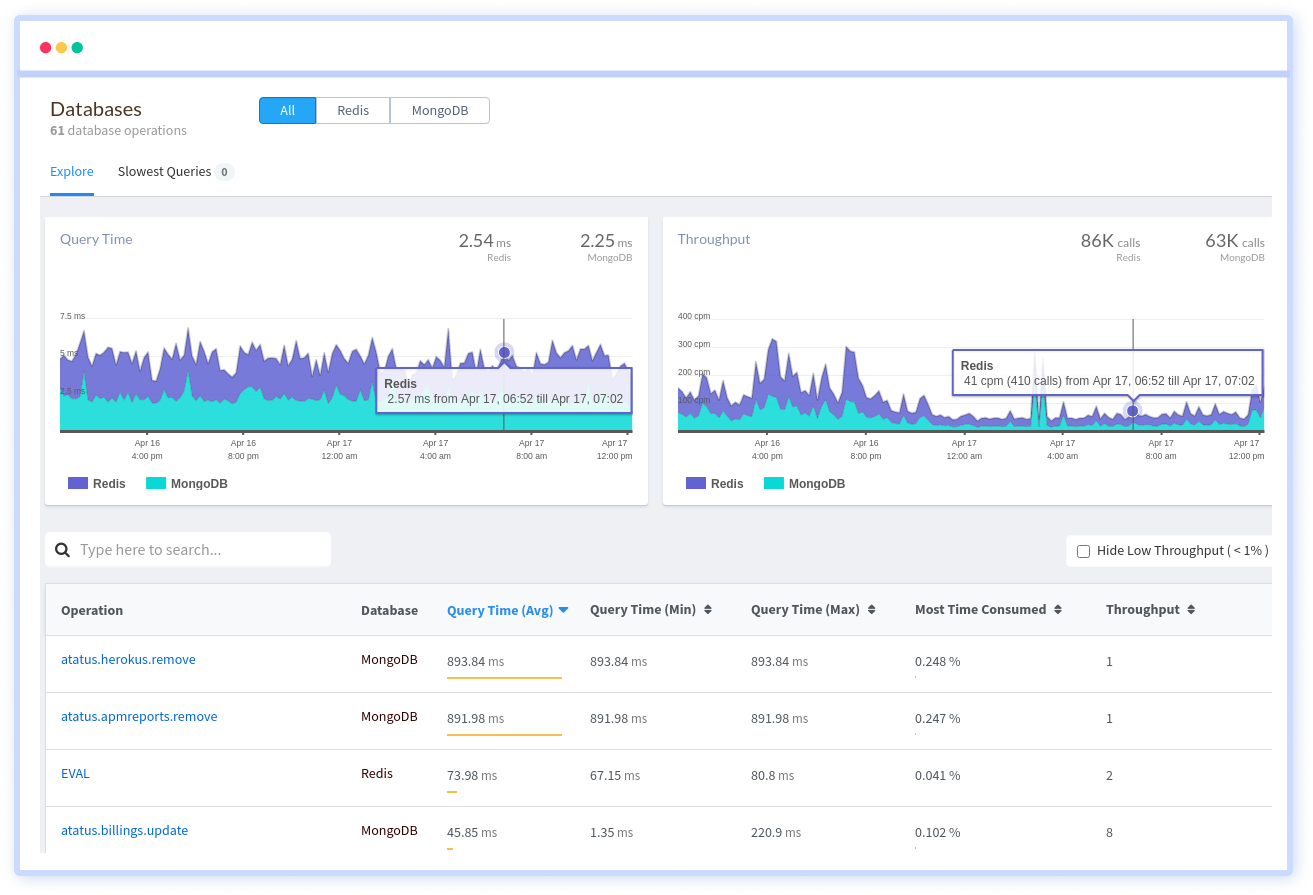
#3 Slowness Caused by an Overwhelmed Database
On a WordPress site, a poorly optimised database might cause general slowness. This database-related slowdown in Atatus will most likely manifest itself in two ways:
- The first thing you'll notice in the overview is that there's a lot of MySQL activity
- Second, in the databases tab, you'll notice that one or more database tables are taking up a lot of time
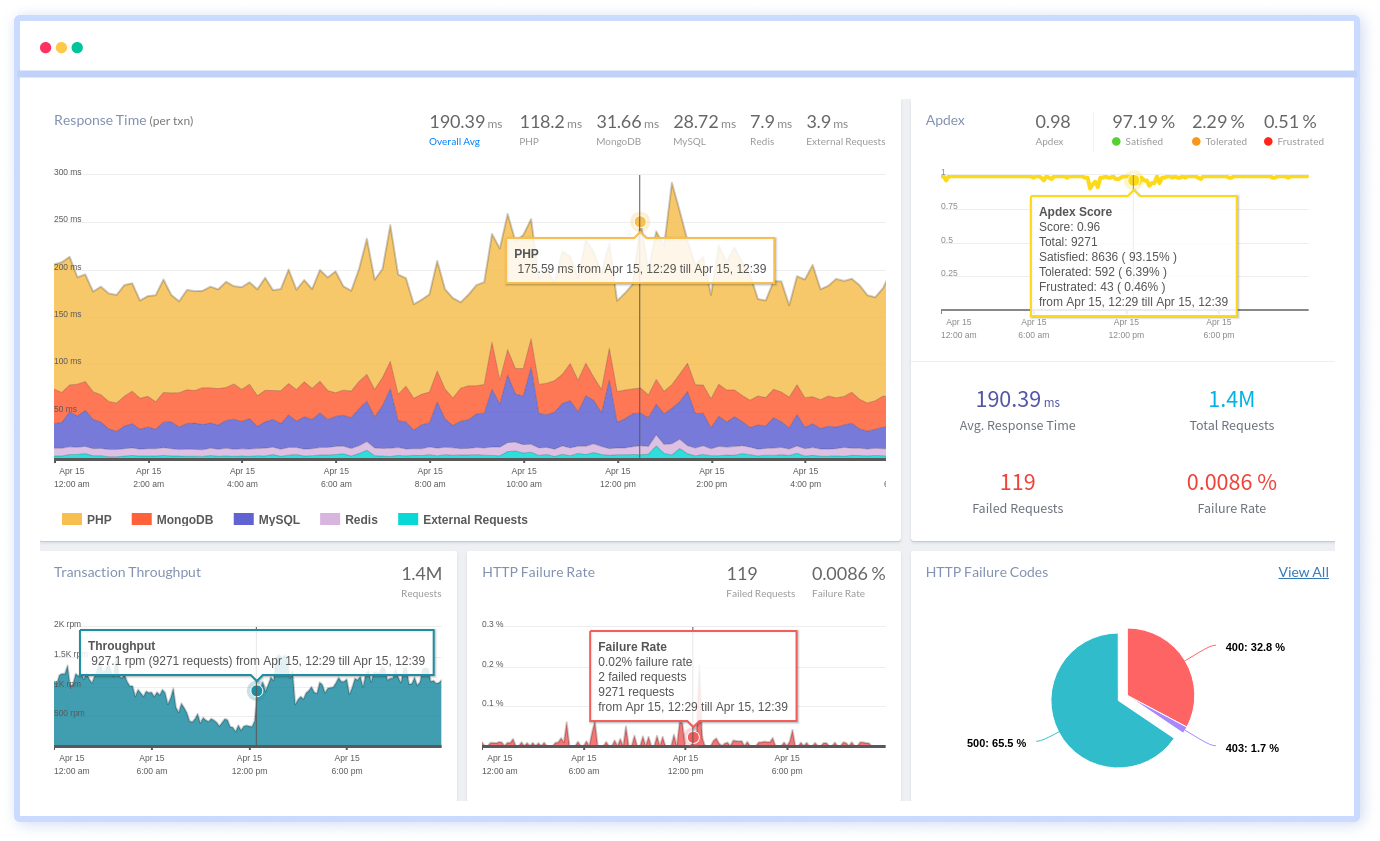
Starting with the overview screen, a site with a failing database can seem as follows:
Go to the databases tab to figure out which database table or query is creating the trouble.

The databases tab will show you which table and type of query are taking the longest. If you click on one of the entries in the list, you'll be sent to a page with further information, including some sample queries.
Why Should Your WordPress Site Be Monitored?
Monitoring your WordPress site allows you to collect data that demonstrates whether or not your site is performing as expected. This information can assist you in making more informed decisions about your website.
Keep the following 3 factors in mind:
- Uptime
This is the time period that visitors can access your website. You want things to be perfect, or as close as possible to perfection. Monitoring uptime allows you to identify when your site is down so you can take action. 'Downtime,' on the other hand, is the amount of time your site is unavailable. - Visitor Statistics
Learn how many people visited your site, which pages they visited, how they arrived at your site, and much more. - Website Speed
Monitoring site speed ensures that you are aware of the situation and can react if necessary.
Benefits of WordPress Monitoring
The benefits of monitoring your WordPress website are numerous; here are a few of them:
- Monitoring uptime may reveal that your site is down for longer than the industry average of seven hours and 45 minutes, indicating that you should move to a better hosting provider. If your site is down for an extended amount of time, it will harm your search rankings, reputation, and revenue, all of which are bad things for any website.
- Uptime monitoring can help you overcome an unexplained income drop. If you run an e-commerce site, downtime means lost revenue, so keeping track of uptime will help you explain any unusual drops. Google was offline for five minutes in 2013, costing $545,000. According to the International Working Group on Cloud Computing Resiliency, downtime caused $285 million in lost or missing revenue in 2014. These are significant figures that show the scope of the problem and the significance of uptime monitoring.
- It's possible that monitoring monthly visitor counts and site performance will demonstrate that a drop in monthly visitors corresponds to an increase in average site speed. A closer look could suggest a decrease in search engine traffic. Because we know that site speed is one of Google's ranking factors, you may opt to make your site faster as a result of monitoring visitor numbers and site speed to recover the change in your search traffic.
Conclusion
You can guarantee that your site ranks highly, provides an excellent user experience, and works smoothly by staying on top of speed optimization. It's critical to lay a solid foundation for your site and keep it clean in order for it to flourish successfully.
Atatus can be a useful tool for discovering PHP performance bottlenecks on your WordPress website once you understand how to utilise it. To get the most out of Atatus, you'll need to be familiar with WordPress, grasp what each tab reports, and see how everything is connected.
Full Stack WordPress Performance Monitoring with Atatus
Atatus provide WordPress Application Performance Monitoring in real-time. It records all requests made to your WordPress applications without forcing you to make any changes to your source code. You can observe the impact of all of your database statements, methods, and external requests on the user experience.

It visualises end-to-end business transactions in your WordPress application automatically. WordPress Monitoring allows you to keep track of the number and types of failed HTTP status codes and application crashes.
Atatus monitors and measures the response times of third-party API calls, as well as REST API failure rates and HTTP status codes. Slice and dice real-time performance measurements based on host, version, release stage, URL, and other factors.
To make bug fixing easier, every WordPress error is monitored using error tracking and captured with a full stack trace with the specific line of source code underlined. You will receive alerts in email, Slack, PagerDuty, or webhook alerts for application errors and exceptions.
#1 Solution for Logs, Traces & Metrics
![]() APM
APM
![]() Kubernetes
Kubernetes
![]() Logs
Logs
![]() Synthetics
Synthetics
![]() RUM
RUM
![]() Serverless
Serverless
![]() Security
Security
![]() More
More

![New Relic vs Splunk - In-depth Comparison [2025]](/blog/content/images/size/w960/2024/10/Datadog-vs-sentry--19-.png)
![New Relic vs Sentry - Which Monitoring Tool to Choose? [2025]](/blog/content/images/size/w960/2024/10/VS--1-.png)