Integrating OpenTelemetry Instrumentation with FastAPI

What do we gain when we integrate OpenTelemetry with FastAPI?
Integrating OpenTelemetry with FastAPI offers many benefits that greatly improve the observability and monitoring capabilities of applications built on this high-performance web framework. By integrating OpenTelemetry's instrumentation capabilities into FastAPI projects, you can understand your applications' inner workings, enabling them to monitor, analyze, and optimize performance.
Also, integrating OpenTelemetry with FastAPI enables extensive distributed tracing across the entire application stack. OpenTelemetry provides standardized APIs and libraries for instrumenting code to capture trace data, allowing you to trace requests propagating through various microservices and components.
This end-to-end visibility into request flows is invaluable for understanding system behavior, identifying performance bottlenecks, and troubleshooting issues in distributed environments.
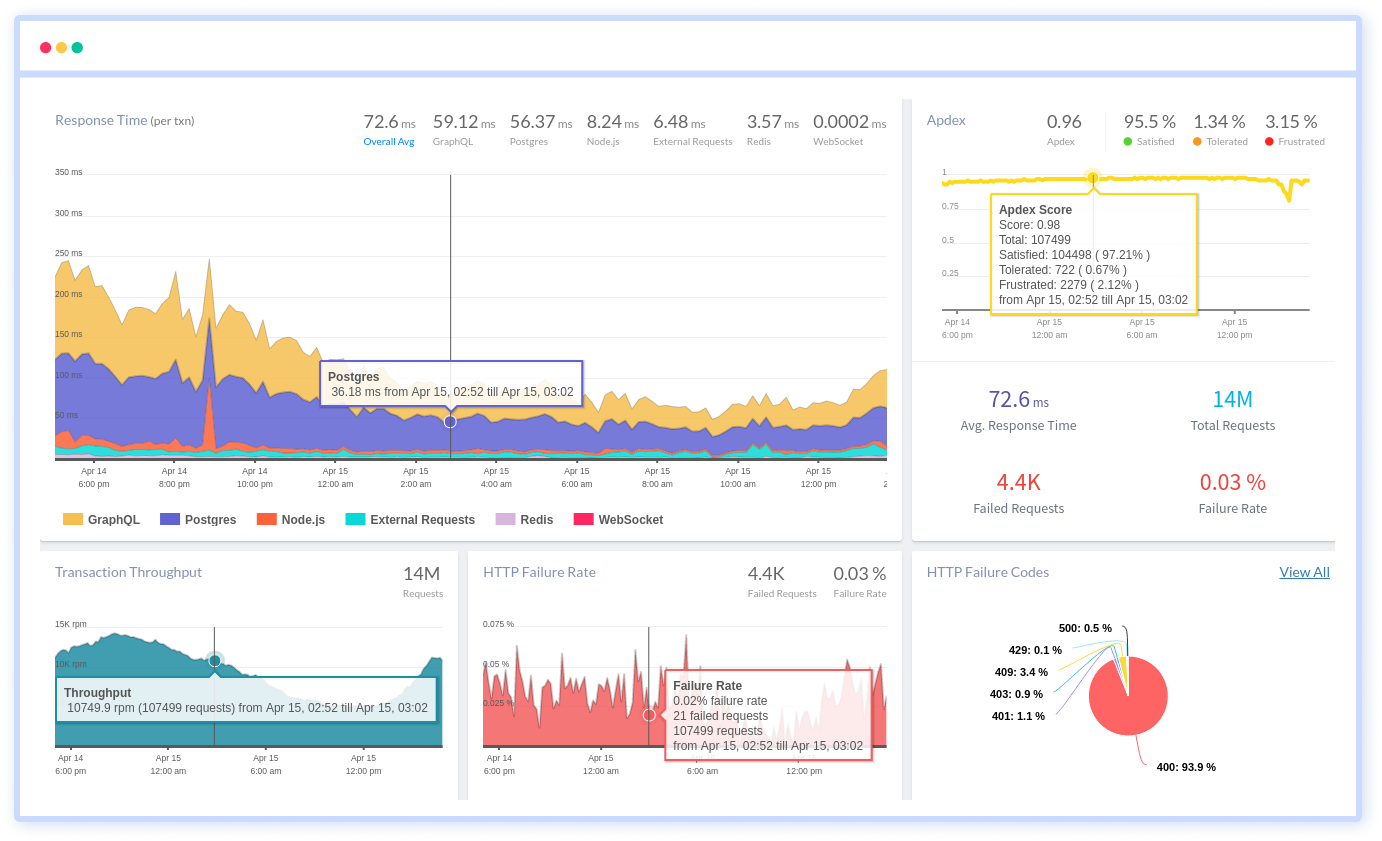
It also facilitates collecting and visualizing key performance metrics. OpenTelemetry's instrumentation libraries enable you to capture metrics such as latency, throughput, error rates, and resource utilization, providing a deep understanding of application performance.
These metrics can be aggregated, analyzed, and visualized using monitoring tools and dashboards, allowing you to make data-driven decisions and optimize system performance.
OpenTelemetry enables teams to adopt a unified approach to monitoring across different services and environments by standardizing instrumentation practices and promoting best practices for monitoring and observability.
This fosters collaboration, improves troubleshooting efficiency, and increases overall system reliability. Let’s get started and learn how to integrate OpenTelemetry Instrumentation with FastAPI.
- Overview of FastAPI Framework
- Configuring OpenTelemetry Instrumentation
- Choosing the Right Instrumentation Libraries
- Best Practices and Tips
Overview of FastAPI Framework
FastAPI is a modern, high-performance web framework for building APIs with Python. It is designed to be fast, easy to use, and highly efficient, making it an ideal choice for developing robust and scalable API applications. FastAPI leverages Python's asynchronous programming features, particularly the asynchronous and await syntax introduced in Python 3.5, to provide asynchronous support and achieve exceptional performance.
Key Features and Benefits:
-
Asynchronous Support: FastAPI fully embraces asynchronous programming, allowing you to write asynchronous code using Python's
asyncandawaitsyntax. This enables non-blocking I/O operations, resulting in improved concurrency and performance. -
Automatic Documentation: FastAPI automatically generates interactive API documentation based on the Python type hints and function signatures used in the code. This documentation is accessible via a built-in Swagger UI or ReDoc interface, making it easy for developers to explore and test API endpoints.
-
Fast Development: FastAPI simplifies the development process by providing intuitive decorators and function-based routing for defining API endpoints. You can define input and output models using Python data classes, and FastAPI handles request validation, serialization, and response formatting automatically.
-
Data Validation and Serialization: FastAPI leverages Pydantic for data validation and serialization, ensuring incoming request data is validated against predefined models before processing. Pydantic also handles response serialization, converting Python objects into JSON format for outgoing responses.
-
Dependency Injection: FastAPI supports dependency injection, allowing developers to define dependencies for API endpoints using function parameters. Dependencies can be singletons, async, or regular functions, providing flexibility in managing dependencies and promoting modular code design.
-
Built-in Security Features: FastAPI includes built-in security features for protecting API endpoints, such as support for OAuth2, JWT (JSON Web Tokens), and API key authentication. These features enable you to secure your APIs against unauthorized access and protect sensitive data.
-
Performance and Scalability: FastAPI is designed for high performance and scalability, thanks to its asynchronous support and efficient request handling. It can handle thousands of requests per second with minimal resource consumption, making it suitable for building large-scale, production-ready APIs.
Configuring OpenTelemetry Instrumentation
Integrating OpenTelemetry Instrumentation with FastAPI lets you collect data and monitor your FastAPI application's performance.
A simple step-by-step guide:
1. Install OpenTelemetry packages:
First, you'll need to install the necessary OpenTelemetry packages. You can do this using pip:
pip install opentelemetry-api opentelemetry-sdk opentelemetry-instrumentation2. Install FastAPI and related dependencies:
If you haven't already, install FastAPI and its dependencies:
pip install fastapi uvicorn3. Set up OpenTelemetry:
You'll need to set up OpenTelemetry in your FastAPI application. This typically involves creating an OpenTelemetry tracer and setting it as the global tracer.
Here's a basic example:
from opentelemetry import trace
from opentelemetry.sdk.trace import TracerProvider
from opentelemetry.sdk.trace.export import ConsoleSpanExporter
from opentelemetry.sdk.trace.export import BatchSpanProcessor
from opentelemetry.instrumentation.fastapi import FastAPIInstrumentor

trace.set_tracer_provider(TracerProvider())
tracer = trace.get_tracer(__name__)
trace.get_tracer_provider().add_span_processor(
    BatchSpanProcessor(ConsoleSpanExporter())
)

FastAPIInstrumentor().instrument_app(app)
Replace app with your FastAPI application instance.
4. Run your FastAPI application:
When you run your FastAPI application, OpenTelemetry instrumentation will be active and start collecting data about your application's performance.
5. View collected data:
You can view the collected data using various OpenTelemetry exporters or by integrating with observability platforms like Jaeger, Zipkin, or Prometheus.
That's it! Now, you have OpenTelemetry instrumentation integrated with your FastAPI application, allowing you to monitor its performance and gather valuable data for analysis.
Choosing the Right Instrumentation Libraries
When integrating OpenTelemetry with FastAPI, choosing the right instrumentation libraries that best fit your monitoring and observability requirements is essential.
OpenTelemetry offers a variety of instrumentation libraries for different frameworks, databases, and third-party integrations. For FastAPI specifically, the opentelemetry-instrumentation-fastapi library provides instrumentation for tracing requests and responses in FastAPI applications.
Before choosing instrumentation libraries, consider the following factors:
-
Compatibility: Make sure that the instrumentation libraries are compatible with your FastAPI version and other dependencies.
-
Feature Set: Evaluate the features provided by the instrumentation libraries, such as request tracing, metric collection, and context propagation. Choose libraries that offer the features you need for monitoring and observability.
-
Performance Impact: Consider the performance overhead introduced by the instrumentation libraries. Choose lightweight libraries that minimize performance impact while providing sufficient monitoring capabilities.
-
Community Support: Look for instrumentation libraries actively maintained and supported by the OpenTelemetry community. Active community supports timely bug fixes, updates, and new features.
Best Practices and Tips
Best practices for writing clean and maintainable instrumentation code:
- Modularization: Organize your instrumentation code into separate modules or classes to promote code reusability and maintainability. Separate concerns such as tracing, metrics, and context propagation into distinct modules to keep the codebase clean and easy to manage.
- Abstraction: Abstract away implementation details by defining clear interfaces and APIs for instrumentation functionalities. Use abstraction layers to encapsulate low-level details and provide higher-level APIs for interacting with instrumentation components.
- Documentation: Document your instrumentation code thoroughly to explain its purpose, usage, and configuration options. Include inline comments, docstrings, and high-level overviews to guide developers in using and extending the instrumentation code.
- Testing: Write unit and integration tests for your instrumentation code to ensure its correctness and reliability. Test edge cases, error handling, and complex scenarios to validate the behavior of your instrumentation in various conditions.
- Logging and Debugging: Incorporate logging and debugging capabilities into your instrumentation code to facilitate troubleshooting and debugging. Log informative messages, errors, and warnings to aid in diagnosing issues and tracking the execution flow of your instrumentation.
Conclusion
Integrating OpenTelemetry Instrumentation with FastAPI brings valuable perceptions into your application's performance, but learning about potential challenges is essential. Firstly, there's the concern of overhead – the extra instrumentation might affect performance, especially in demanding situations.
This could mean more CPU and memory usage, slowing things down when your app faces heavy traffic. Secondly, integrating OpenTelemetry adds some complexity to the development process. You'll need to navigate through settings and interpret data accurately, which might be a bit tricky, especially for newer developers.
There's a bit of a learning curve when using OpenTelemetry. Understanding how it all works might take some time, especially if you're new to monitoring practices. Keeping up with the best practices might also require some ongoing learning.
Additionally, there's a small risk of getting things wrong with the instrumentation, which could lead to inaccurate performance data. It's important to stay alert and make sure everything is set up correctly to get the most meaningful insights from your data.
While integrating OpenTelemetry Instrumentation with FastAPI offers valuable benefits for monitoring and optimizing your application, it's important to consider the potential challenges too.
By carefully weighing factors like overhead, complexity, learning curve, and potential errors, you can make informed decisions about integration. This thoughtful approach can ultimately improve the performance and reliability of your FastAPI applications, making them even better for you.
Atatus API Monitoring and Observability
Atatus provides Powerful API Observability to help you debug and prevent API issues. It monitors the consumer experience and is notified when abnormalities or issues arise. You can deeply understand who is using your APIs, how they are used, and the payloads they are sending.
Atatus's user-centric API observability tracks how your actual customers experience your APIs and applications. Customers may easily get metrics on their quota usage, SLAs, and more.
It monitors the functionality, availability, and performance data of your internal, external, and third-party APIs to see how your actual users interact with the API in your application. It also validates rest APIs and keeps track of metrics like latency, response time, and other performance indicators to ensure your application runs smoothly.
#1 Solution for Logs, Traces & Metrics
![]() APM
APM
![]() Kubernetes
Kubernetes
![]() Logs
Logs
![]() Synthetics
Synthetics
![]() RUM
RUM
![]() Serverless
Serverless
![]() Security
Security
![]() More
More