A Beginner's Guide to Java Stack Traces

As a Java developer, you'll frequently encounter stack traces in your work. By default, these stack traces are displayed on the console when unhandled exceptions occur. However, it's essential not to merely have a superficial understanding of what stack traces are and how to utilize them. This article aims to provide a comprehensive explanation.
A call stack is often defined as the current stack of operations or a representation of the ongoing program flow. When an error, such as an exception, occurs, a stack trace is generated. This stack trace is essentially a record of the call stack's state at the moment of the error.
In a stack trace, the function or method call that triggered the error is displayed first, followed by a list of all the preceding calls that led to that point.
In computing, a stack trace is a report that shows the active stack frames at a specific moment during a program's execution. It's also referred to as a stack backtrace or stack traceback. It's important to note that memory is dynamically allocated in two areas during program execution: the stack and the heap.
- Java Stack Trace - An Introduction
- Accessing StackTraceElement in Java
- Limitations While Using StackTraceElement
- Stack Walking API - Advanced Stack Trace Analysis
Java Stack Trace - An Introduction
A stack trace displays the call stack, which is a sequence of active stack frames, and it includes information about the methods called by your code.
When an exception is not handled appropriately in your code, a stack trace is typically generated. An exception is a message thrown by the runtime environment when it detects a problem in your code. This can be one of the many built-in exception types or a custom exception defined by a program or library.
The stack trace includes the type and message of the exception, along with a list of all method calls that were in progress when the exception was thrown.
Dealing with Java Exceptions
In its simplest form, a stack trace illustrates the call stack at a specific moment, with each entry corresponding to a function invocation.
It captures all method calls made from the beginning of a thread's execution up to the point where the stack trace is generated. Typically, an exception triggers the creation of a stack trace.
Here's a typical textual representation of a stack trace:
Exception in thread "main" java.lang.RuntimeException: A test exception
at com.stackify.stacktrace.StackTraceExample.methodB(StackTraceExample.java:13)
at com.stackify.stacktrace.StackTraceExample.methodA(StackTraceExample.java:9)
at com.stackify.stacktrace.StackTraceExample.main(StackTraceExample.java:5)
When dealing with exceptions, it's crucial to understand the following:
- Root Cause Analysis: To identify the root cause of an exception, examine the most recent methods first. These are more likely to lead you to the source of the problem.
- Method Context: Analyze the methods in the stack trace to understand their context and purpose. Look for surrounding if statements, input data, or method interactions to gain insights into what led to the exception.
Triggering Java Stack Trace
Exceptions are usually triggered by explicit throw statements in the code. For example:
throw new RuntimeException("Something has gone wrong, aborting!");When you encounter an exception, investigate the code that led to the throw statement. Analyze surrounding conditions and the purpose of that code block to pinpoint the issue.
It's also possible for exceptions to be thrown implicitly. For instance, a NullPointerException is thrown when attempting to operate on a null object reference, such as:
Object obj = null; obj.someMethod(); // NullPointerExceptionOther exceptions, like ArithmeticException (division by zero) or ArrayIndexOutOfBoundsException, can occur due to specific conditions defined in the Java Language Specification.
Understanding the circumstances that lead to exceptions and mastering the art of interpreting stack traces are essential skills for effective debugging and troubleshooting in Java.
Accessing StackTraceElement in Java
The StackTraceElement class is fundamental to representing the components of a stack trace in Java, especially before Java 9.
It offers essential information about method invocations, such as class and method names. In Java 9 and later, you can also obtain details about the containing module using the getModuleName and getModuleVersion methods.
Here are some key methods provided by the StackTraceElement class:
getClassName: Returns the fully qualified name of the class containing the method invocation.getMethodName: Retrieves the name of the method containing the invocation.getFileName: Provides the name of the source file linked to the class where the method call was made.getLineNumber: Gives the line number in the source file where the method call occurred.
See the Java API documentation for a comprehensive list of the StackTraceElement class's methods.
Take a look at the structure of a basic example class before going on to a few methods you can use to acquire pieces of a stack trace:
package com.stackify.stacktrace;

public class StackElementExample {
  // example methods go here
}
The methods in this class will show a stack trace.
StackElementExample class members will be called by methods in the test class that follows:
package com.stackify.stacktrace;
// import statements

public class StackElementExampleTest {
  // test methods go here
}
1. Using thread class to access stack trace
To access a stack trace for a specific thread, you can invoke the getStackTrace method on a thread's instance. This method returns an array of StackTraceElement objects, allowing you to inspect the thread's stack frames.
Consider the following example:
public StackTraceElement[] methodA() {
  return methodB();
}

public StackTraceElement[] methodB() {
  Thread thread = Thread.currentThread();
  return thread.getStackTrace();
}
In this example, calling methodA will populate a stack trace, and you can retrieve information about the class and method names using StackTraceElement.
For instance:
StackTraceElement[] stackTrace = new StackElementExample().methodA();
StackTraceElement elementOne = stackTrace[1];
assertEquals("com.stackify.stacktrace.StackElementExample", elementOne.getClassName());
assertEquals("methodB", elementOne.getMethodName());
2. Using throwable class to access stack trace
Another way to access stack traces is by using the Throwable class. When an exception is thrown and caught, you can obtain a stack trace by executing the getStackTrace method on the Throwable instance.
Consider the following example:
public StackTraceElement[] methodC() {
    try {
        methodD();
    } catch (Throwable t) {
        return t.getStackTrace();
    }
    return null;
}

public void methodD() throws Throwable {
    throw new Throwable("A test exception");
}
Here, when an exception is thrown in methodD, you can capture the stack trace and inspect it:
StackTraceElement[] stackTrace = new StackElementExample().methodC();
StackTraceElement elementZero = stackTrace[0];
assertEquals("com.stackify.stacktrace.StackElementExample", elementZero.getClassName());
assertEquals("methodD", elementZero.getMethodName());
Limitations While Using StackTraceElement
- Limited context: Provides limited information about method parameters and local variables.
- Performance overhead: Generating stack traces can be resource-intensive.
- Inaccuracy: Line numbers may not always accurately reflect the source code.
- Platform-dependent: Behavior may vary on different JVM implementations.
- Lack of data flow: Doesn't show data flow between methods.
- Limited support for native code: Limited tracking of native method calls.
- No support for async code: May not work well with asynchronous code.
- Limited to method calls: Only tracks method call hierarchy, not other execution paths.
- Security concerns: Can potentially expose sensitive information in stack traces.
Stack Walking API - Advanced Stack Trace Analysis
To address the limitations of StackTraceElement, Java introduced the Stack Walking API starting from Java 9. This API empowers developers to explore call stacks, extract information, and selectively filter and access frames with more flexibility.
The core components of the Stack Walking API include:
- StackFrame interface
- Stack Walker Options
1. StackFrame Interface
Like a StackTraceElement object, an instance of the StackFrame interface represents a single frame in a stack. This interface defines several APIs that are similar to those in the StackTraceElement class, such as getMethodName and getLineNumber.
Additionally, you may use the method toStackTraceElement to change a StackFrame object into a StackTraceElement if necessary.
However, StackFrame is superior to StackTraceElement because of a crucial API called getDeclaringClass. This function returns a Class instance, allowing you to carry out more intricate actions than you could with a straightforward class name. Be aware that this only applies if the stack walker is configured to keep Class objects.
The settings you may make for this kind of stack walker are covered in the next sections.
2. Stack Walker Options
The Stack Walking API introduces an Option enum type that enables you to customize the data retrieved during stack walking.
Some common options include:
The whole list of its constants is shown below:
RETAIN_CLASS_REFERENCE– While a stack walk, keeps the Class object in each stack frame.SHOW_REFLECT_FRAMES- displays all frames of reflection.SHOW_HIDDEN_FRAMES– displays every hidden frame, including reflection frames.
Accessing the Stack Walking API
The Stack Walking API can be accessed using the StackWalker class. To generate the objects defined by this class, you must use one of the overloaded static methods called getInstance.
StackWalker stackWalker = StackWalker.getInstance();By executing getInstance without any parameters, you may obtain a StackWalker with the default settings. This option directs the stack walker to ignore any hidden frames and keep no class references.
You can customize its behavior by passing options:
StackWalker customWalker = StackWalker.getInstance(StackWalker.Option.RETAIN_CLASS_REFERENCE);
An Option constant can also be sent to that function. If more than one choice is offered, it must first be wrapped in a Set before it can be used to build a stack walker.
Traversing the Call Stack
The most straightforward way to traverse the call stack is by using the walk method. It starts at the point where walk is called and applies a function to the stream of StackFrame objects.
stackWalker.walk(frames -> frames.forEach(frame -> {
    // Process each frame
}));
Note that once the walk method returns, the frame stream is closed for a valid reason. Attempting to access the stream afterward can result in incorrect data because the JVM may rearrange the stack for efficiency.
Alternatively, you can use forEach, a descendant of the walk method, to apply a consumer to each StackFrame in the stream:
stackWalker.forEach(frame -> {
    // Process each frame
});
Thread Safety
The StackWalker class is thread-safe, allowing multiple threads to use a single StackWalker object to traverse their own call stacks concurrently without concurrency concerns.
Example Usage
Let's consider a straightforward example to demonstrate the Stack Walking API:
package com.stackify.stacktrace;

public class StackWalkingExample {
    // Your example methods go here
}
You can create a corresponding test class for your StackWalkingExample to verify the behavior of the Stack Walking API:
package com.stackify.stacktrace;

// Import necessary statements

public class StackWalkingExampleTest {
    // Your test methods go here
}
Conclusion
With Java 9, the Stack Walking API becomes one of the numerous intriguing ways that Java offers to view a stack trace. Simply told, this is far more powerful than the earlier APIs and may result in very helpful debugging tools that let you rapidly identify the source of any issue by capturing the call stack at any given time.
A stack trace, in its simplest form, is an illustration of a call stack at a certain moment, where each piece corresponds to a function invocation. All calls made from a thread's beginning to the point at which the stack trace is created are included. Typically, an exception occurs in this circumstance.
Although stack traces by themselves are not vulnerabilities, they frequently provide information that an attacker would find intriguing. Attackers manipulate the input to the web application using distorted HTTP requests and other input data in an effort to produce these stack traces.
Monitor your Entire Java Application with Atatus
With Atatus Java performance monitoring, you can monitor the performance and availability of your Java application in real-time and receive alerts when issues arise. This allows you to quickly identify and troubleshoot problems, ensuring that your application is always running smoothly.
Monitor the performance of your Java application down to the individual request level. This allows you to see exactly how long each request is taking to process, as well as any errors or exceptions that may have occurred.
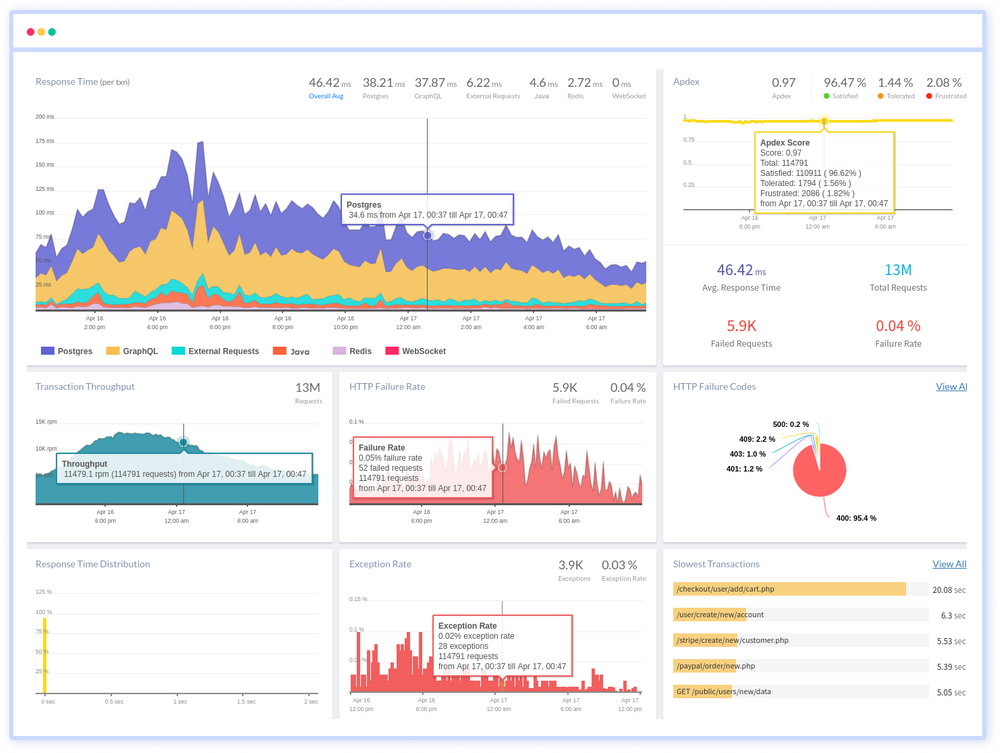
You can also see a breakdown of the different components of your application, such as the web server, database, and external services, to see how they are affecting performance.
Atatus also offers a range of tools and integrations that can help you to get the most out of your monitoring. For example, you can integrate Atatus with popular tools like Slack, PagerDuty, and Datadog to receive alerts and notifications in your preferred channels.
If you are not yet a Atatus customer, you can sign up for a 14-day free trial .
#1 Solution for Logs, Traces & Metrics
![]() APM
APM
![]() Kubernetes
Kubernetes
![]() Logs
Logs
![]() Synthetics
Synthetics
![]() RUM
RUM
![]() Serverless
Serverless
![]() Security
Security
![]() More
More