Make use of the console.log() Like a Pro

For any developer, console.log() is one of the most well-known javascript functions since it allows us to quickly check for errors in our code in some circumstances.
If you're unfamiliar with it, it's a tool that Javascript developers use to debug their code. Almost all popular browsers include a console, which comes in helpful for debugging Javascript. To access your browser's console, you use the console object of Javascript.
There are a number of other ways to use console methods to make debugging more easier. Let's take a look at each one individually with some samples.
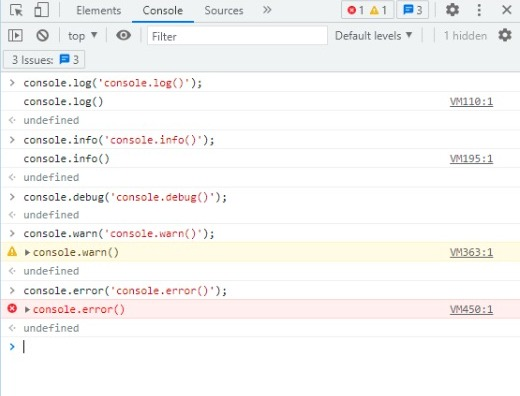
The following are the most commonly used console.log and other consoles methods:
console.log() : For general logging information output.
console.info() : Informative information logging.
console.debug() : Sends a message to the console with the debug log level.
console.warn() : Displays a warning message on the console.
console.error() : Displays an error message on the console.
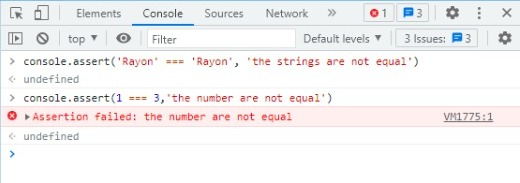
console.assert()
If the condition is false, an error message occurs on the console. Nothing will display if the assertion is true.
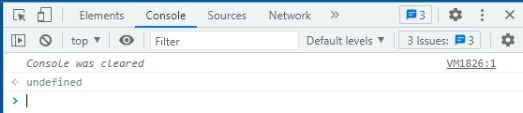
console.clear()
It is used to Clear the console.
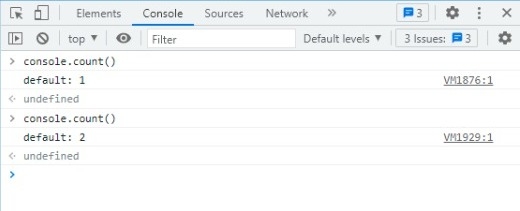
console.count()
Count the number of times the supplied label has been used to call this line.
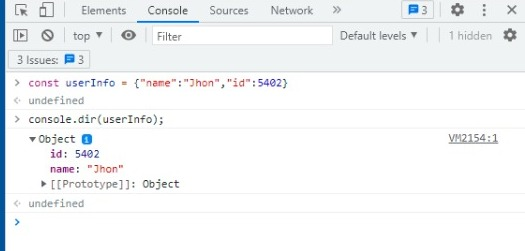
console.dir()
The properties of the provided JavaScript object are displayed in an interactive list.
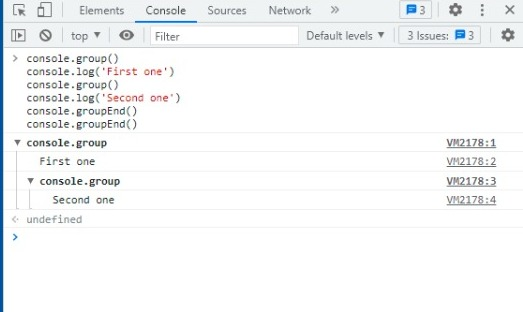
console.group() and console.groupEnd()
In the Web console log, the console.group() method produces a new inline group. This adds an extra level of indentation to subsequent console messages until console.groupEnd() is called.
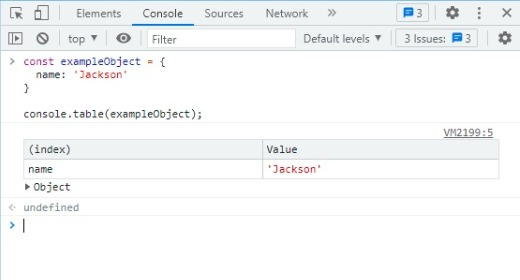
console.table()
The console.table() method creates a table from tabular data. The table's first column will be designated (index). If data is an array, the values will be the indices of the array. If data is an object, the property names will be the values.
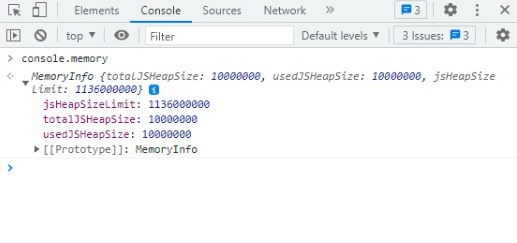
console.memory( )
Are you curious about how our JavaScript applications use browser memory?
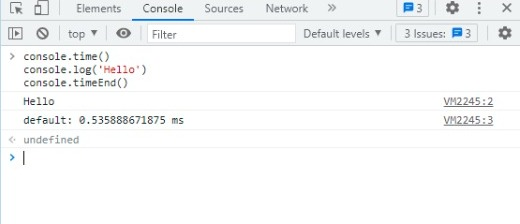
console.time() and console.timeEnd()
You can use the console.time() method to start a timer to track how long an action takes. When you call console.timeEnd() with the same name as the timer, the browser will output the time in milliseconds that has elapsed since the timer began.
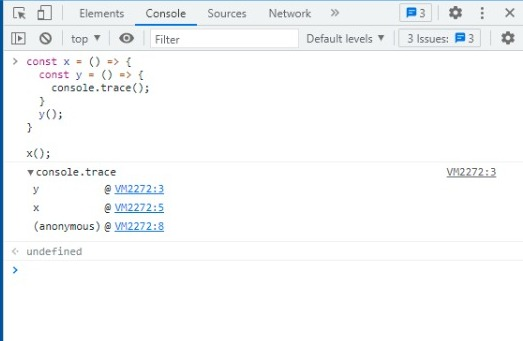
console.trace( )
This method presents a trace of the code's path to a certain location.
String substitutions
When passing a string to one of the console methods we could use string substitutions and pass the params after the message that we want to display.
%s: String%ior%d: Integer%oor%O: Object%f: Float
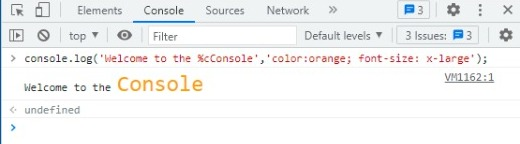
Custom CSS styles for a console.log()
Do your console messages all have the same appearance? It won't be the same from now on; make your logs more appealing to the things that matter most to you.
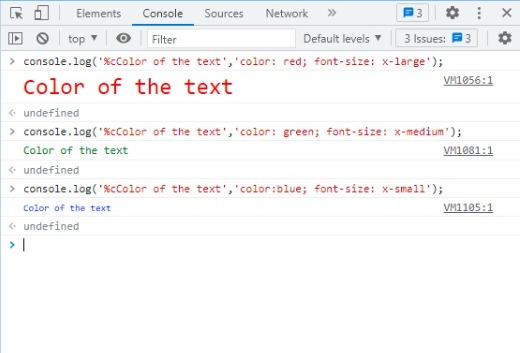
What if you simply wanted to colour one word from the log message? So there you have it.
WindUp
We've seen various different options to the console.log method in this post that can be employed depending on the situation. This will open the developer tools' JavaScript debugging window, allowing you to investigate, step into the next function call, continue execution, and so on. Also, keep in mind that I've only scraped the surface of the Console API. I've tried to show only the utilities that I believed would be useful.
With Atatus, You can keep Track of Your Entire Application.
Atatus is an Observability Platform that allows you to investigate issues as if they had occurred in your application. Instead of guessing why issues occur or requesting images and log dumps from users, Atatus allows you to recreate the experience and immediately figure out what went wrong.
We offer Application Performance Monitoring, Real User Monitoring, Serverless Monitoring, Logs Monitoring, Synthetic Monitoring, Uptime Monitoring, and API Analytics. It works perfectly with any application, regardless of framework, and has plugins.
Atatus provides a full view of your application, including how it works, where performance bottlenecks exist, which users are most impacted, and which faults break your code for your frontend, backend, and infrastructure, which can be advantageous to your business.
If you haven't tried Atatus yet, you can do so for free for 14 days.
#1 Solution for Logs, Traces & Metrics
![]() APM
APM
![]() Kubernetes
Kubernetes
![]() Logs
Logs
![]() Synthetics
Synthetics
![]() RUM
RUM
![]() Serverless
Serverless
![]() Security
Security
![]() More
More