6 Best Node.js Logging Libraries
You can find the issue by reading the stack trace after a program fails. A stack trace, however, only reveals the status of the application at the time of failure and not before the error was met.
Logging packages can help with this. They provide specifics about the behavior of the program before the failure and transmit them to the location you specify, such as a file or a monitoring tool. Node.js has access to a wide variety of logging tools, but not all of them are made equal.
To assist you in selecting the best one for your requirements, we'll evaluate them based on their characteristics and level of fame. But first, let's clarify why you would even want to use a Node.js Logging Tool.
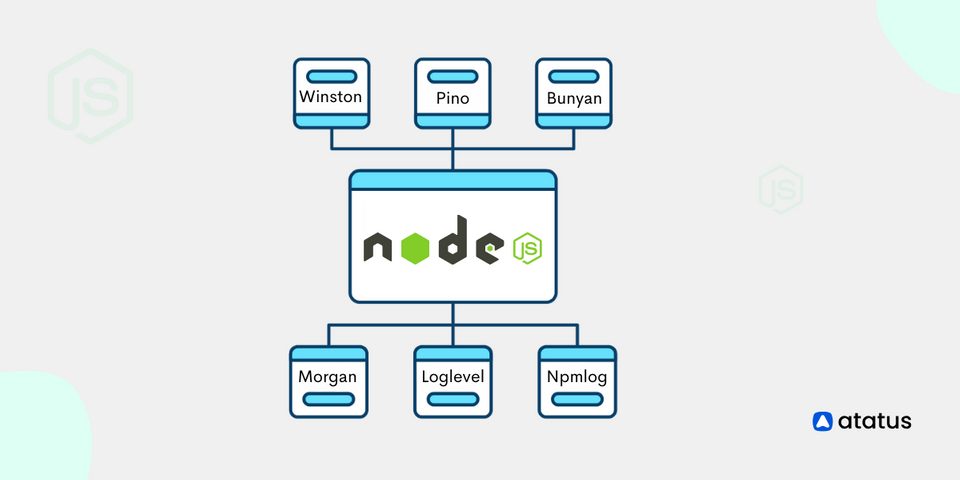
We'll examine the best five logging tools for Node.js in this article:
Why do we require logging libraries for Node.js?
The terminal API, which is included with Node.js, has logging-related functions. However, because the records are in text format, they are frequently challenging to comprehend or filter.
The majority of logging tools come standard with JSON support, and you can simply add dates, sort, or transmit files to the locations you want.
Take into account the following terminal API example:
console.log("log");
console.info("custom message");
console.warn("Warning message");
console.trace("a stack trace");
You will see a result that resembles this when you execute the programme:
// Output:

log
custom message
warning message
Trace: a stack trace
at Object.<anonymous>...
...
Imagine having hundreds of these texts at once.
Knowing the message level or the date the messages were recorded would be challenging, but filtering and organizing the records would also be challenging.
Let's now contrast the output shown above with the output from a Node.js logging library:
{"level":"error","message":"Error message","timestamp":"2022-09-20T11:39:33.953Z"}
{"level":"warn","message":"Warning message","timestamp":"2022-09-20T11:39:33.957Z"}
{"level":"info","message":"Info message","timestamp":"2022-09-20T11:39:33.957Z"}
The result is immediately available in machine-readable JSON format.
And because of this, you can transmit your records to various locations. You could submit it to Highlight, for instance.
You can quickly determine the level to which each communication corresponds using the level field. The majority of libraries provide the following categories (in decreasing sequence of severity):
- fatal: denotes a severe error that could prevent the program from operating used to show that a necessary job has failed
- warn: identifies a potential issue
- info: used for confirmation notifications that a program is functioning as it should
- debug: used for communications that aid in problem diagnosis
The timestamp attribute, which displays the message's log date, is another intriguing choice in the output. Programs can simply sift or organize messages using the date because the logs are in JSON format.
Additionally, you can select the location where you want to save your records using the logging tools. Even better, you can set them up to transmit records to a particular file, database, or even cloud-based tools.
Now that you are aware of the benefits of using logging libraries, let's discuss the top five Node.js logging libraries.
1. Winston
A well-liked, comprehensive, and adaptable recording tool for Node.js is called Winston. Although it sends files in JSON by default, it can be set to transmit them in a variety of storage formats known as transports.
Winston is presently the most-starred logging module in Node.js with 7 million monthly downloads on npm and 19,000 GitHub stars.
Here are a few of Winston's characteristics:
- It generates JSON logs that are simpler to read, organize, or filter thanks to the JSON structure.
- Multiple means of transport: Winston can transmit records to databases, consoles, files, and programs like AWS CloudWatch or Graylog.
- Encourages young miners
- Enables you to search records
- Supports feeds from Node.js
- Enables the creation of unique courses
How to use Winston?
Enter the following code in your console to install Winston:
npm install winstonCreate a file called winston_demo.js and append the following code once it has been installed:
const winston = require("winston");
const logger = winston.createLogger({
    transports: [new winston.transports.Console()],
});

logger.error("Error message");
logger.warn("Warning message");
logger.info("Info message");
logger.verbose("Verbose message");
logger.debug("Debug message");
logger.silly("Silly message");
You must call Winston's createLogger() function with a setup object as an argument to make a Winston logger. Winston should then transmit all logs to the console, so you give the object a transports field with an instance of console(). Finally, for each communication you want to record, you execute the relevant level method.
Winston has seven levels: warning, alert, info, verbose, debug, and silly (in order from the most to the least essential).
Running the program results in:
node winston_demo.jsIt produces results that resemble these:
// Output:


{"level":"error","message":"Error message"}
{"level":"warn","message":"Warning message"}
{"level":"info","message":"Info message"}
Only statements in levels from info to warning are logged by Winston. You must give the configuration object a level attribute in order to see all messages:
...
const logger = winston.createLogger({
    level: "silly",
    transports: [new winston.transports.Console()],
})
...
Our winston_demo.js file's code currently outputs JSON records without dates. Use the format parameter in the config object to put dates:
const winston = require("winston");
const logger = winston.createLogger({
    level: "info",
    format: winston.format.combine(
        winston.format.timestamp(), // adds a timestamp property
        winston.format.json()
    ),
    transports: [new winston.transports.Console()],
});

logger.error("Error message");
logger.warn("Warning message");
logger.info("Info message");
// Output:
// {"level":"error","message":"Error message","timestamp":"2022-09-21T09:00:00.426Z"}
// {"level":"warn","message":"Warning message","timestamp":"2022-09-21T09:00:00.428Z"}
// {"level":"info","message":"Info message","timestamp":"2022-09-21T09:00:00.429Z"}Winston also allows you to specify the file you want to send the logs to, as well as the level:
const winston = require("winston");

const logger = winston.createLogger({
    level: "info",
    format: winston.format.combine(
        winston.format.timestamp(),
        winston.format.json()
    ),
    transports: [
        new winston.transports.File({
            filename: "error.log",
            level: "warn"
        }),
        new winston.transports.File({
            filename: "app.log"
        }),
    ],
});

logger.error("Error message");
logger.warn("Warning message");
logger.info("Info message");
You will discover that two files, error.log and app.log, have been generated after executing the file.
Only error and caution files are visible when error.log is opened:
{"level":"error","message":"Error message","timestamp":"2022-09-21T09:01:45.843Z"}
{"level":"warn","message":"Warning message","timestamp":"2022-09-21T09:01:45.846Z"}
The following is what you will see if you examine app.log:
{"level":"error","message":"Error message","timestamp":"2022-09-21T09:01:45.843Z"}
{"level":"warn","message":"Warning message","timestamp":"2022-09-21T09:01:45.846Z"}
{"level":"info","message":"Info message","timestamp":"2022-09-21T09:01:45.846Z"}
2. Pino
Another well-liked JSON recording utility is Pino. It promises to be 5 times quicker than other logging tools and is lighter. It has 10K ratings on Github and 3 million monthly downloads on npm as of this writing.
Here are a few of the characteristics:
- Using Pino's transports, you can transmit reports to files, the console, or applications like Sentry, Azure Application Insights, CouchDB, etc...
- Pino has components that enable recording for well-known Node.js web frameworks like Express, Fastify, Hapi, etc. Pino can be used for recording in the browser context.
- Making young miners Pino-pretty's printing capabilities are attractive.
How to use Pino?
Install Pino first by running the subsequent programme in a new directory:
npm install pinoAfter that, make a logger.js file to set up the logger:
const pino = require("pino");
module.exports = pino({});
Calling the pino() method with a setup object initialises the logger. You can currently keep the item empty.
Make a pino_demo.js file with the following information in it next:
const logger = require("./logger");

logger.fatal("Fatal message");
logger.error("Error message");
logger.warn("Warn message");
logger.info("Info message");
logger.debug("Debug message");
logger.trace("Trace message");
// Output:
{"level":60,"time":1663751177889,"pid":39927,"hostname":"node","msg":"Fatal message"}
{"level":50,"time":1663751177890,"pid":39927,"hostname":"node","msg":"Error message"}
{"level":40,"time":1663751177890,"pid":39927,"hostname":"node","msg":"Warn message"}
{"level":30,"time":1663751177890,"pid":39927,"hostname":"node","msg":"Info message"}Pino outputs notes in the range of only catastrophic to info. You can define the level attribute in the configuration object to see all levels:
...
module.exports = pino({
    level: "info",
})
...
Installing the pino-pretty module will allow you to format and colourize the results while work is underway:
npm install pino-pretty --save-devTo use it, pass the following commands:
node pino_demo.js | npx pino-prettyOpen logger.js and add the following:
const pino = require("pino");
const fs = require("fs");
const streams = [{
        level: "info", // log INFO and above
        stream: fs.createWriteStream("./app.log", {
            flags: "a"
        }),
    },
    {
        level: "error", // log INFO and above
        stream: fs.createWriteStream("./error.log", {
            flags: "a"
        }),
    },
];
module.exports = pino({
        level: "info",
    },
    pino.multistream(streams)
);
When you save and execute the file, you'll notice that the log information has been generated in two folders in your directory.
3. Bunyan
Another excellent utility that can be used for recording is Bunyan. It has 6.9K ratings on Github and 1.7 million monthly downloads on npm. It is a staunch supporter of JSON logs.
Bunyan offers a straightforward API along with a lot of practical features:
Transports: You can set up Bunyan to transmit logs, files, streams, and other types of data to the terminal using Node.js streams.
Bunyan offers a CLI for prettifying and filtering records, allowing for attractive output.
Supports a variety of software frameworks, including Browserify, Webpack, and NW.js.
How to use Bunyan?
Use npm to install Bunyan in a new location
npm install bunyanconst bunyan = require("bunyan");
const log = bunyan.createLogger({ name: "demo_app" });
log.fatal("Fatal message");
log.error("Error message");
log.warn("Warn message");
log.info("Info message");
log.debug("Debug message");
log.trace("Trace message");You call Bunyan's createLogger() function with a setup object as an argument in the code section before that. Then, using the name property, you give the application moniker.
Run the file now:
node bunyan_demo.jsYou'll see data that appears as follows:
// Output:

{"name":"demo_app","hostname":"node","pid":40239,"level":60,"msg":"Fatal message","time":"2022-09-21T09:22:11.541Z","v":0}
{"name":"demo_app","hostname":"node","pid":40239,"level":50,"msg":"Error message","time":"2022-09-21T09:22:11.542Z","v":0}
{"name":"demo_app","hostname":"node","pid":40239,"level":40,"msg":"Warn message","time":"2022-09-21T09:22:11.542Z","v":0}
{"name":"demo_app","hostname":"node","pid":40239,"level":30,"msg":"Info message","time":"2022-09-21T09:22:11.542Z","v":0}
Bunyan only records from the data level and ascends to the fatal level, similar to Wiston and Pino. To alter this behavior, use the level attribute.
The data can also be cleaned up using the Bunyan CLI:
node bunyan_demo.js | ./node_modules/.bin/bunyanUse the streams property, which takes a variety of transports, to instruct Bunyan to deliver records to files:
const bunyan = require("bunyan");
const log = bunyan.createLogger({
    name: "demo_app",
    streams: [{
            level: "info", // log INFO and above
            path: "./app.log",
        },
        {
            level: "error", // log ERROR and above
            path: "./error.log",
        },
    ],
});
log.fatal("Fatal message");
log.error("Error message");
log.warn("Warn message");
log.info("Info message");
The error.log file receives the mistakes, while the app.log receives the remainder.
4. Morgan
Morgan is a popular Nodejs middleware library which simplifies the logging for web applications. It can work seamlessly with Express.js and also can be used with other Node.js frameworks.
Making log requests to the Nodejs server which includes information about the request method, along with the URL, the status code and the length of the response of the body can be done easily by Morgan.
How to use Morgan?
Install the dependency in your Node.js project.
npm install morgan
(or)
yarn install morgan
After Morgan being installed, it can be used in Express.js applications by adding it as Middleware.
const express = require('express');
const morgan = require('morgan');

const app = express();

// Use the 'combined' format for logging
app.use(morgan('combined'));

// Your other middleware and routes here

const port = process.env.PORT || 3000;
app.listen(port, () => {
  console.log(`Server is running on port ${port}`);
});
If the log format needs to be customized, we can provide our own format string.
// Define a custom log format
const customFormat = ':method :url :status :response-time ms';

app.use(morgan(customFormat));
In Morgan, a custom output stream can be specified for logs.
const fs = require('fs');
const accessLogStream = fs.createWriteStream('access.log', { flags: 'a' });

app.use(morgan('combined', { stream: accessLogStream }));
For example, using the above code, we get the logs written to the ‘access.log’ file.
5. Loglevel
A lightweight logging tool called Loglevel presently has 2.3K stars on Github and 9 million monthly downloads on npm.
However, it misses many features found in the recording tools we have so far examined, most notably native JSON support.
It has some characteristics worth thinking about, depending on your use case:
- Can be incorporated into a browser.
- It only has one file and has no prerequisites.
- Can be expanded with modules to organize, filter, or reroute logs.
- The
loglevel-plugin-prefixandloglevel-plugin-remoteare two commonly used extensions.
How to use Log Level?
Install loglevel using the npm command:
npm install loglevelCreate a file called loglevel_demo.js with the following code in it:
log = require("loglevel");
log.setLevel("info");

log.info("Info message");
log.warn("Warn message");
log.error("Error message");
When you execute the file, you will see data that looks something like this:
Info message
Warn message
Error message
As you can see, using and setting it up for your job is much simpler. However, because the files are not in JSON format, screening may be challenging.
6. Npmlog
The NPM project's logging utility, npmlog, is the last on our roster. On GitHub, it presently has 390 stars and 23 million monthly downloads.
Npmlog is an excellent choice for novices because it is straightforward and lightweight.
Some of the characteristics are as follows:
- Data in the interface that is colored
- The capacity to create unique categories
How to use Npmlog?
Install the npmlog package first:
npm install npmlogYou should create a Node.js file (e.g., npmlog_demo.js) where you'll use npmlog to log messages.
Use npmlog to log messages at different log levels, including silly, verbose, info, http, warn, and error. Your code for using npmlog appears correct.
const log = require("npmlog");

log.silly("Silly message");
log.verbose("Verbose Message");
log.info("Prefix", "Info Message");
log.http("HTTP message");
log.warn("Warning message");
const errorCode = 500;
log.error("Error", "Message: %d", errorCode);
Only levels from data to error are recorded in the report. Also take notice of the output's colorization, which enables you to distinguish between the texts. Npmlog doesn't use JSON, which can be a major disadvantage, particularly if you want to organise or filter them.
Use the level parameter to tell npmlog to display all messages:
const log = require("npmlog");
log.level = "silly"
...
You can define your custom log levels using the addLevel method. Your example for creating a custom log level ("success") is accurate.
const log = require("npmlog");

// Define a custom level
log.addLevel("success", 2000, { fg: "green" });

// Using your custom level
log.success("Prefix", "Success message");
The npmlog-file utility is not a standard part of npmlog. If you want to log to a file, you can use npmlog in combination with Node.js file I/O operations to write logs to a file. The code you've provided for writing logs to a file is correct.
npm install npmlog-fileAdd the following text to your file after that as shown:
const log = require("npmlog");
// import npmlogfile
const logfile = require("npmlog-file");

const errorCode = 500;

log.info("Prefix", "Info Message");
log.http("HTTP message");
log.warn("Warning message");
log.error("Error", "Message: %d", errorCode);

// Write logs to the "app.log" file
logfile.write(log, "app.log");
After running this code, you can locate the app.log file in your directory, which will contain the logged data.
Conclusion
Use one of the tools we covered in this article if you're looking for a quick and effective method to troubleshoot your Node.js apps. Every tool has a distinctive collection of features that can make debugging faster.
In this blog, we have dicussed that Node.js send information to the place you designate, such as a file or a monitoring tool, and provides details about the program's behavior prior to the failure.
There are many different recording tools available for Node.js, but not all of them are created equal. Node.js comes with a terminal API that includes logging-related features. The records, however, are in text format, making them frequently difficult to understand or sort.
The fame and usability of Winston, Pino, or Bunyan, however, force us to suggest them. When it comes to debugging Node.js apps in both development and production settings, these logging tools have proven to be essential.
And they can give you even more information about your Node.js apps when used in conjunction with a tracking tool like Highlight.
Monitor Node.js Metrics, Logs and Traces With Atatus
Atatus keeps track of your Node.js application to give you a complete picture of your clients' end-user experience. You can determine the source of delayed response times, database queries, and other issues by identifying backend performance bottlenecks for each API request.
Node.js performance monitoring made bug fixing easier, every Node.js error is captured with a full stack trace and the specific line of source code marked.
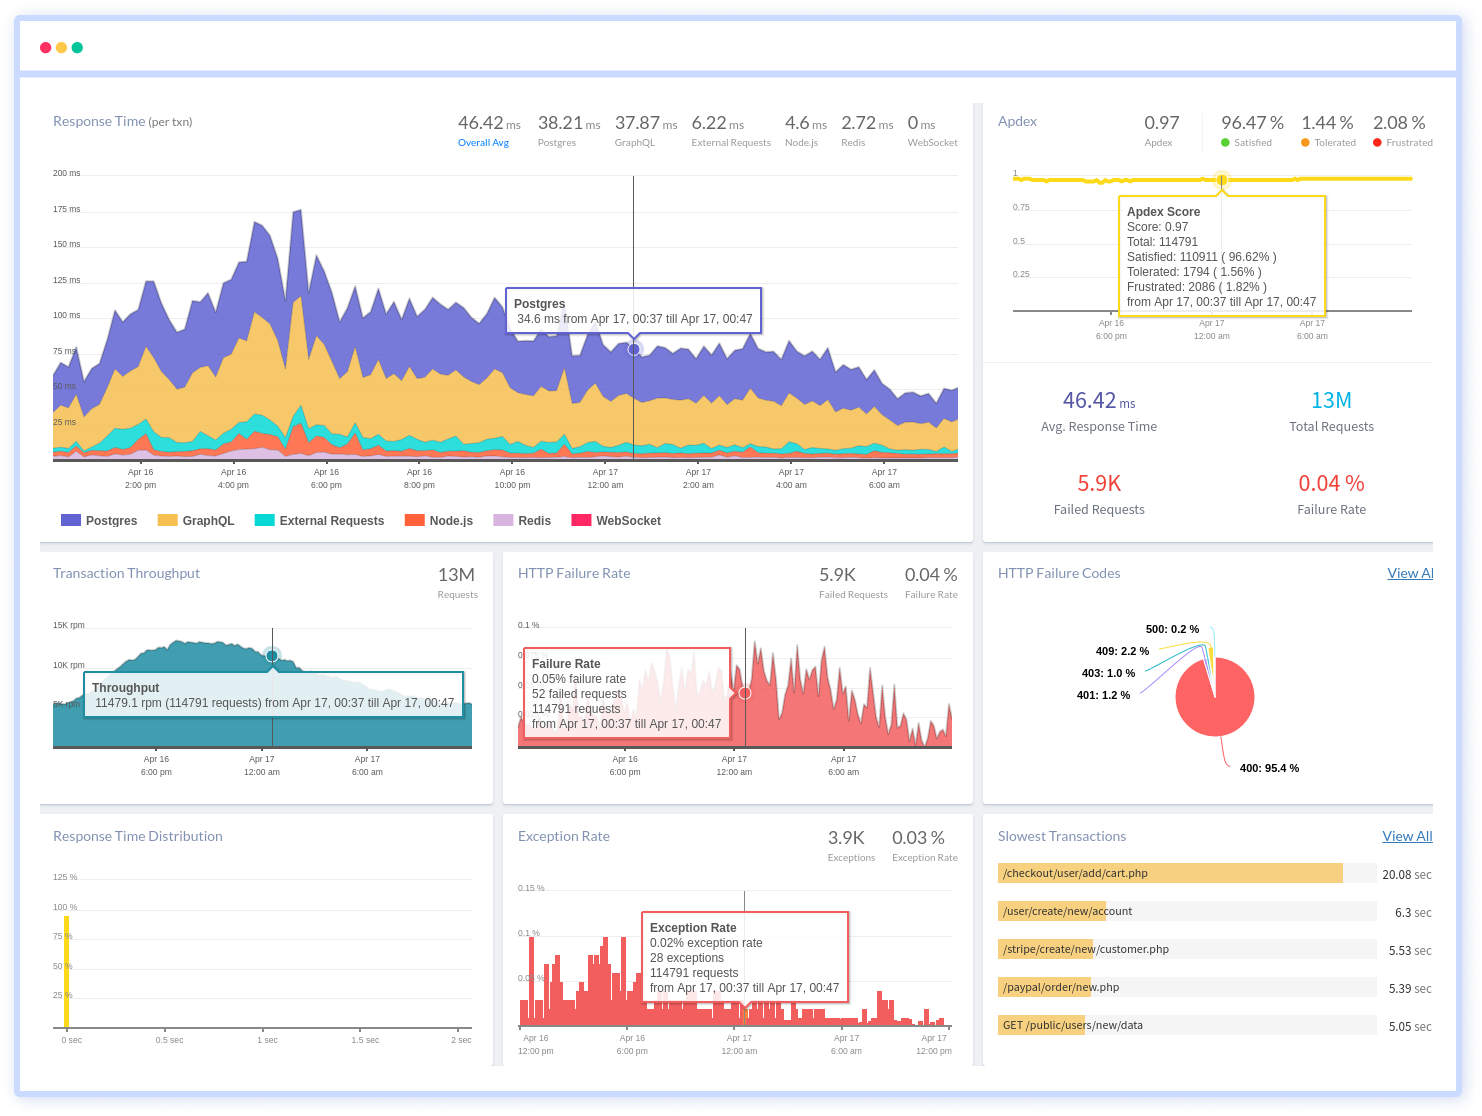
Atatus also offers a Node.js Logs Monitoring solution which is delivered as a fully managed cloud service with minimal setup at any scale that requires no maintenance. Effortlessly track and analyze logs, gain deep insights into your application's performance, and receive real-time alerts for critical issues.
#1 Solution for Logs, Traces & Metrics
![]() APM
APM
![]() Kubernetes
Kubernetes
![]() Logs
Logs
![]() Synthetics
Synthetics
![]() RUM
RUM
![]() Serverless
Serverless
![]() Security
Security
![]() More
More