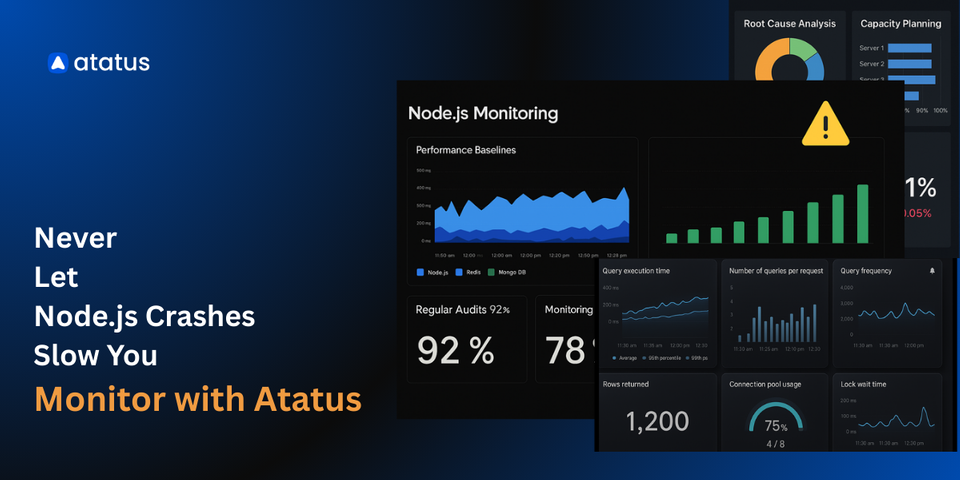
Why Does Your Node.js App Crash in Production and How Can You Fix it?
Node.js has become one of the most popular platforms for building scalable and high-performance web applications. Its event-driven, non-blocking I/O model allows developers to efficiently handle thousands of concurrent connections with minimal overhead. However, many businesses still face a critical challenge, Node.js applications often crash unexpectedly in production environments, causing downtime, lost revenue, and damage to brand reputation.
Understanding why your Node.js app crashes in production and how monitoring can reveal the underlying issues is essential for maintaining business continuity. This blog unpacks the common reasons behind these crashes and explains how proactive monitoring can help you detect, diagnose, and prevent app failures in real time.
Table of Contents:
- Common Reasons Why Node.js Apps Crash in Production
- How Monitoring Exposes Why Your Node.js App Crashes?
- Best Practices to Prevent Crashes in Node.js Production
- Introducing Atatus for Node.js Monitoring
Common Reasons Why Node.js Apps Crash in Production
1. Blocking the Event Loop
Node.js processes all requests on a single main thread known as the event loop, which handles asynchronous I/O operations efficiently. However, when synchronous or CPU-intensive tasks block this event loop, the entire application becomes unresponsive. Such blocking may occur due to:
- Synchronous file system operations
- Complex loop calculations or recursive functions
- Large data processing without offloading to worker threads
Blocking the event loop leads to slow response times or request timeouts, and eventually can crash the application under heavy load.
2. Memory Leaks and Resource Exhaustion
Memory leaks, where unused objects are not freed, gradually consume all available memory, often silently at first. Common causes include:
- Retaining references to resources or data beyond their useful life
- Unclosed connections (e.g., database, file streams)
- Large caches without expiry
As memory builds up, the garbage collector runs more frequently, degrading performance. Eventually, the app crashes with out-of-memory errors, causing service disruption.
3. Unhandled Promise Rejections and Async Errors
Node.js relies heavily on asynchronous programming with promises and callbacks. If rejected promises aren’t handled properly, or errors in async code are not caught, the runtime may terminate the process. Common pitfalls include:
- Missing
.catch()handlers on promises - Throwing errors inside asynchronous callbacks without try-catch
- Poorly implemented global error handling middleware
Proactively catching and logging these errors is critical to avoiding unexpected crashes.
4. Inefficient Database Queries and Slow API Calls
Database queries that work fine during development may become bottlenecks under production load. Examples of problematic queries include those without proper indexes, missing pagination, or fetching excessive data.
Similarly, relying on slow or unreliable third-party APIs can cause request timeouts or cascade failures if proper fallback mechanisms or timeouts are not implemented.
💡Also read →Diagnose slow database queries in Node.js: Why Monitoring is Essential?
5. Common Coding Errors
- Double parsing of JSON payloads in Express apps by using both
express.json()middleware and manualJSON.parseleads to app crashes. - Accidentally exiting the process on non-critical errors without proper retry or recovery logic.
How Monitoring Exposes Why Your Node.js App Crashes?
Without monitoring, troubleshooting crashes becomes guesswork based on logs and vague error reports. Modern monitoring tools reveal invaluable insights by collecting and correlating a wide spectrum of data points:
Real-Time Error Tracking
- Captures uncaught exceptions and unhandled promise rejections with full stack traces
- Includes request metadata and user context for precise debugging
- Aggregates errors by type to prioritize fixes
Resource Usage Metrics
- Tracks CPU utilization, memory consumption, and event loop lag
- Highlights abnormal spikes or trends indicating leaks or blocking calls
- Visualizes garbage collection frequency and duration
Distributed Tracing
- Follows requests across asynchronous calls, databases, and external APIs
- Pinpoints slow or failing components affecting user experience
Dependency and External API Monitoring
- Monitors health and response times of third-party services
- Flags failing dependencies before they crash the app
Alerting and Automated Responses
- Sends notifications for threshold breaches or crash patterns
- Enables quick response to emerging issues before downtime occurs
By consolidating all these signals in unified dashboards and reports, monitoring turns raw data into actionable intelligence.
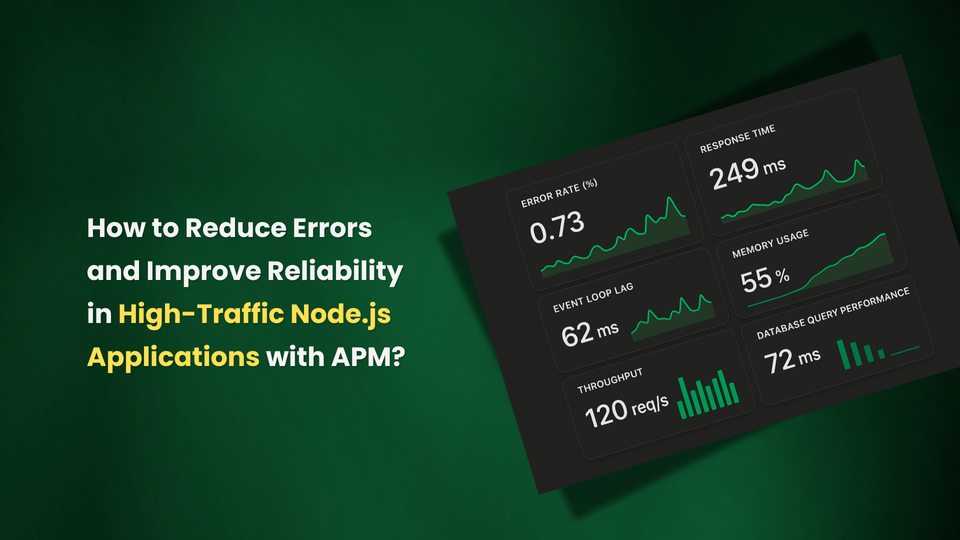
💡Also read → How to Reduce Errors and Improve Reliability in High-Traffic Node.js Applications with APM?
Best Practices to Prevent Crashes in Node.js Production
Implement these best practices to ensure your Node.js application remains stable and performant in production:
1. Use Non-Blocking, Asynchronous Code
Favor asynchronous APIs and avoid blocking calls on the event loop. Offload CPU-intensive tasks to worker processes using modules like worker_threads or external services.
2. Handle Async Errors Properly
Use try/catch in async/await code and always attach .catch() to promises. Use global error-handling middleware to capture uncaught errors and rejections.
3. Optimize Database and API Usage
Ensure queries are indexed and paginated. Use caching to reduce database load. Implement circuit breakers, timeouts, and retries for external API calls.
4. Manage Memory Efficiently
Close unused resources promptly. Avoid large in-memory caches that grow without bounds. Use profiling tools to detect and fix leaks early.
5. Graceful Shutdown and Process Management
Catch uncaught exceptions at the process level to allow cleanup and restarting. Use process managers like PM2 or container orchestrators with health checks to maintain uptime.
Introducing Atatus for Node.js Monitoring
To streamline monitoring and incident detection, teams can adopt specialized monitoring tools designed for Node.js. Atatus is a comprehensive Application Performance Monitoring (APM) and error tracking platform built to provide deep visibility into Node.js applications. It aggregates errors, performance metrics, and traces into unified dashboards that empower developers to resolve issues swiftly.
Key Features of Atatus for Node.js
- Real-time error monitoring: Capture unhandled exceptions, promise rejections with detailed stack traces.
- Performance tracking: Measure CPU, memory, event loop latency, response times, and database query performance.
- Distributed tracing: Visualize request flows across asynchronous calls and external APIs.
- Alerting: Get notified instantly on critical failures or performance degradation.
- User monitoring: Understand how real users experience your application.
- Easy integration: Minimal setup with code instrumentation requiring just a few lines.
By providing actionable insights, Atatus helps teams maintain high availability and deliver optimal user experiences in production environments.
Is Your Node.js App Slowing Down?
Debugging memory leaks, tracking event loop delays, or resolving unhandled errors can be painful. Atatus provides real-time error monitoring, distributed tracing, and performance metrics to help your team fix bottlenecks faster.
Monitor Node.js with Atatus#1 Solution for Logs, Traces & Metrics
![]() APM
APM
![]() Kubernetes
Kubernetes
![]() Logs
Logs
![]() Synthetics
Synthetics
![]() RUM
RUM
![]() Serverless
Serverless
![]() Security
Security
![]() More
More

![What is Node.js Performance Monitoring? [A Complete Guide]](/blog/content/images/size/w960/2025/07/What-is-Node.js-Performance-Monitoring---A-Complete-Guide.png)