Node.js Performance Testing and Tuning: Step by Step Approach

Node.js is well-known for its lightning-fast performance. However, as with any programming language, you might develop Node.js code that performs poorly for your users. Appropriate performance testing is required to combat this.
Node.js can be used for a variety of tasks, including scripting to do tasks, running a web server, and serving static files, such as a website. Today, we'll go over the procedures to test a Node.js HTTP web API.
We'll look at how to set up and conduct a performance test and how to interpret the findings so you can build lightning-fast Node.js applications.
Here’s how it is done:
- Node.js Performance Nature
- What is the Event Loop?
- Node.js Performance and The Event Loop
- Set Up, Execute, And Analyze
- How To Improve Node.js Performance
- Why do Businesses Improve Node.js Performance?
Node.js Performance Nature
Before we get started, let's take a look at one of the more unique characteristics of Node.js performance.
The single-threaded, run-to-completion behavior of Node.js applications—facilitated by the event loop—is a major consideration. So, let's analyze this a little to see what we're dealing with.
#1 Single-Threaded
Let's begin with a single thread.
Threading is a concept that allows many applications to run at the same time. This isn't a feature of Node.js, at least not in the traditional sense. Instead, we may use asynchronous programming and the event loop to create applications that accomplish numerous tasks at once.
#2 Hunting Down Memory Leaks
As we discussed in a previous blog "Memory Leaks in Java," if a program is allocated some memory in RAM and not cleared after its action, the objects in the heap pile up until the working memory resource is exceeded, resulting in a crash. Although the garbage collector clears the working memory, memory leaks are most likely to occur in our applications.
As a result, it's critical to monitor things and set up some alarming or warning features in the system. You can dump the current heap and expose it to JavaScript using the V8 engine.
To address the limitations, the V8 engine uses two types of garbage collection.
- Mark Sweep
When compared to scavenge, this method is slower, but it clears the working memory of all garbage. - Scavenge
Although it is quick, it does not clear all of the unreferenced objects. In other words, it's unfinished.
You can collect debugging performance data and work on JavaScript performance optimization with Node.js profile via JavaScript utilizing the V8 profiler.
Read Best Tips to Node.js Debugging.
What is the Event Loop?

The event loop is a Node.js feature that allows you to break down long-running processes into manageable chunks. It operates like a heartbeat: Node.js checks a work queue every few milliseconds to start new tasks. If there is work, it will add these to the call stack and run them to completion.
Node.js can multitask by dividing tasks down, which is a better alternative to threading. This means that while one task is being completed, another might begin.
Instead of threading, we utilize async code, which is made possible by programming styles such as callbacks, promises, and async/await. The majority of Node APIs come with both synchronous and asynchronous execution options.
So, what does all this techno-jargon have to do with performance, you might ask? 🧐
Node.js Performance and The Event Loop
Consider a Node.js application with two endpoints:
- One for file uploads ⬆️
- Another for retrieving a user profile 😇
The user profile API will almost certainly be used much more frequently than the file upload API, and if it doesn't answer quickly enough, it will block all page loads for all users—not ideal.
The user upload API is rarely utilized. Users also expect task uploading to take time, but they're less patient with page load times. If we don't program with the event loop in mind while the file is uploading, Node.js may steal all of the system resources and prevent other users from utilizing your application.
That is why you must be aware of Node.js’ single-threaded nature. This behavior must be considered as we change our application. We wish to avoid synchronously doing long-running processes like network requests, file writing, or heavy computations.
We can make use of Node.js’s single-threaded nature now that we know about it. Let's walk through how to set up, execute, and analyze a performance test for your Node.js application to ensure you're getting the most out of Node.js' performance capabilities.
Set Up, Execute, And Analyze
We'll now go over how to set up, execute, and analyze a performance test for your Node.js application step by step.
Step 1: Node.js Performance Testing Tools
To begin, select a tool that will enable you to do your performance testing. There are numerous tools available for Node.js performance tuning, each with its own set of advantages and disadvantages.
One thing to keep in mind is that, even if you're testing a Node.js application, it doesn't matter if your performance test tooling is written in Node.js if you're going to test it from the outside world across a network.
Artillery is a simple performance testing tool written in Node.js, for basic HTTP performance testing. It's also extremely good at performing API performance testing.
Artillery works by defining your load profile via a configuration file. You tell Artillery which endpoints you want, at what pace, for how long, and so forth.
The following is an example of a basic test script:
config:
  target: 'https://artillery.io'
  phases:
  - duration: 45
  arrivalRate: 15
  defaults:
    headers:
      x-my-service-auth: '987401838271002188298567'
scenarios:
- flow:
- get:
url: "/docs"
With 15 new people arriving at the URL, you're requesting Artillery's website for a 45-second timeframe.
Then you simply run the following command to perform the test:
artillery run your_config.ymlArtillery will send your application as many requests as you specify. This is excellent for creating performance test profiles that are similar to what you'd see in production.
Step 2: Node.js Performance Test Profile
As previously stated, a performance test profile is a description of how your performance test will execute. To accomplish realistic Node.js performance optimization, you'll want to emulate how your production traffic behaves, if at all possible.
If you're creating an event website, for example, you'd expect a lot of traffic around the time you distribute tickets, therefore you'd want to create a profile that reflects this. You'll want to see if your application can handle a huge volume of traffic in a short length of time.
If you run an e-commerce website, on the other hand, you might expect even more traffic. This behavior should be reflected in your performance test profiles.
#1 Using a Variety of Test Profiles
You can design several test profiles and run them in an overlapping method, which is a fun and fascinating feature to note.
For example, you could construct a profile that simulates your normal traffic—say, 100 requests per minute—and then simulate what would happen if your website received a lot of traffic, such as if you ran some search engine ads.
For complete Node.js performance tuning, it's vital to test multiple situations.
#2 Replicating Large-scale Distributed Systems
We did like to take a moment to point out that once an application reaches a certain scale, simulating demand in this manner becomes unfeasible. It's difficult to build a genuine like-for-like technique for testing your application before release because the traffic levels may have been so wild, unpredictable, or big in volume.
What if this is the case, though? What are our options?
We test in the real world.
"Woah, hold on!" you could scream.
Isn't it true that we're supposed to test before releasing?
Can, however, once a system reaches a particular scale, it may make sense to employ various performance testing methodologies. You can use concepts like canary releasing to get your changes into production while only testing them with a small number of users. You can switch that traffic back to your previous implementation if you notice a performance drop.
This technique encourages experimentation, and the greatest thing is that you're testing on your actual production application, so you don't have to worry about test results that don't match production.
So far, we've agreed on our tooling and established profiles that mimic our production processes, such as traffic and workloads. What are our options for the future?
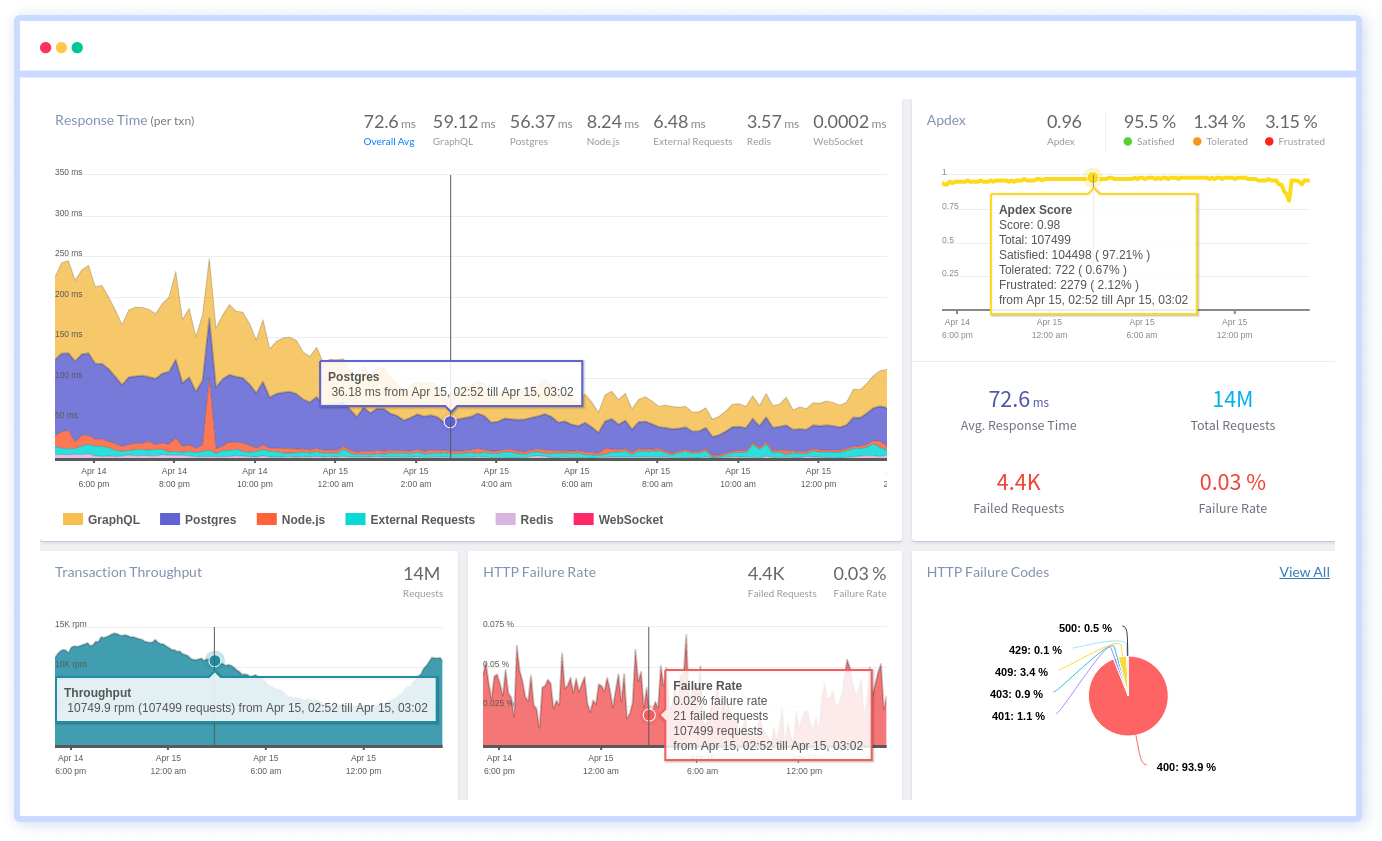
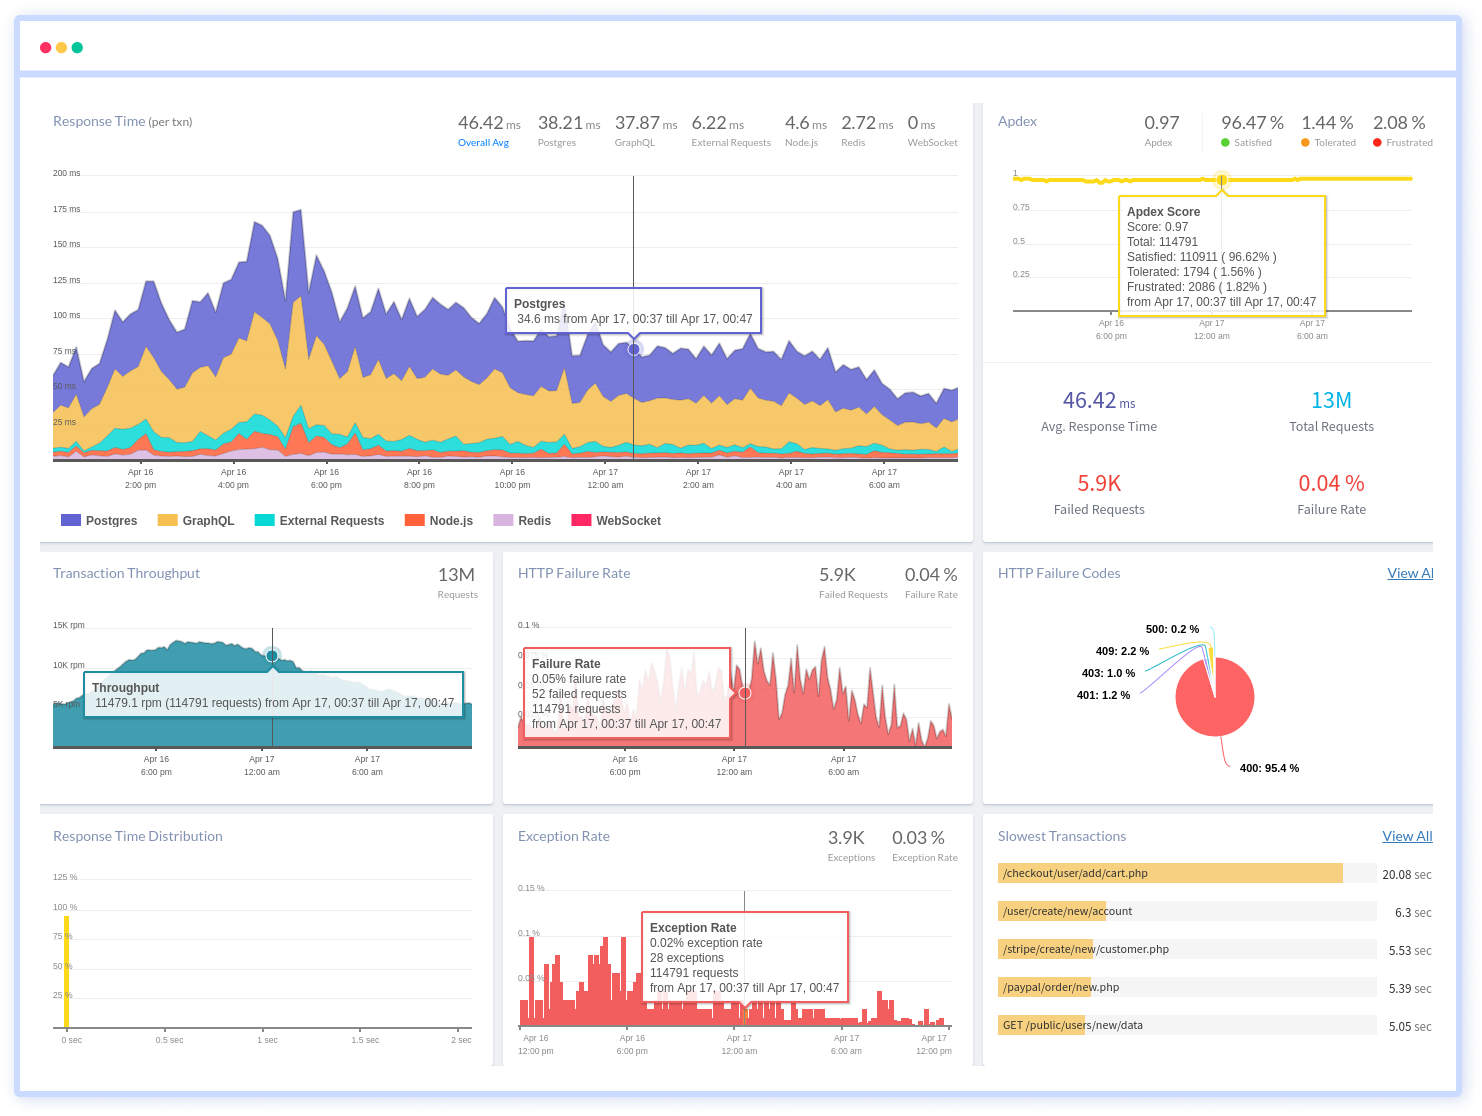
We use Node.js performance monitoring and Application Performance Management (APM) tools to ensure that we have the data we need to analyze our application.
Step 3: Build Your Observability/Monitoring
We don't want to just hope and pray that our performance test would pass against our application. We won't be able to tell how it's doing or whether it's doing what we think it should if we do so.
So, before we begin, we should ask ourselves, "What are my service level agreements (SLAs) and key performance indicators (KPIs)? What metrics are required to debug a performance issue effectively? What does good look like for my application?"
If your application is slow or performs differently than you planned, you'll need data to figure out why and fix it. Observability and/or monitoring solutions are used in every production application worth it is salt. These tools, often known as APMs, allow you to see key Node.js performance metrics for your current application.
APM is available in a variety of sizes and shapes, each with its own set of features, pricing, security concerns, performance, and so on. It's worthwhile to do some research to get the finest tool for your needs. When we run our Node.js performance tests, these tools will provide us with the insights and data we require.
So, now that we know we should monitor our application, what should we be looking for?
You want as much data as possible in an ideal world, but as much as we love data, we have to be realistic about where to begin. The three areas listed below are the greatest places to begin:
#1 Aggregated Logs
For gaining insight into an application, application logs are generated either implicitly by some libraries or manually by a developer. The majority of log aggregation solutions make it simple to find and visualize your logged data. We could track the performance of each of our APIs and plot it on a graph in our scenario.
#2 Application Monitoring
This type of tool is frequently embedded in your application code and can provide information on how functions perform are called, what problems we throw, and so on.
Some APM tools, such as Atatus, combine all or most of these three aspects, whilst others are more specialized. Depending on your needs, you may desire a single tool that does everything or a collection of tools for various tasks.
#3 Infrastructure Insights
You'll probably want to see all of the data because your application will run on a host of sorts. Most cloud providers supply this data (although in a basic form) out of the box if you're running in the cloud. These tools will provide you with information on your host's CPU and memory usage, as well as connection data.
#4 Node.js-specific Software
Other Node.js-specific tools and profilers, such as flame graphs, that look at our function execution or extract data about our event loop execution, can be added on top of tools. Your data requirements will only increase as your knowledge of Node.js performance testing grows. To truly understand your application, you'll want to constantly shop around, experiment, and update your tooling.
We're almost ready to run our tests now that we've set up our tooling, created realistic profiles for our performance, and gained a better understanding of our application's performance. But there's one more thing to accomplish first: Set up test infrastructure.
Step 4: Node.js Performance Test Infrastructure
If you want to run performance tests on your computer, you can, but there are drawbacks. So far, we've worked very hard to ensure that our performance tests replicate—for example, with our test profiles. Another factor in repeating our tests is to run them on the same infrastructure every time (read: machine).
Cloud hosting is one of the simplest ways to build a consistent test infrastructure. Choose a host/machine from which to conduct your tests, and make sure that you run them from the same machine each time—and preferably from the same location as well—to avoid skewing your data due to request latency.
It's a good idea to script this architecture so that you can build and deconstruct it as needed. This concept is referred to as "infrastructure as code." Most cloud providers have native support for it, or you may utilize a tool like Terraform to assist you.
So far, we've covered a lot of ground, and now it's time to run our tests.
Step 5: Run Your Tests
The final step is to execute our tests. We'll see requests to our Node.js application if we start our command-line configuration (like we did in step 1). We can examine how our event loop is behaving, whether particular requests are taking longer than others, whether connections are timing out, and so on, using our monitoring service.
Consider including performance tests in your build and test workflow as the cherry on top of your performance testing. Running your performance tests overnight so you can review them in the morning is one approach to do this. Artillery makes it easy to create these reports, which can help you spot any Node.js performance issues.
How to Improve Node.js Performance
Let's look at several ways to boost Node.js performance.
Techniques for improving Javascript performance include:
- Avoid Memory Leaks
Memory leaks will slowly reduce your available storage space until the CPU is overworked. When a DOM is destroyed but some variables are still referenced to it, a memory leak occurs. As a result, it's best to avoid removing DOM values without first setting them to null. - Caching
Caching is a strategy for improving overall performance that can be used on both the server and client sides. Client-side caching involves temporarily storing content such as Java scripts, HTML pages, and CSS stylesheets. - Load Balancing
It's critical to create a Node.js application that can handle a huge number of incoming connections. The distribution of traffic to balance the connections may be a viable strategy. - Implementing HTTP/2 And SSL/TLSs
Using HTTP/2 when developing a Node.js application can improve web surfing speed while also reducing bandwidth usage. The major goal of HTTP/2 is to improve performance and address concerns with HTTP/1.x. HTTP/2. - Optimizing Data Handling Methods
By simplifying system processes, optimization improves overall application efficiency. In most Node.js applications, data is retrieved via making API queries and receiving a response. - Secure Client-Side Authentication
To store session data, you can use central storage solutions like Redis, or in a load-balancing scenario, you can use the IP hash approach to ensure that users always access the same server. - Stateless Client-Side Authentication
When used for stateless authentication, JSON Web Token (JWT) can help Node.js run faster. Unlike stateful authentication, the data is always available and does not take into account the machine that is serving the user.
Why do Businesses Improve Node.js Performance?
Today, not only startups but also large corporations are adopting technologies like Node.js. It's not like any other game-changing technology that fades away in a matter of months.
When it comes to job growth, Node.js is ahead of the pack when compared to peer-group technology. It provides the essential building blocks of functionality, such as protocol support, system access, cryptography, and a few basic utility functions, more intelligently.
Modern web projects that need to take data from multiple sources, aggregate it, and deliver it to multiple users in real-time are using Node.js. Node is the greatest system bridging technology currently available.
Conclusion
Node.js offers a wide range of performance utilities, due to major improvements in requirements for network-connected software systems. It does, however, require maintenance and performance adjustment, just like any other technology. We've covered several optimization approaches in this blog that can help your Node.js application run faster.
Monitor Your Node.js Applications with Atatus
Atatus keeps track of your Node.js application to give you a complete picture of your clients' end-user experience. You can determine the source of delayed response times, database queries, and other issues by identifying backend performance bottlenecks for each API request.
To make bug fixing easier, every Node.js error is captured with a full stack trace and the specific line of source code marked. To assist you in resolving the Node.js error, look at the user activities, console logs, and all Node.js requests that occurred at the moment. Error and exception alerts can be sent by email, Slack, PagerDuty, or webhooks.
#1 Solution for Logs, Traces & Metrics
![]() APM
APM
![]() Kubernetes
Kubernetes
![]() Logs
Logs
![]() Synthetics
Synthetics
![]() RUM
RUM
![]() Serverless
Serverless
![]() Security
Security
![]() More
More

![Application Performance Monitoring (APM) Guide: Monitor and Optimize Application Performance - [2026 Update]](/blog/content/images/size/w960/2025/10/APM-GUIDE---Monitor-and-Optimize-Application-Performance.png)