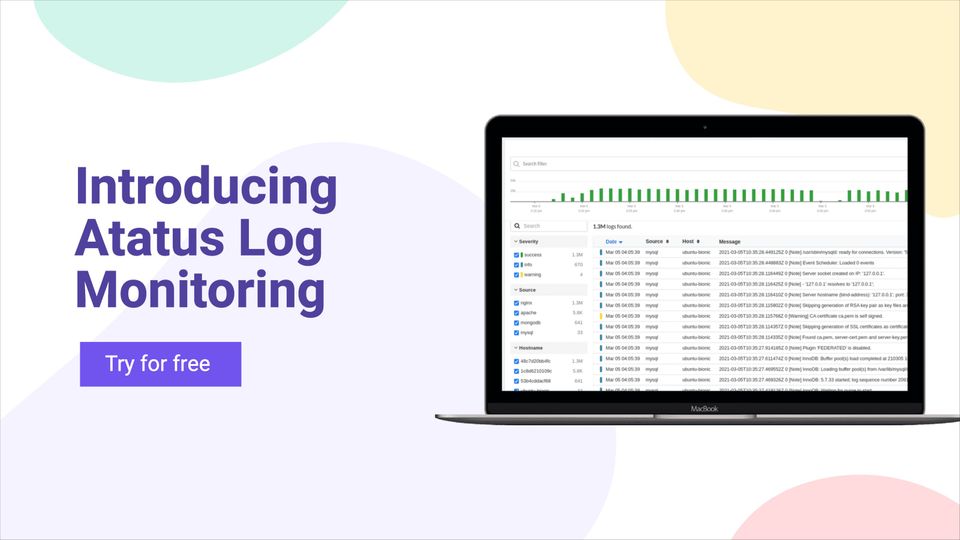
Introducing Atatus Log Monitoring

Log Monitoring is a crucial step in ensuring to know what’s happening in all your servers from a single location. We are introducing Atatus Log Monitoring. Get to know the features we offer and start monitoring your logs to resolve the errors as soon as possible.

Monitoring Heroku apps with Atatus

Most of the organizations now prefer Heroku for managing and deploying modern apps. You can now monitor you apps deployed in Heroku with Atatus. Look in the blog for the detailed descriptions about monitoring Heroku apps.

Monitoring the performance of your Fetch API

The fetch API allows you to make network requests similar to XMLHttpRequest (XHR). We already wrote a blog about how Fetch API are simple and yet power full in our previous article.

Introducing Infrastructure Monitoring

Collect and analyze data about the infrastructure/server wit Infrastructure Monitoring. Using this data, you can monitor the performance and the behavior of the hosts at the infrastructure level. Try it for free.

Monitor your entire software stack

Gain end-to-end visibility of every business transaction and see how each layer of your software stack affects your customer experience.