Top PHP Monitoring Tools: 2026 Update
PHP is one of the most widely used programming languages for Web development worldwide. It is used by almost 80% of the developers who work on building websites, and one reason for this is the enormous configuration options. Further, PHP is used extensively for developing content management systems and web service APIs.
Since most web applications are customer-facing, there is a need to improve their availability and request processing speed. Thus, monitoring and keeping them up to date is of prime importance.
However, errors are unavoidable, and they deter applications from being efficient. Monitoring PHP applications gives you code-level insights into how they are performing, where errors occur, and what needs to be changed. This blog will focus on the top 9 PHP application monitoring tools and discuss their features, functionalities, and more.
We already know you need PHP monitoring?
Atatus gives you function-level traces, DB query analysis, and error tracking - free for 14 days. No credit card.
The Top 9 PHP Application Monitoring Tools are:-
PHP Monitoring Tools: At a Glance
Not sure which tool fits? Here's a quick feature comparison before we dive into the details:
| Feature | Atatus ★ | New Relic | Datadog | Dynatrace | XDebug |
|---|---|---|---|---|---|
| PHP APM | ✓ Full | ✓ Full | ✓ Full | ✓ Full | ✗ Dev only |
| Function-level traces | ✓ | ✓ | Partial | ✓ | Partial |
| Database query analysis | ✓ | ✓ | ✓ | ✓ | ✗ |
| Error tracking | ✓ | ✓ | ✓ | ✓ | Basic |
| Laravel / WP / Symfony | ✓ All 3 | Partial | Partial | ✓ | ✗ |
| Free trial | 14 days | Free tier | 14 days | 15 days | Open source |
| Per-seat pricing | No (host-based) | Yes | Yes | Yes | Free |
| Best for | Full-stack PHP APM | Enterprise | Multi-cloud | AI-driven ops | Local debug |
1. Atatus
Atatus is a full-stack Observability platform offering robust PHP performance monitoring. By tracking KPIs such as response times, throughput, HTTP failure rates, and error rates, Atatus helps users identify and address any performance issues before they impact the application.
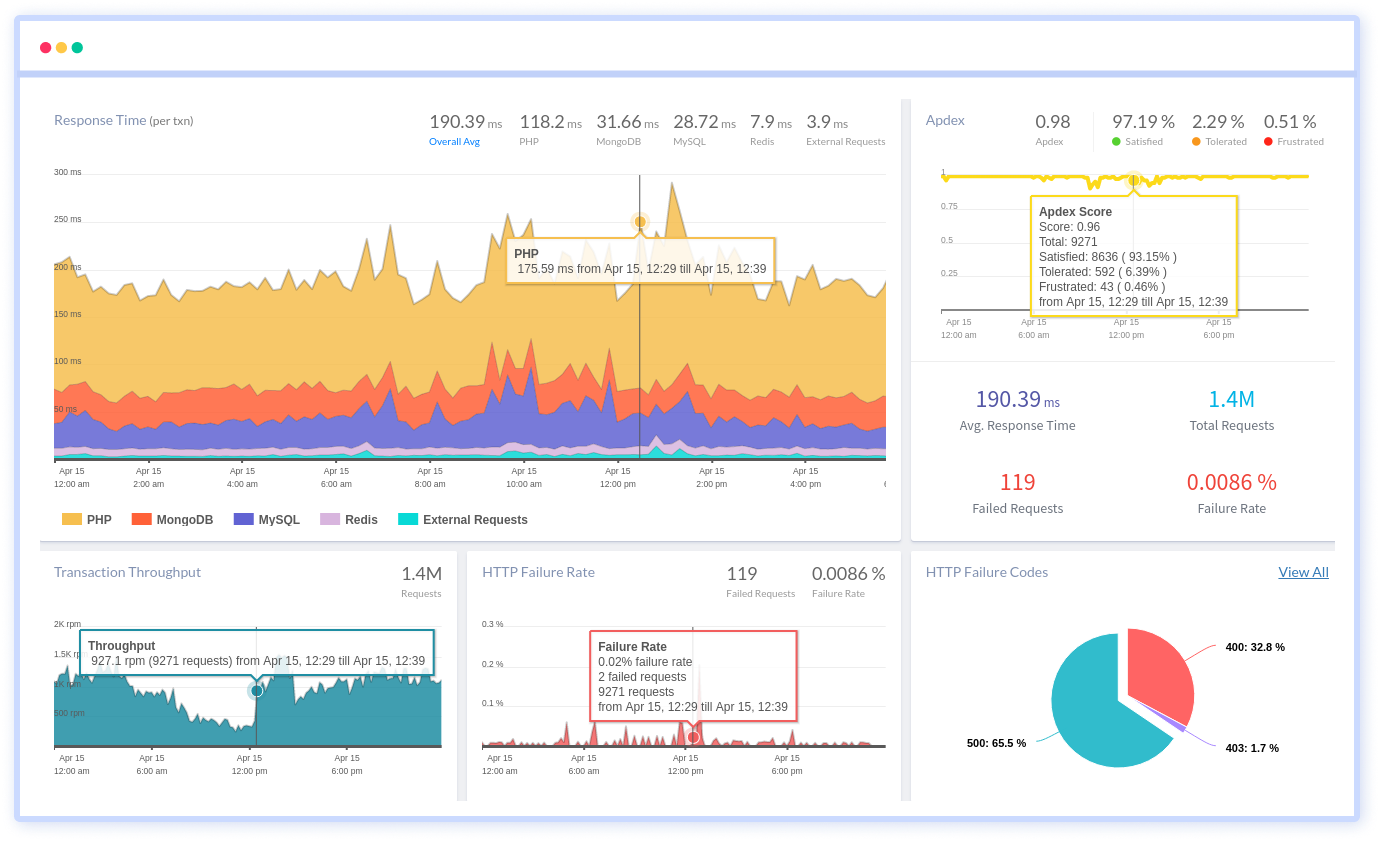
Atatus supports multiple PHP frameworks, including WordPress, Magento, Laravel, CodeIgniter, Symfony, and more.
As part of its PHP monitoring, Atatus looks into the following:
a.) Transaction Monitoring - Keep an eye on critical transactions within your application and pinpoint performance bottlenecks on the server side by analyzing individual requests in depth.
b.) Database Monitoring - Gain insights into the most time-consuming queries that hinder your PHP application's performance. Receive details such as response time, throughput, and slow database queries, along with their original stack traces, enabling you to optimize every database call impacting user experience.
c.) Session Traces - Gain granular insights into each trace and access a detailed timeline depicting the load and interactions of backend services. This provides a comprehensive view of your application's operations, including function-level metrics, enabling a thorough understanding of its functioning and performance.
d.) Slow Request Traces - Identify executed functions and pinpoint areas needing further debugging to enhance your application's speed with detailed slow request traces.
e.) External Request Monitoring - Monitor all third-party API calls that may slow down your application and identify which external calls impact specific transactions.
f.) API Failures - Gain a comprehensive overview of HTTP failures, including status codes, and analyze custom data to understand the root causes of these failures.
g.) Deployment Tracking - Keep track of each deployment to ensure the newer version of your application does not adversely affect the older version. Our APM tool meticulously monitors all activities involved in deploying an application.
h.) Error Tracking - Collect all PHP exceptions, complete with stack traces and precise code line references, to understand and address issues impacting users effectively.
Pinpoint Function-Level Errors with Atatus Session Traces
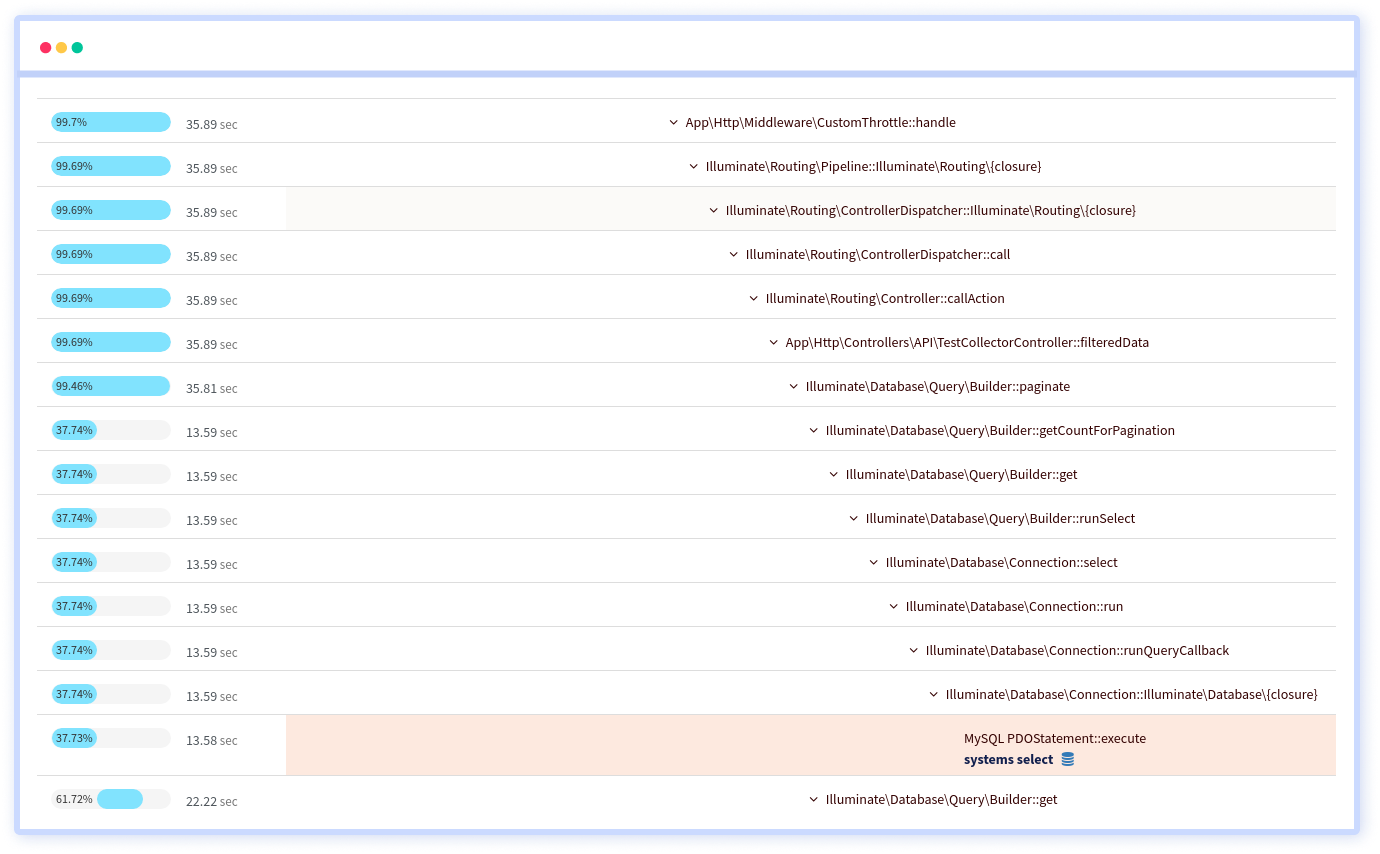
Atatus tracks the complete lifecycle of PHP sessions, capturing events from initialization to expiration. This comprehensive monitoring allows you to understand how sessions are managed within your application and pinpoint any anomalies or unexpected behaviors.
With real-time session tracing, you can monitor function-level activity as it happens, enabling you to quickly detect and respond to issues as they arise. Identify and categorize slow PHP requests based on time spent in different activities such as code execution, database queries, interactions with external services, template rendering, message queue operations, and more.
Seamlessly access logs, infrastructure metrics, and virtual machine (VM) statistics alongside the original request to gain a comprehensive understanding of its context.
Get complete details on PHP Performance Monitoring here.
See Atatus in action on your PHP app
Install the agent in 5 minutes. No credit card needed. Works with Laravel, WordPress, Symfony, Magento.
2. ManageEngine
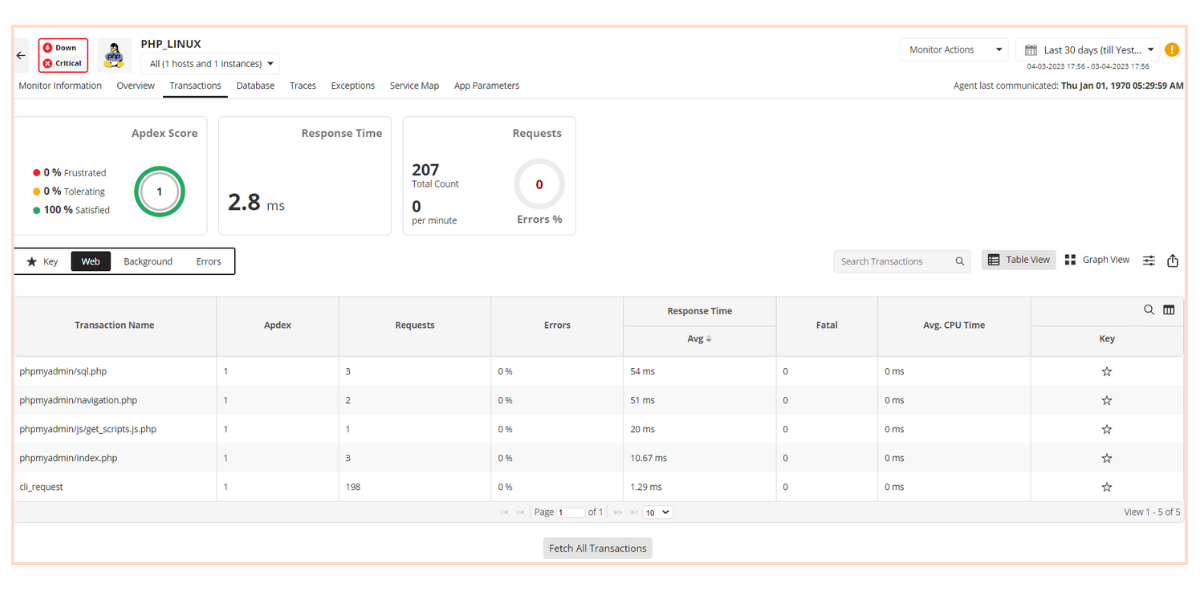
ManageEngine’s Applications Manager provides in-depth monitoring of PHP servers. They provide comprehensive management reports on application availability and performance. They capture metrics on response time, page faults, busy servers and bytes transferred and give out alerts and notifications promptly. Based on whatever thresholds you’ve set, alerts go off if any of the thresholds are breached and actions are executed automatically.
They offer performance graphs that can be broadly grouped based on availability, health, and connection time. The historical trend analysis is of great help for comparing both old and new PHP applications or updated application, delivering proper insights into performance over a period of time.
3. AppOptics
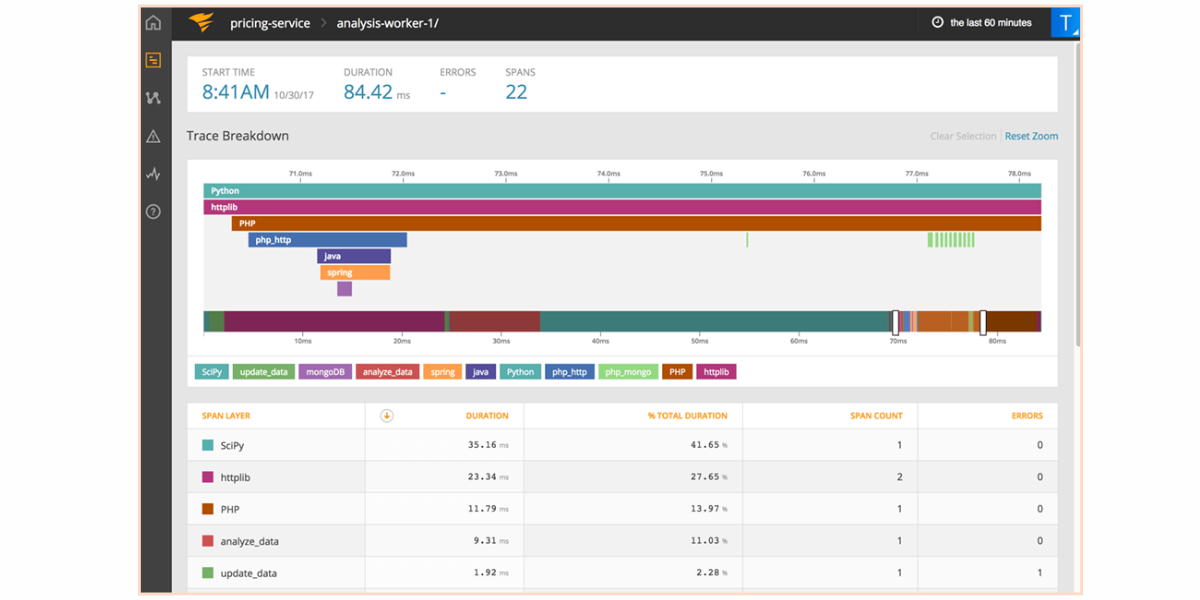
SolarWinds AppOptics is a SaaS based APM and Infrastructure tool for hybrid and cloud-native IT environments. Its PHP performance monitoring tool offers real-time visibility into the complete distributed architecture. With respect to PHP monitoring, they offer monitoring capabilities for various PHP frameworks, remote calls, and more. With their pre-populated dashboards, you can track many out-of-the-box and custom metrics to get results in real-time.
With AppOptics, you can:
- Track PHP memory usage effectively
- Access a wide array of frameworks and libraries, including .NET, PHP, Ruby, Python, and Java, right from the start
- Analyze trends or delve into detailed code-level insights
- Develop and tailor plugins to suit specific needs
4. New Relic
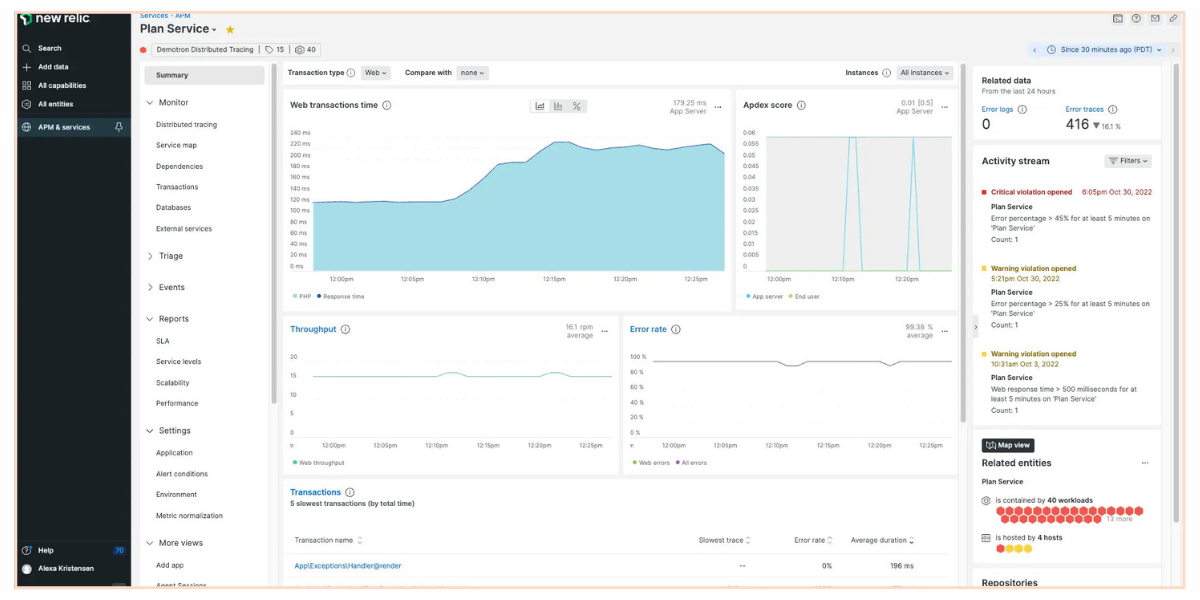
New Relic’s PHP monitoring is a comprehensive solution having real-time monitoring features, coupled with uptime or availability monitoring and error monitoring.
New Relic traces each transaction within your PHP application, providing detailed insights into the time spent on different parts of your codebase, including external services and database queries. Offering code-level visibility, it identifies slowest codes and allows you to optimize them. Also, it provides detailed error traces with contextual information on all of them.
New relic offers standard scalability and resource utilization and can help with availability across multiple geographic locations, alerting developers to downtime or performance degradation issues. Further, their customizable dashboards and reports track KPIs such as user engagement, conversion rates and revenue. You can also view historical trend analysis and identify patterns that cause errors.
5. Better Stack
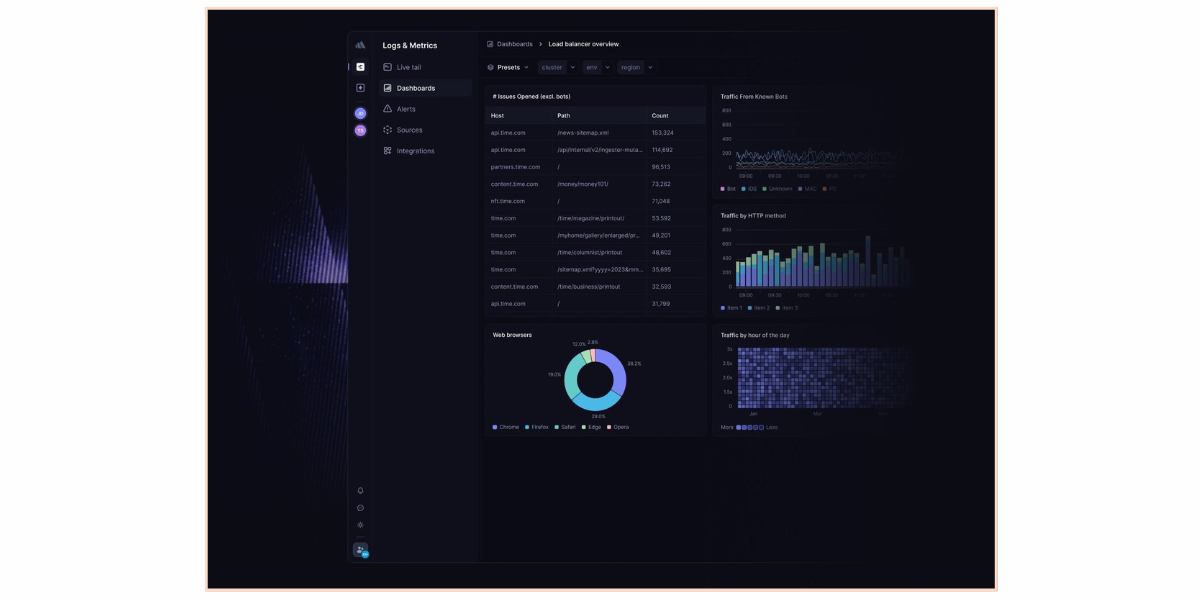
BetterStack is a log management platform based on ClickHouse. It is a good choice if you want to log data from any of your PHP applications. Once you've configured it, you can collect logs from any PHP application, including Laravel.
After you’ve logged the data, you can use their logtail/live-tail to track logs across the microservices and present an overall picture.
BetterStack Logs are a part of their BetterStack ecosystem and together with Uptime, they offer good enough visibility into your applications.
Comparing too many tools?
Most PHP teams end up choosing Atatus for APM - full-stack visibility, no per-seat pricing, 14-day trial.
6. Dynatrace
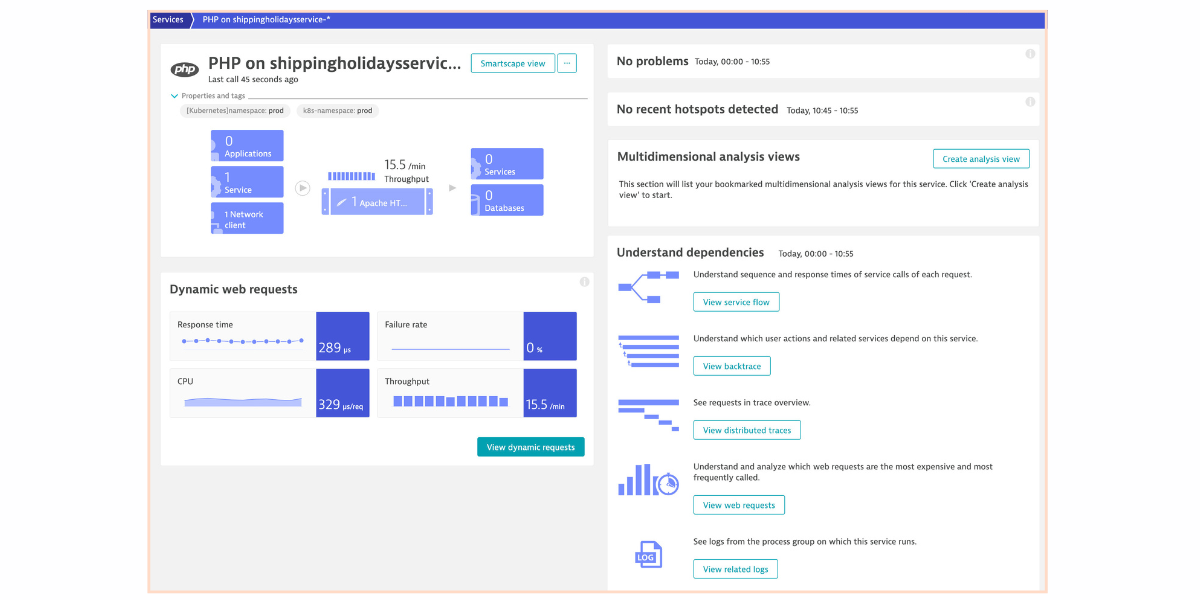
Dynatrace offers automatic and intelligent end-to-end observability for PHP applications. The instrumentation is fully automatic and you can monitor all the PHP applications distributed over the entire architecture.
With their highly efficient monitoring tool, you can reduce MTTR and proactively optimize the performance of your applications. Additionally, they have an AI enhancement, which gives detailed summary of root-cause analysis of all the errors and exceptions encountered.
Dynatrace tracks the entire application stack using their OneAgent. Once it is configured, it automatically collects relevant metrics and visualizes them in preconfigured dashboards.
7. XDebug
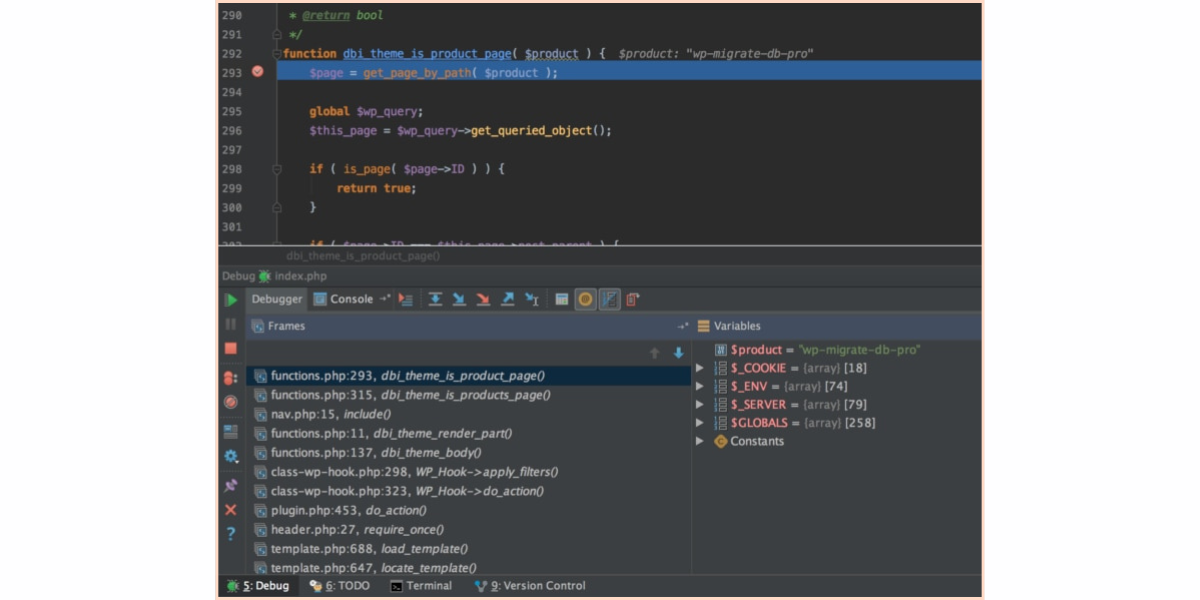
XDebug is a powerful debugging and profiling tool for PHP. It's an open-source extension for PHP that provides various features to help developers debug and profile their PHP code more effectively.
Some of the key features of XDebug include:
- XDebug debugs PHP code using stack traces, variable inspection, and breakpoints. You can inspect the code line by line, scourging through variables and expressions to identify bugs.
- XDebug generates detailed reports on execution times, memory usage, and function calls, enabling developers to pinpoint areas of inefficiency in an application.
- XDebug can generate code coverage reports, showing which lines of code have been executed during a particular test suite or request. This helps ensure comprehensive test coverage and identifies areas of code that may need additional testing or refinement.
- This enables developers to debug production or staging environments without modifying the code or disrupting users.
- XDebug integrates seamlessly with popular integrated development environments (IDEs) such as PhpStorm, Visual Studio Code, and Eclipse.
8. AppDynamics
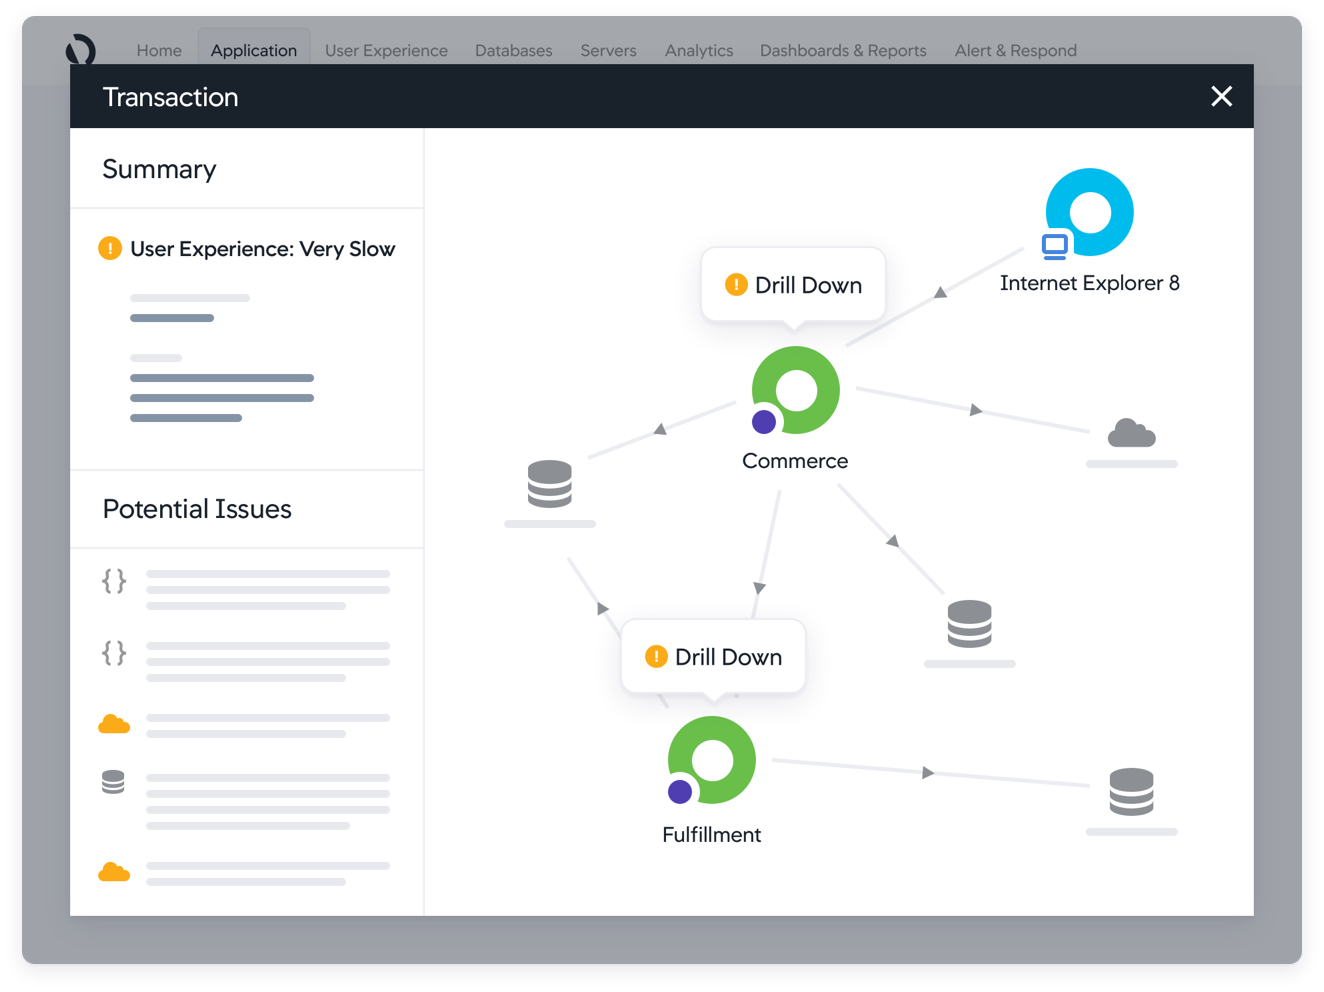
AppDynamics offers end-to-end visibility into your PHP applications. You can automatically discover and correlate the workings of all the interdependencies and trace key business transactions with their PHP Application Performance Monitoring. You can also prioritize transactions beyond just application and infrastructure nodes.
With the transaction snapshots, easily locate hot spots and drill down slow methods within the application environment. Detect errors in real-time, and fix them instantly with Runbook Automation. Gain code-level in depth visibility and correlate this data with underlying server and database infrastructure. They support a host of frameworks including CakePHP, CodeIgniter, Drupal, Lightspeed etc.
9. Datadog
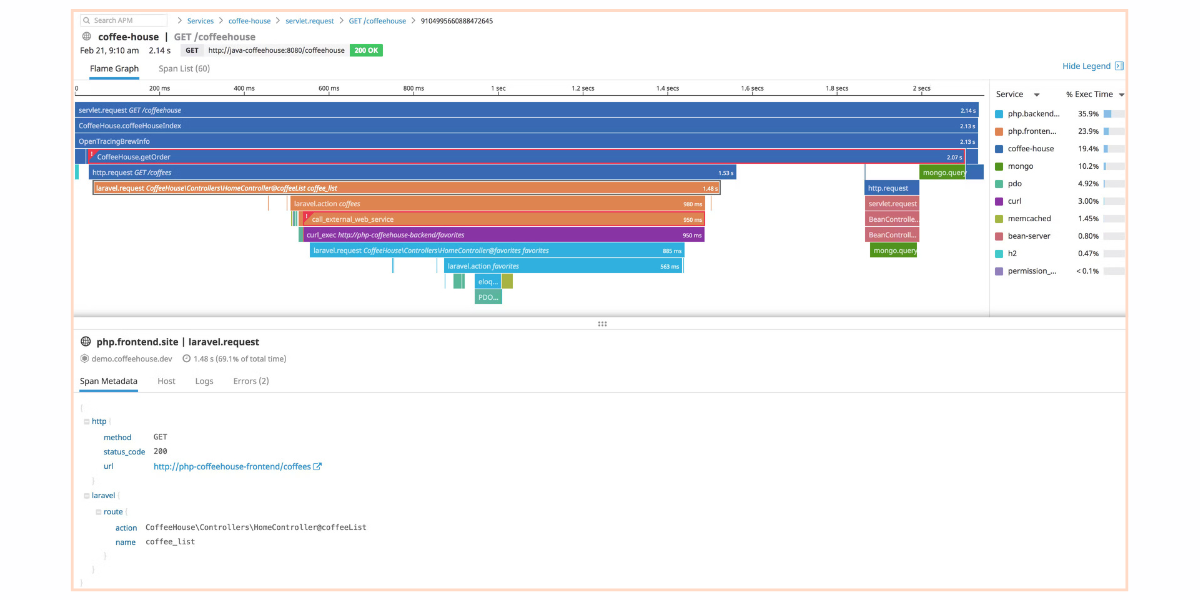
Datadog offers comprehensive PHP performance monitoring equipped with service maps to pin-point any disruptions in the application. You can monitor PHP at the application, endpoint, and user-level with their Trace Search and Analytics feature. With Datadog composite monitor, you can combine individual monitors into one to define more specific alerts.
Their alerting system, "Watchdog" is prompt in alerting and notifying when any metric threshold is breached. With their built-in frameworks and libraries like cURL, Guzzle etc, you can auto-instrument apps and monitor PHP applications. They claim to have over 700+ integrations.
Best PHP Monitoring Strategies:
PHP monitoring is a subset of Application performance monitoring and to implement proper monitoring and management of your application, having an ideal APM strategy is a great choice. Here are some strategies you must definitely keep in mind:
- Don't try to create a whole APM tool just to monitor your single system; use an established tool in the market.
- Ensure your tool monitors important metrics like response time, throughput, error rate, resource utilization, external service calls and database performance.
- Set proper metrics and set thresholds so that you get alerted at the proper time.
- Use APM insights to optimize the performance of your PHP applications.
- Automate as much as possible - integrate APM into your CI/CD pipeline.
Which PHP Monitoring Tool Should you choose?
Effective monitoring of PHP applications is essential for maintaining optimal performance. Here's a clear breakdown by use case:
PHP APM + Full Observability - Choose Atatus
Best for teams that need transaction traces, DB insights, and error tracking in one platform without per-seat pricing. Supports Laravel, WordPress, Symfony, Magento out of the box.
Enterprise / Multi-stack - Choose New Relic / Dynatrace
Suited for large enterprises already invested in a broader observability platform across multiple languages and clouds.
Log Management - Datadog / BetterStack
Best when PHP log ingestion and analysis is the primary need, especially for microservices with high log volumes.
Local Dev / Debugging - XDebug
Free open-source tool for local development. Use alongside an APM for production, not a standalone replacement.
Monitor your PHP app with Atatus - free for 14 days
Full-stack observability. No credit card. Setup in under 10 minutes.
✓ Transaction Traces
✓ DB Query Analysis
✓ Error Tracking
✓ Laravel, WordPress, Symfony
✓ RUM + Logs + Synthetics
Frequently Asked Questions
1) What is the best PHP monitoring tool in 2026?
Atatus is the best PHP monitoring tool for full-stack observability, offering function-level session traces, database query analysis, and error tracking with support for Laravel, WordPress, Symfony, and Magento. For enterprise environments with multi-cloud infrastructure, Dynatrace and New Relic are strong alternatives.
2) How do I monitor PHP application performance?
PHP application performance monitoring involves installing an APM agent (like Atatus) that instruments your application to track response times, throughput, error rates, slow DB queries, and external API calls. The agent runs alongside your application and sends metrics to a dashboard in real time, without changing your application code.
3) What metrics should a PHP monitoring tool track?
A PHP monitoring tool should track: Apdex score and response time, requests per minute (throughput), error rate and exception traces, slow database queries with stack traces, external API latency, memory and CPU usage per request, and deployment markers to correlate code changes with performance changes.
4) Is there a free PHP monitoring tool?
XDebug is a free, open-source PHP debugging and profiling tool suited for local development. For production monitoring, Atatus offers a 14-day free trial with full APM features. New Relic also has a free tier with limited data retention.
5) Does Atatus support PHP frameworks like Laravel and WordPress?
Yes. Atatus supports Laravel, WordPress, Magento, Symfony, CodeIgniter, and other major PHP frameworks. It automatically instruments framework internals, ORM queries, and route-level transactions without requiring manual code changes.
#1 Solution for Logs, Traces & Metrics
 APM
APM
Kubernetes
Logs
Synthetics
RUM
Serverless
Security
More