
Powerful On-Premises Observability: A Complete Guide for Modern Enterprise Applications
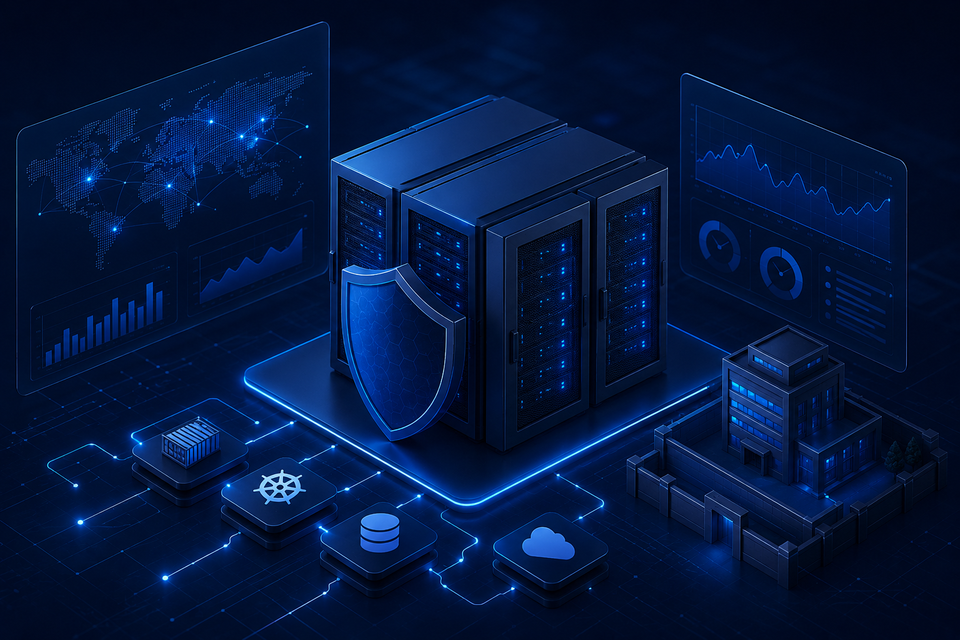
Enterprise applications don't fail quietly anymore. A single checkout flow might touch a dozen microservices, three databases, a message queue, and two external APIs before a customer sees a confirmation screen. When something breaks, the question is never just "what error occurred", it's "which service, which deployment, which trace, and which customer was affected." Cloud-only monitoring tools answer that question well, right up until a compliance officer, a security policy, or an air-gapped production network says the telemetry can't leave the building.
That's the gap on-premises observability fills. It isn't a downgrade from cloud observability for regulated and infrastructure-sensitive enterprises, it's often the only architecture that satisfies both engineering and governance requirements at once. This guide covers what on-premises observability actually is, why enterprises still choose it in 2026, the features that separate a serious platform from a log viewer, and how to evaluate one for your environment.
Table of Contents
- What Is On-Premises Observability?
- Why Enterprises Choose On-Premises Observability Over Cloud Monitoring?
- Common Challenges of On-Premises Observability
- Essential Features of an Enterprise On-Premises Observability Platform
- On-Premises Observability vs Cloud Observability: Key Differences Compared
- Best Practices for Implementing On-Premises Observability
- Common On-Premises Observability Mistakes
- Why Choose Atatus for Enterprise On-Premises Observability?
- How to Evaluate an Enterprise On-Premises Observability Solution
- Key Takeaways: Choosing the Right On-Premises Observability Platform
- Frequently Asked Questions About On-Premises Observability
What Is On-Premises Observability?
On-premises observability is the practice of collecting and correlating the three pillars of telemetry such as metrics, logs, and traces, plus error data on top using a monitoring platform deployed entirely inside infrastructure the organization controls: a private data center, a dedicated private cloud tenancy, or a fully air-gapped network, instead of a vendor's multi-tenant cloud.
How it works?
A lightweight agent or SDK is installed alongside the application (as a language-specific library, sidecar, or daemon). It collects the three core telemetry types continuously: metrics (CPU, memory, latency, throughput), logs (application and system events), and traces (the path a request takes across services) while also intercepting unhandled exceptions and failed requests and attaching context like stack traces, request metadata, and deployment version. All of it is shipped to a self-hosted ingestion layer, not a third-party SaaS endpoint where it's parsed, correlated across signal types, and indexed for search, dashboards, and alerting.
Core components
- Instrumentation agents/SDKs - language-specific libraries (Node.js, Java, Python, Go, .NET, PHP) that capture metrics, logs, traces, and errors at the code level.
- Ingestion and processing layer - receives telemetry, normalizes it across signal types, and applies error grouping and trace correlation logic.
- Storage - time-series, log, and trace storage, typically self-managed (Elasticsearch, ClickHouse, or a vendor-supplied storage engine).
- Alerting engine - evaluates thresholds and anomaly rules across metrics, logs, and error rates, routing notifications to Slack, PagerDuty, or email.
- Dashboards and query UI - the interface engineers use to search logs, inspect traces, chart metrics, and build custom views.
How it differs from cloud monitoring?
Functionally, a mature on-premises platform looks nearly identical to its cloud counterpart from the engineer's seat including same dashboards, same alerting, same root cause views. The difference is entirely about where the data lives and who can access the underlying infrastructure. In a cloud model, the vendor operates the storage and compute; in an on-premises model, your team does, and no request payload, stack trace, or user identifier ever crosses your network boundary.
See the architecture in action
Explore how Atatus deploys error tracking, tracing, and logs entirely inside your network.
Why Enterprises Choose On-Premises Observability Over Cloud Monitoring?
Cloud-first is the default for most engineering teams but a substantial share of enterprises, particularly in regulated industries, deliberately choose on-premises deployment even when it means more operational ownership. The reasons are rarely about resisting the cloud; they're about specific, non-negotiable requirements.
- Data sovereignty and regulatory compliance: Financial services firms under regulations that restrict cross-border data movement, healthcare platforms handling patient records, and government agencies operating under data residency mandates often cannot legally send production telemetry which frequently includes request payloads and user identifiers to a third-party's cloud region.
- Air-gapped and classified environments: Defense contractors, critical infrastructure operators, and some financial trading systems run in networks with no outbound internet path at all. A cloud-only monitoring agent simply cannot phone home in that environment; the entire stack, including storage and alerting, has to run locally.
- Security and internal policy: Some security teams treat "no telemetry leaves the network" as a blanket policy regardless of what a specific regulation requires, because every external data path is a new attack surface and a new vendor to audit.
- Cost control at scale: Cloud observability pricing that scales with hosts, users, or ingested data volume can become unpredictable for enterprises running thousands of services. A flat, self-hosted licensing model turns observability into a fixed line item instead of a variable one tied to traffic spikes.
- Performance and custom integration: Running the monitoring stack on the same network as the application reduces the latency of trace collection and log shipping, and lets platform teams integrate directly with internal service discovery, internal auth (LDAP/SAML/Active Directory), and existing SIEM pipelines.
Common Challenges of On-Premises Observability and Error Monitoring
Choosing on-premises doesn't remove monitoring difficulty, it just shifts where the hard problems live. Teams that run their own infrastructure also own the operational burden of keeping the monitoring stack itself healthy: storage that needs capacity planning, an alerting engine that needs tuning, and an ingestion pipeline that has to keep pace with traffic spikes without dropping data. None of that is optional once error volume grows past a handful of services.
- Limited visibility - without careful instrumentation, self-hosted stacks can end up with blind spots between services that a managed cloud APM would have caught automatically.
- Alert fatigue - threshold-based alerting without grouping or deduplication buries real incidents under noise.
- Fragmented monitoring - logs in one tool, metrics in another, traces in a third, forcing engineers to manually stitch context during an incident.
- Scaling microservices - as service counts grow, error volume and cardinality grow faster, straining self-managed storage.
- Root cause analysis - correlating a spike in errors with the specific deployment, commit, or infrastructure event that caused it takes real tooling, not just log search.
- Hybrid environments - many "on-premises" enterprises still run some workloads in the cloud, and need one platform that covers both without duplicating tools.
- Data silos - different teams standing up their own logging or error tracking creates duplicate infrastructure and inconsistent incident response.
Essential Features of an Enterprise On-Premises Observability Platform
Not every self-hosted log viewer qualifies as enterprise-grade observability. Here's what to look for:
- Real-time error tracking: Errors should surface within seconds of occurring, not minutes with automatic capture of unhandled exceptions and failed requests across every instrumented service.
- Full stack traces: Every error needs a complete, symbolicated stack trace with source context, not just an exception message.
- Distributed tracing: The ability to follow a single request across every service it touches, so an error in a downstream service is visibly connected to the request that triggered it.
- Log correlation: One-click navigation from an error to the exact log lines and trace surrounding it, without a separate search in a separate tool.
- Infrastructure monitoring: CPU, memory, disk, and network metrics correlated with application errors, so a resource spike and an error spike can be viewed side by side.
- Kubernetes monitoring: Pod health, node status, deployment rollouts, and namespace-level metrics for teams running containerized workloads on self-hosted clusters.
- Microservices visibility: Service dependency maps that show which services call which, and where latency or errors are concentrated.
- AI-assisted root cause analysis: Automated correlation of an error spike with the deployment, code change, or infrastructure event most likely responsible, cutting investigation time from hours to minutes.
- OpenTelemetry support: Native OTLP ingestion so teams already standardized on OpenTelemetry instrumentation aren't locked into a proprietary agent.
- Custom dashboards: Configurable views per team, service, or SLA, rather than one fixed dashboard for the whole organization.
- Intelligent alerting: Threshold, anomaly, and rate-of-change based alerts routed to the tools teams already use like Slack, PagerDuty, Microsoft Teams, webhooks.
- Error grouping: Automatic deduplication of the same underlying error across thousands of occurrences, so an incident shows up as one item, not ten thousand.
- Deployment tracking: Errors tagged with release version, so a spike right after a deploy is immediately traceable to that release.
- Performance analytics: Latency percentiles, throughput, and apdex-style scoring alongside error data, not in a separate APM product.
On-Premises Observability vs Cloud Observability: Key Differences Compared
| Dimension | On-Premises | Cloud |
|---|---|---|
| Deployment | Inside your data center, private cloud, or air-gapped network | Vendor-managed multi-tenant SaaS |
| Security | Full control over network boundary and access | Shared responsibility with vendor |
| Compliance | Easier to align with data residency and sector-specific mandates | Depends on vendor's regional hosting and certifications |
| Maintenance | Owned by your platform team (upgrades, scaling, patching) | Fully managed by the vendor |
| Scalability | Bounded by your provisioned infrastructure | Elastic, vendor-managed scaling |
| Cost model | Typically flat/annual licensing, infrastructure cost separate | Usage-based: per host, per user, or per GB ingested |
| Performance | Lower network latency to local applications | Depends on region and network path to vendor |
| Data ownership | 100% retained inside your perimeter | Held by the vendor under contract terms |
| Flexibility | Custom integrations with internal auth/SIEM | Standard integrations via vendor marketplace |
| Best fit | Regulated, air-gapped, or data-sovereignty-bound teams | Teams prioritizing speed of setup and zero ops overhead |
Architecture of an Enterprise Observability Platform
End-to-end, telemetry moves through a consistent pipeline regardless of deployment model:
Application code
   → Agent/SDK (captures errors, traces, metrics)
     → Local telemetry collector (batches, compresses)
       → Ingestion layer (parses, deduplicates, groups errors)
         → Storage (logs, traces, metrics - self-hosted)
           → Alert engine (thresholds, anomaly detection)
           → Dashboards & root cause analysis UI
In a self-hosted deployment, every stage in that pipeline including storage and the alerting engine, runs on infrastructure you control. That's the structural difference from cloud APM: there's no stage where data has to leave the network to be processed or displayed.
Best Practices for Implementing On-Premises Observability
- Adopt OpenTelemetry early so instrumentation isn't locked to one vendor's agent format.
- Group errors by root cause, not by raw message string, to avoid the same bug appearing as hundreds of separate alerts.
- Tag every error with release/deployment version so regressions are traceable to a specific change.
- Use intelligent, not just threshold-based, alerting - rate-of-change and anomaly detection catch issues static thresholds miss.
- Monitor against SLOs, not just raw error counts, so alerts reflect actual user impact.
- Map service dependencies so on-call engineers know what's downstream before they start debugging.
- Treat observability maturity as a roadmap - start with error tracking, add tracing, then infrastructure correlation, then AI-assisted RCA.
Common On-Premises Observability Mistakes (And How to Avoid Them)
| Mistake | Why it hurts | Fix |
|---|---|---|
| Monitoring only logs | Logs alone don't show request flow across services | Add distributed tracing alongside logs |
| Ignoring traces | Root cause analysis becomes guesswork | Instrument end-to-end tracing from day one |
| Alert overload | Real incidents get lost in noise | Group errors and use anomaly-based alerting |
| No clear ownership | Alerts fire but no one acts on them | Route alerts to the owning team, not a shared inbox |
| Lack of context | Engineers can't reproduce or diagnose the issue | Capture request metadata, user session, and stack trace together |
| Poor instrumentation | Errors go uncaptured entirely | Instrument at the framework level, not just top-level handlers |
| Missing performance monitoring | Slow requests get treated as "working" | Track latency percentiles alongside error rate |
Why Choose Atatus for Enterprise On-Premises Observability?
Atatus brings unified observability such asmetrics, logs, distributed tracing, error tracking, infrastructure and Kubernetes visibility, and AI-assisted troubleshooting into a single platform, deployable entirely inside your own infrastructure. Instead of stitching together a self-hosted log tool, a separate tracing tool, and a third product for infrastructure metrics, teams get one pipeline and one dashboard for all of it, with native OpenTelemetry support so existing instrumentation carries over.
For enterprises specifically, that means SAML/LDAP/Active Directory integration for access control, audit logging, TLS-encrypted internal agent communication, and support for HIPAA-aligned and GDPR-aligned deployments on a SOC 2 Type II and ISO 27001-certified platform, deployed in your data center, private cloud, or a fully air-gapped network with zero external data transfer. Licensing is a fixed annual contract rather than per-user or per-GB pricing, which keeps costs predictable as service counts and data volume grow.
How to Evaluate an Enterprise On-Premises Observability Solution?
Feature checklists matter, but they aren't the first filter. Before comparing dashboards, confirm the fundamentals a feature list won't tell you:
- Deployment model - can it run fully air-gapped, or does it silently phone home for licensing checks, updates, or telemetry of its own?
- Data path - does every stage, including storage and alerting, stay inside your network, or does the vendor route some processing through their cloud?
- Licensing terms - flat annual contract versus per-host or per-GB pricing changes the total cost of ownership significantly as you scale.
- Upgrade and patch cadence - self-hosted software still needs security patches; ask how upgrades are shipped and how much downtime they require.
- Support model - enterprise support SLAs matter more on-premises, since your team, not the vendor, is operating the infrastructure day to day.
Only after those questions are answered does it make sense to compare tracing depth, alerting sophistication, and AI-assisted root cause analysis feature by feature.
Ready to see it running on your infrastructure?
Talk to the Atatus enterprise team about a self-hosted deployment scoped to your compliance requirements.
Key Takeaways: Choosing the Right On-Premises Observability Platform
- On-premises observability keeps every stage of the telemetry pipeline including metrics, logs, traces, agent, ingestion, storage, alerting inside infrastructure you control.
- Enterprises choose it primarily for data sovereignty, regulatory compliance, air-gapped operation, and cost predictability, not because cloud monitoring is inferior.
- A serious platform matches cloud-grade features such as distributed tracing, error grouping, AI-assisted root cause analysis, OpenTelemetry support with self-hosted deployment.
- Common failure modes (alert fatigue, fragmented tooling, missing traces) apply just as much on-premises as in the cloud, and need the same fixes: grouping, correlation, and clear ownership.
- Evaluate on-premises platforms on architecture and compliance alignment first, feature checklist second.
Frequently Asked Questions
1) Can on-premises observability work in a fully air-gapped environment?
Yes, provided the platform's ingestion, storage, and alerting components can all run without an outbound internet path. This is a hard requirement for defense, classified, and some financial trading environments.
2) Can one platform monitor both on-premises and cloud workloads?
Yes, hybrid enterprises commonly run a single self-hosted observability platform that ingests telemetry from both on-premises data centers and cloud workloads, avoiding duplicate tooling.
3) Does on-premises observability support OpenTelemetry?
Platforms built for enterprise use typically support native OTLP ingestion, so teams already instrumented with OpenTelemetry don't need to switch agents.
4) What compliance standards does on-premises deployment help satisfy?
Common alignments include HIPAA for healthcare, GDPR data residency for EU operations, and PCI-DSS scoping for payment systems, since telemetry never leaves the organization's network perimeter.
Conclusion
On-premises observability isn't a compromise enterprises accept when the cloud isn't available for regulated, air-gapped, and cost-sensitive organizations, it's the architecture that lets engineering and compliance requirements coexist. The bar for evaluating a platform hasn't lowered because it's self-hosted: it still needs real metrics, logs, and distributed tracing working together, intelligent error grouping, OpenTelemetry compatibility, and AI-assisted root cause analysis, deployed on infrastructure you fully control.
If your team is weighing self-hosted observability against another year of unpredictable cloud APM bills or your compliance team has already made the decision for you, see how Atatus deploys on-premises without giving up the features a modern engineering team depends on.
Observability without compromising data security.
See how Atatus keeps all telemetry inside your infrastructure
#1 Solution for Logs, Traces & Metrics
 APM
APM
Kubernetes
Logs
Synthetics
RUM
Serverless
Security
More

![New Relic vs Splunk - In-depth Comparison [2026]](/blog/content/images/size/w960/2024/10/Datadog-vs-sentry--19-.png)
![New Relic vs Sentry - Which Monitoring Tool to Choose? [2026]](/blog/content/images/size/w960/2024/10/VS--1-.png)