Distributed Tracing
Collects and aggregates trace data from various endpoints to provide a comprehensive view of request flows from frontend devices to backend services and databases, including detailed timing information, service dependencies, and contextual logs.
Common Challenges You Face
Real problems experienced by teams like yours every day
Can't Find Where Requests Are Slowing Down
"Requests touch 10+ microservices. We see the total latency but have no idea which service is causing the bottleneck."
Errors Propagate Across Services
"An error shows up in Service E, but the root cause is actually in Service A. We waste hours debugging the wrong service."
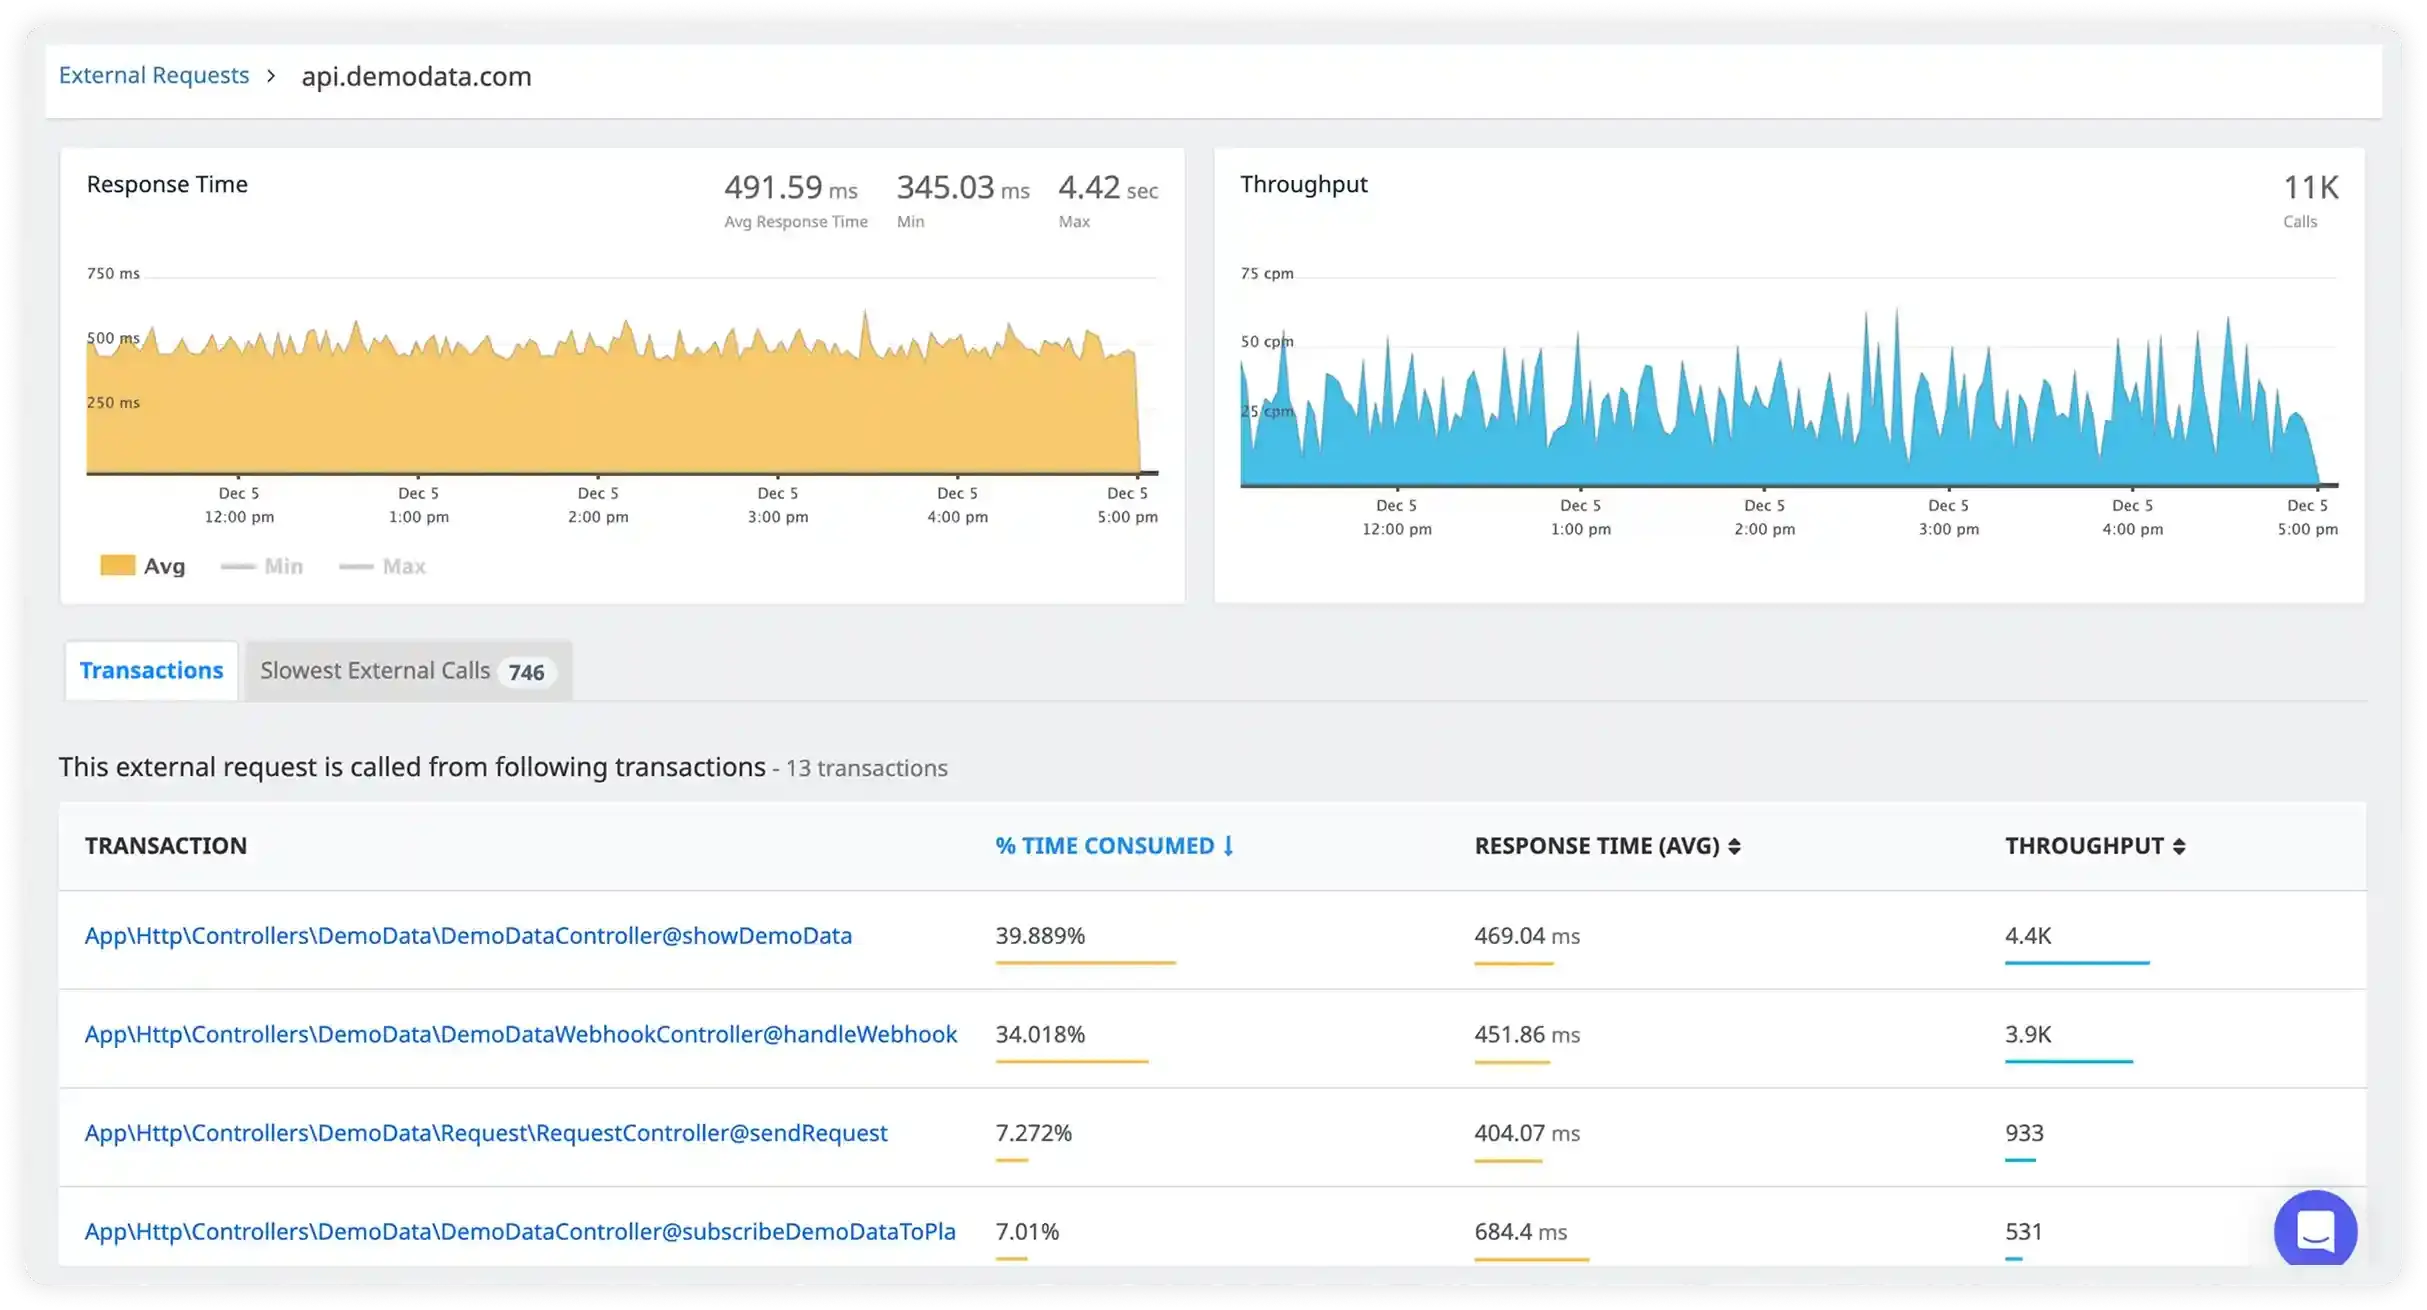
Database Queries Hidden in Black Box
"We know a service is slow, but we can't see which database queries, external APIs, or internal calls are causing the delay."
Can't Debug Customer-Specific Issues
"Customer reports slow performance, but we can't trace their specific request through the system to see what went wrong."
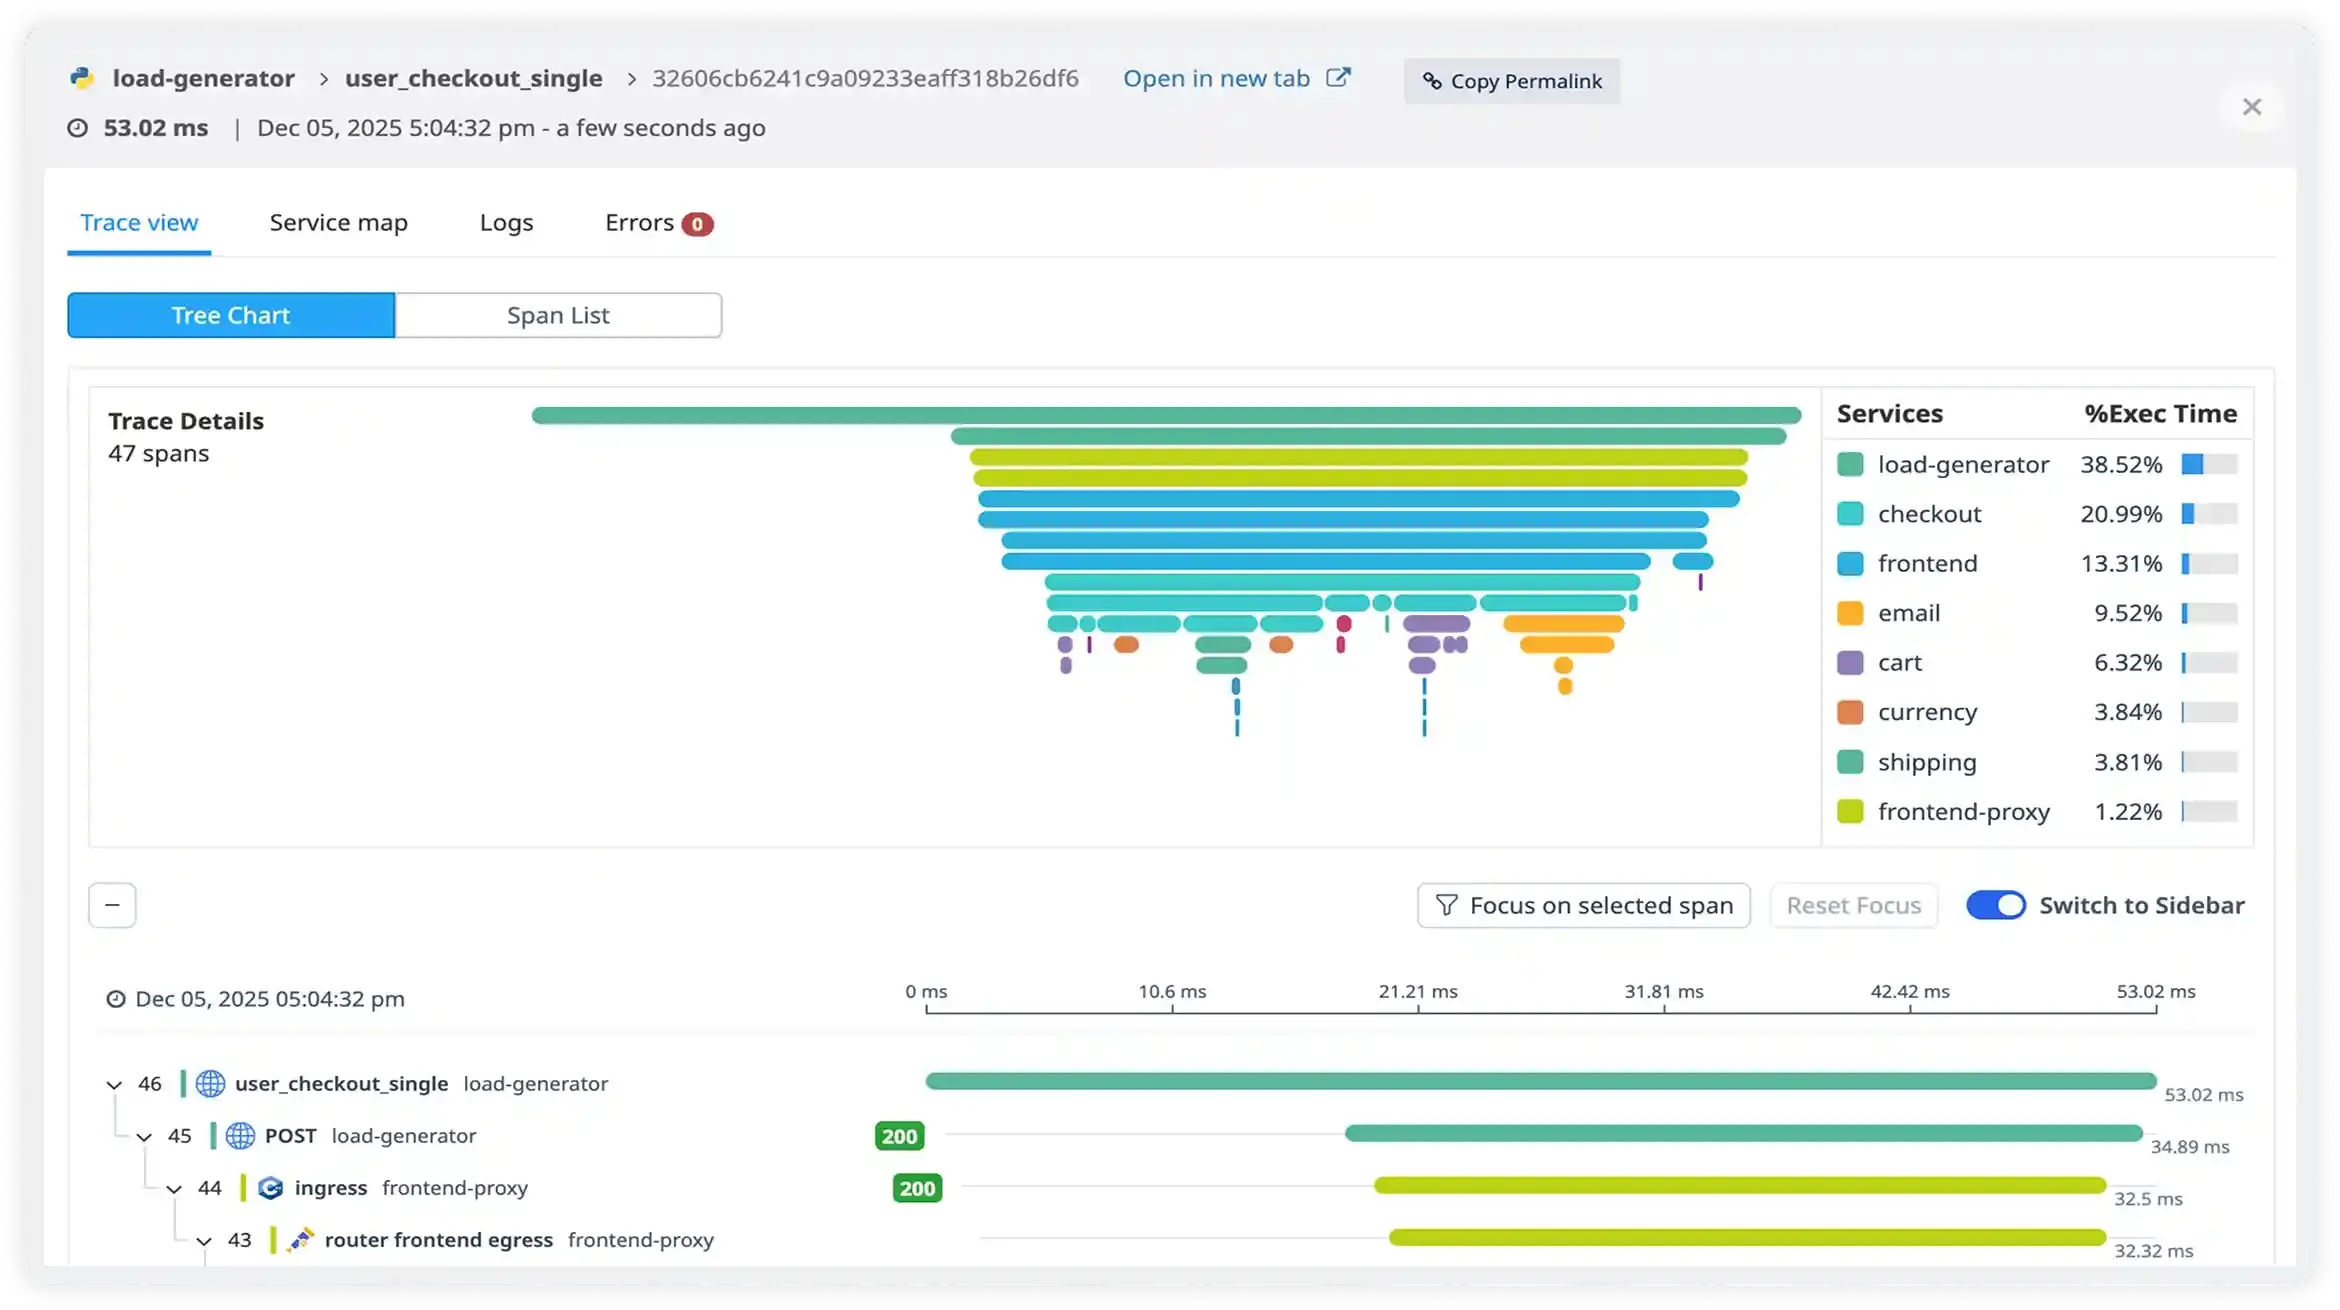
End-to-End Visibility
- Trace every request across your full stack (frontend → backend → database → third-party APIs) to understand the complete execution path instead of debugging isolated failures.
- Visualize full dependency flow to instantly identify which service, function, or external dependency is slowing down the transaction.
- Aggregate trace intelligence at scale to uncover patterns like frequently failing endpoints, slow database queries, overloaded microservices, or unstable external calls.
- Proactively alert on business-critical transactions such as checkout latency spikes, payment failures, login errors, or cart API downtime before they impact revenue.
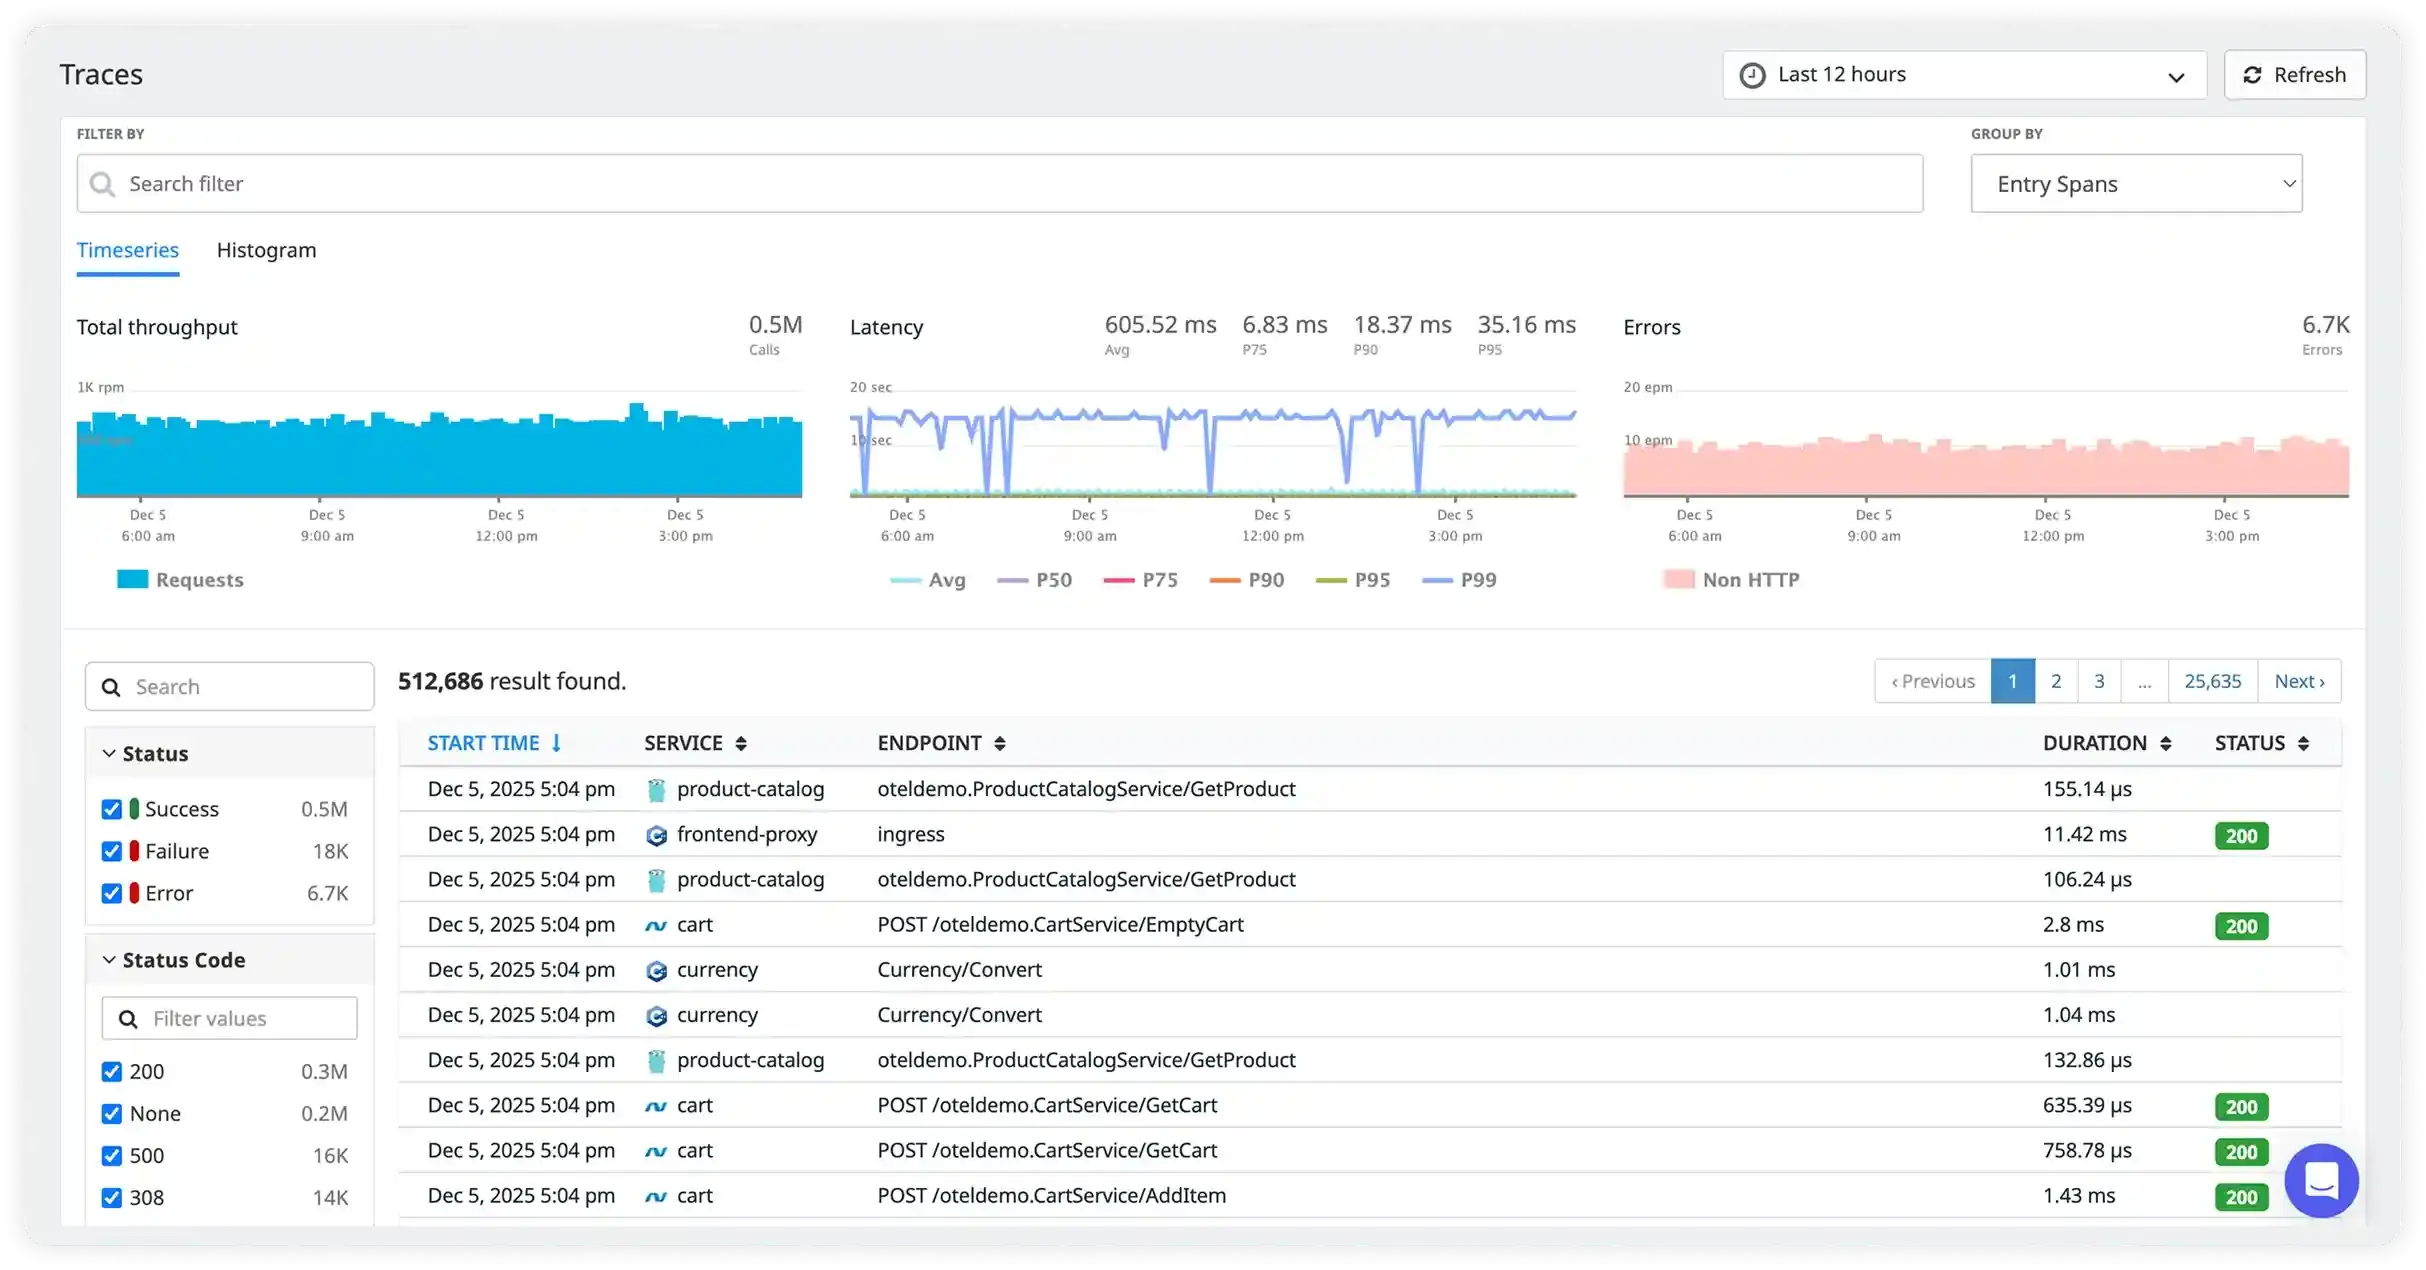
Trace Search & Analysis
- Analyze millions of traces in real time to detect system-wide anomalies, performance drifts, and hidden latency bottlenecks without waiting for incidents.
- Search and filter traces instantly using powerful dimensions like endpoint, service name, region, user ID, customer segment, environment, or custom tags.
- Group and compare traces across segments to identify recurring issues affecting specific regions, deployments, high-value customers, or certain API versions.
- Trigger actionable alerts from trace analytics such as P95/P99 latency breaches, sudden error rate spikes, abnormal response size, or unusual dependency delays in critical request paths.
Service-Level Insights
- Track service health metrics in one view including latency, throughput, error rates, and request volume to understand real production performance.
- Pinpoint which service is causing slowdowns by correlating traces with service-level performance trends, reducing guesswork during incident triage.
- Compare versions and deployments to quickly detect regressions after releases and identify which code changes introduced latency or failures.
- Set service-level alerts and thresholds for underperforming services, increasing error percentages, abnormal traffic surges, or degraded response times before user experience drops.
Intelligent Trace Management
- Control trace sampling and ingestion intelligently to reduce noise and costs while still capturing high-value transactions and critical errors.
- Customize retention policies so important traces (payment, checkout, login, API gateway) stay longer while low-impact traces are stored efficiently.
- Enrich traces with metadata and tags like tenant ID, customer plan, region, request type, deployment version, and feature flag to speed up debugging.
- Create alerts based on trace intelligence such as endpoint-level P95 latency breaches, error rate exceeding 1%, dependency timeout patterns, or abnormal failure trends in payment and checkout flows.
How Atatus Transforms Your Operations
Measurable improvements across your DevOps workflows and business metrics
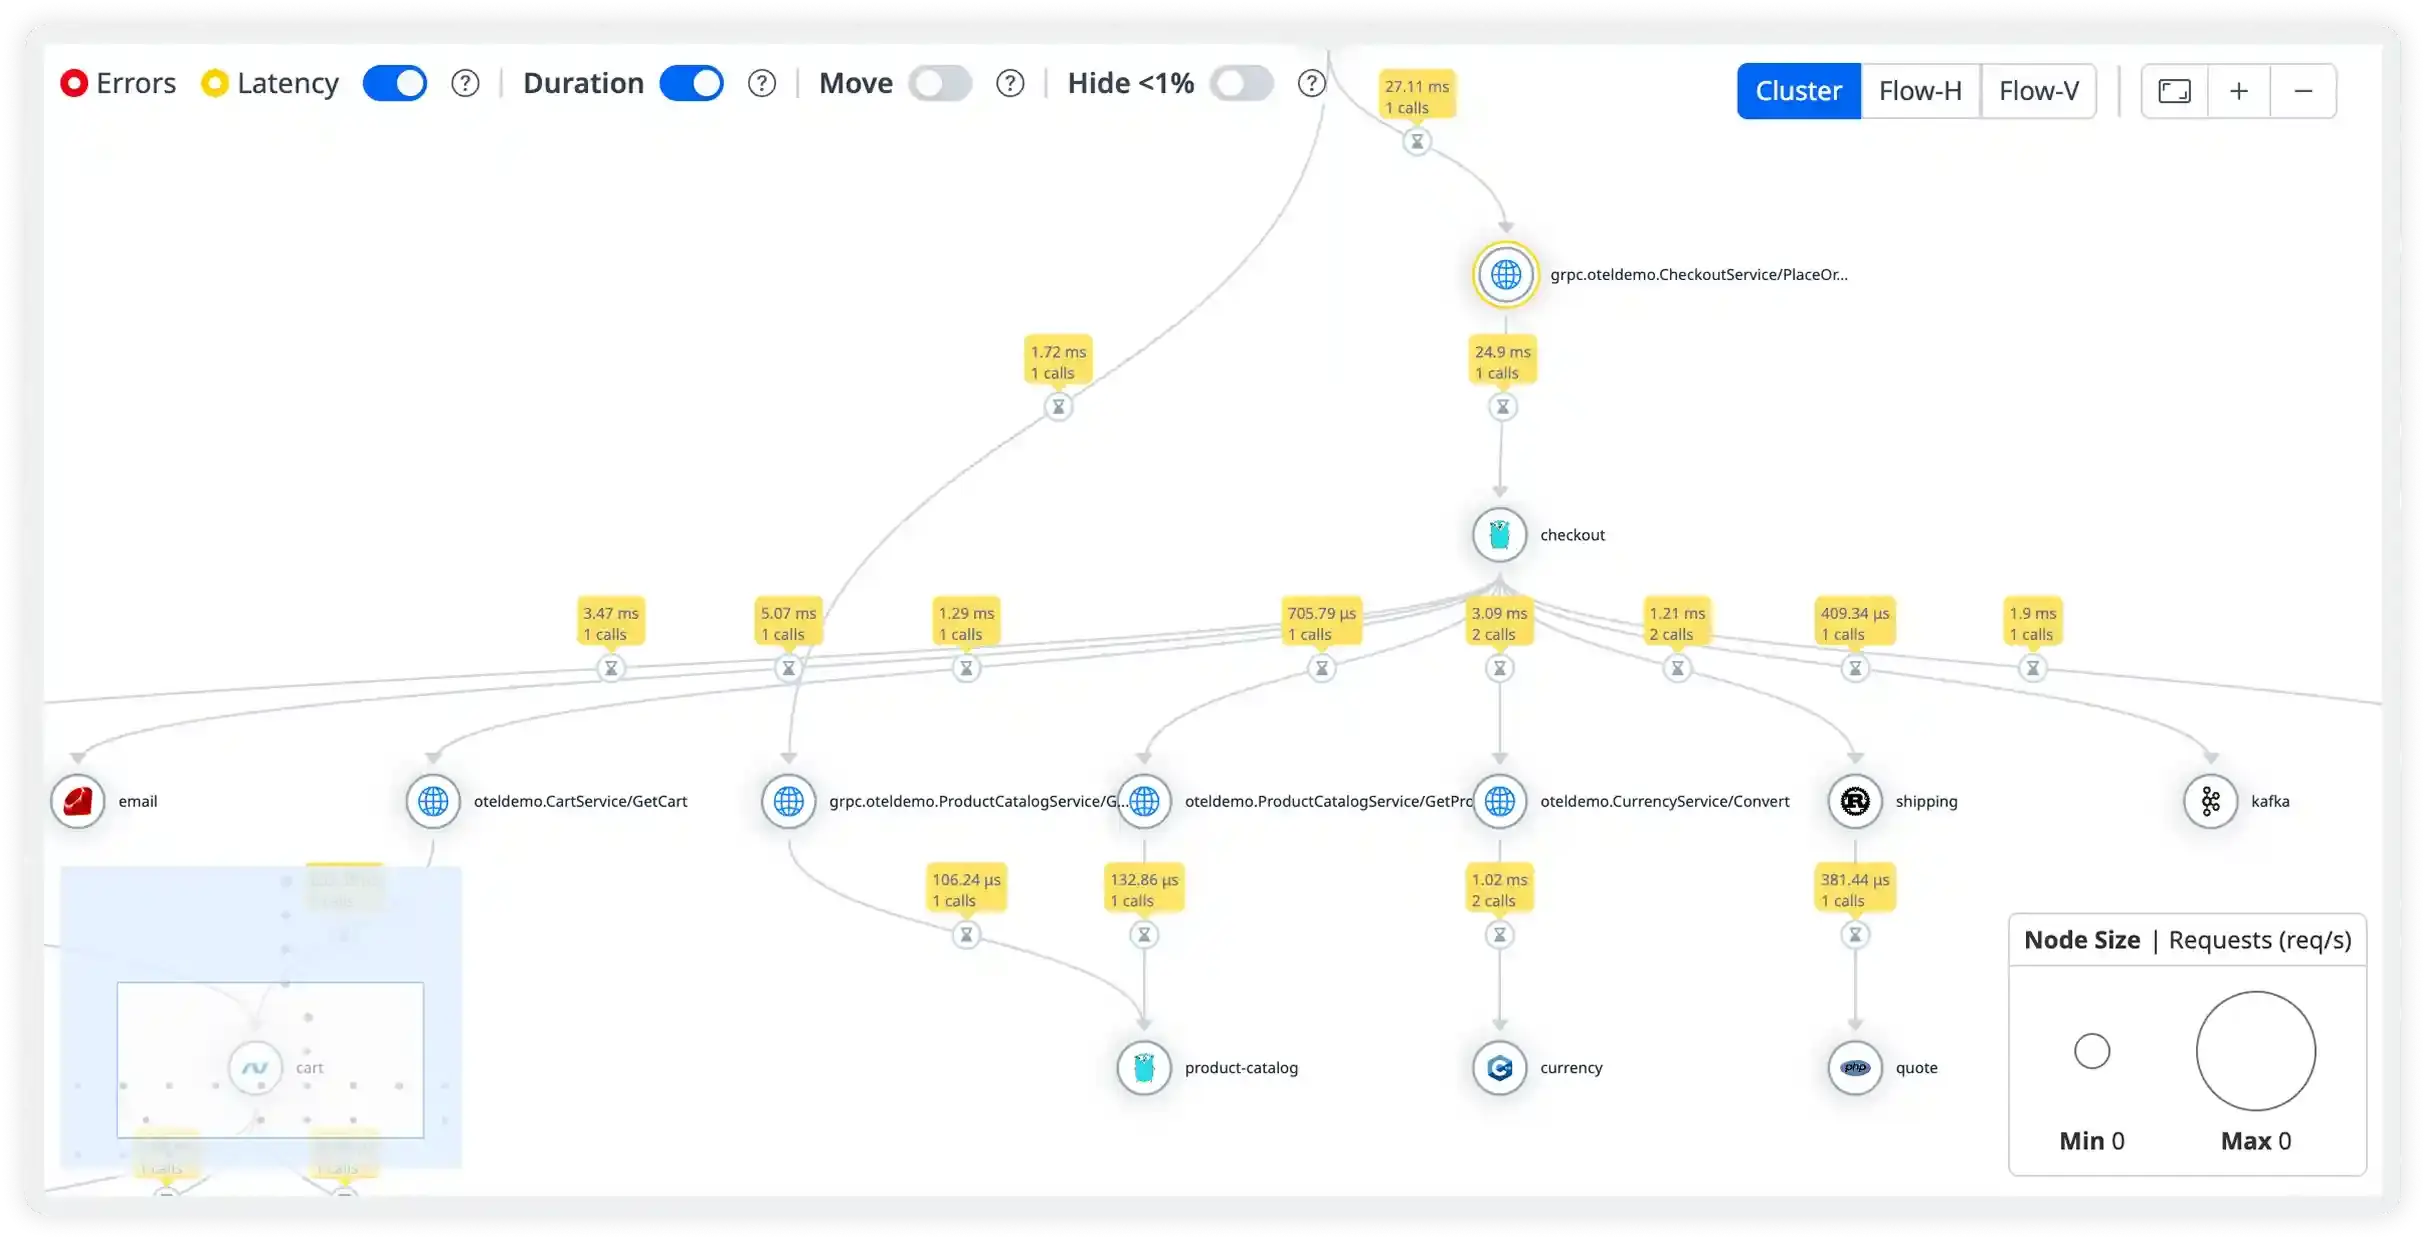
Find Slow Services in Seconds, Not Hours
90% faster root cause analysisVisual service maps show request flow with latency breakdown for each hop in the chain.
DevOps Impact
Instantly identify which service, database query, or external API is causing slowness
Business Impact
Resolve performance issues 10x faster, improving customer experience
Track Errors to Their Origin
70% reduction in MTTRSee where errors started and how they propagated through your service mesh with full stack traces.
DevOps Impact
No more debugging the wrong service - trace shows exact error origin
Business Impact
Fix bugs faster and prevent cascading failures
Debug Individual User Requests
Customer issue resolution 5x fasterSearch for specific user requests and see the complete journey through all services with timing and errors.
DevOps Impact
Reproduce customer issues with exact request flow and timing data
Business Impact
Resolve customer complaints faster with precise debugging data
Unified Observability for Every Engineering Team
Atatus adapts to how engineering teams work across development, operations, and reliability.
Developers
Trace requests, debug errors, and identify performance issues at the code level with clear context.
DevOps
Track deployments, monitor infrastructure impact, and understand how releases affect application stability.
Release Engineer
Measure service health, latency, and error rates to maintain reliability and reduce production risk.
Milestones that spark performance excellence
Reflections from clients who've achieved unmatched excellence through innovative strategies.
Read customer stories


