AI-Powered Dashboards That Unify Your Entire Observability Stack
Describe a dashboard in plain words and Atatus builds the widgets, or start from a ready-made dashboard. Logs, metrics, traces and infrastructure on one screen.
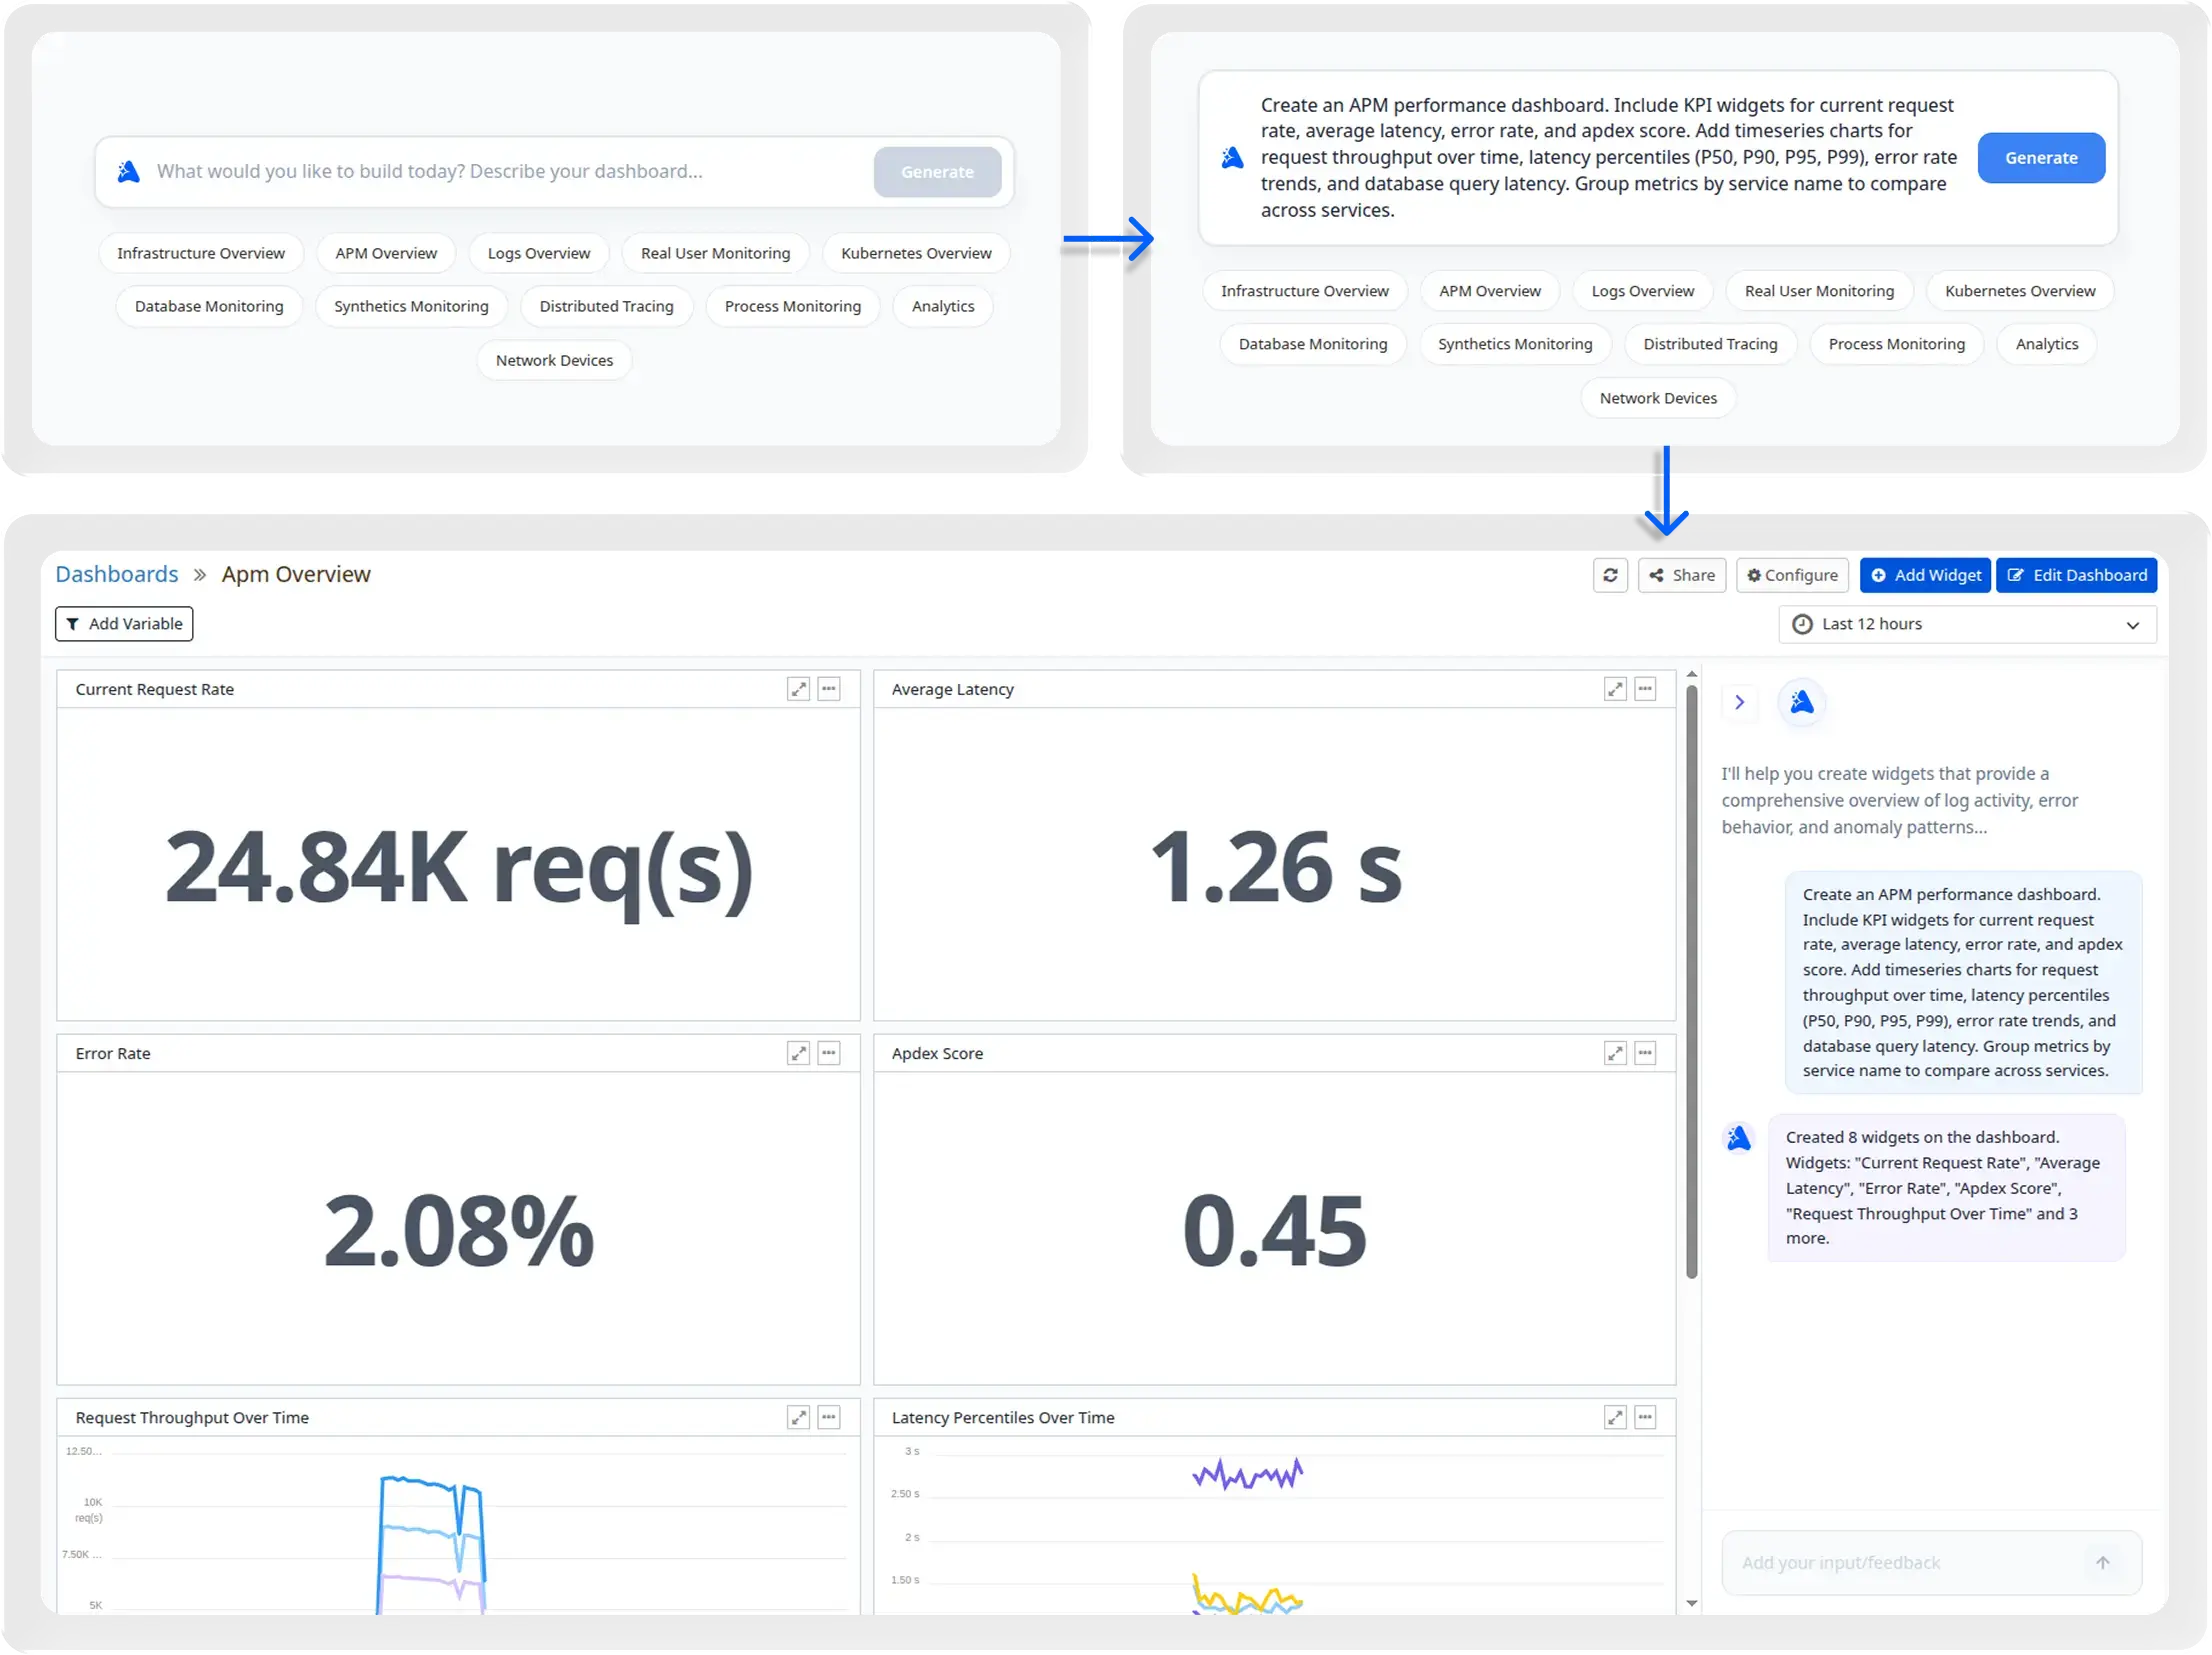
Say what you need. Get the dashboard.
Pick a starter or describe a dashboard. AI builds the widgets, then you refine it in chat.
Create an APM performance dashboard. Include KPI widgets for current request rate, average latency, error rate, and apdex score. Add timeseries charts for request throughput, latency percentiles (P50, P90, P95, P99), error rate trends, and database query latency.
Sample data
Same data. Any view.
Open a widget's editor and switch how it draws: number, line, area, bar or pie.
- app-prod-1 48%
- app-prod-2 32%
- app-prod-3 20%
One dashboard. Every service.
Set the variables once. Every widget follows them.
$service = checkout-service · $env = production2.11K rpm$service = checkout-service · $env = production434 ms$service = checkout-service · $env = production0.54%Sample data · last 15 min · change a variable and every widget re-queries
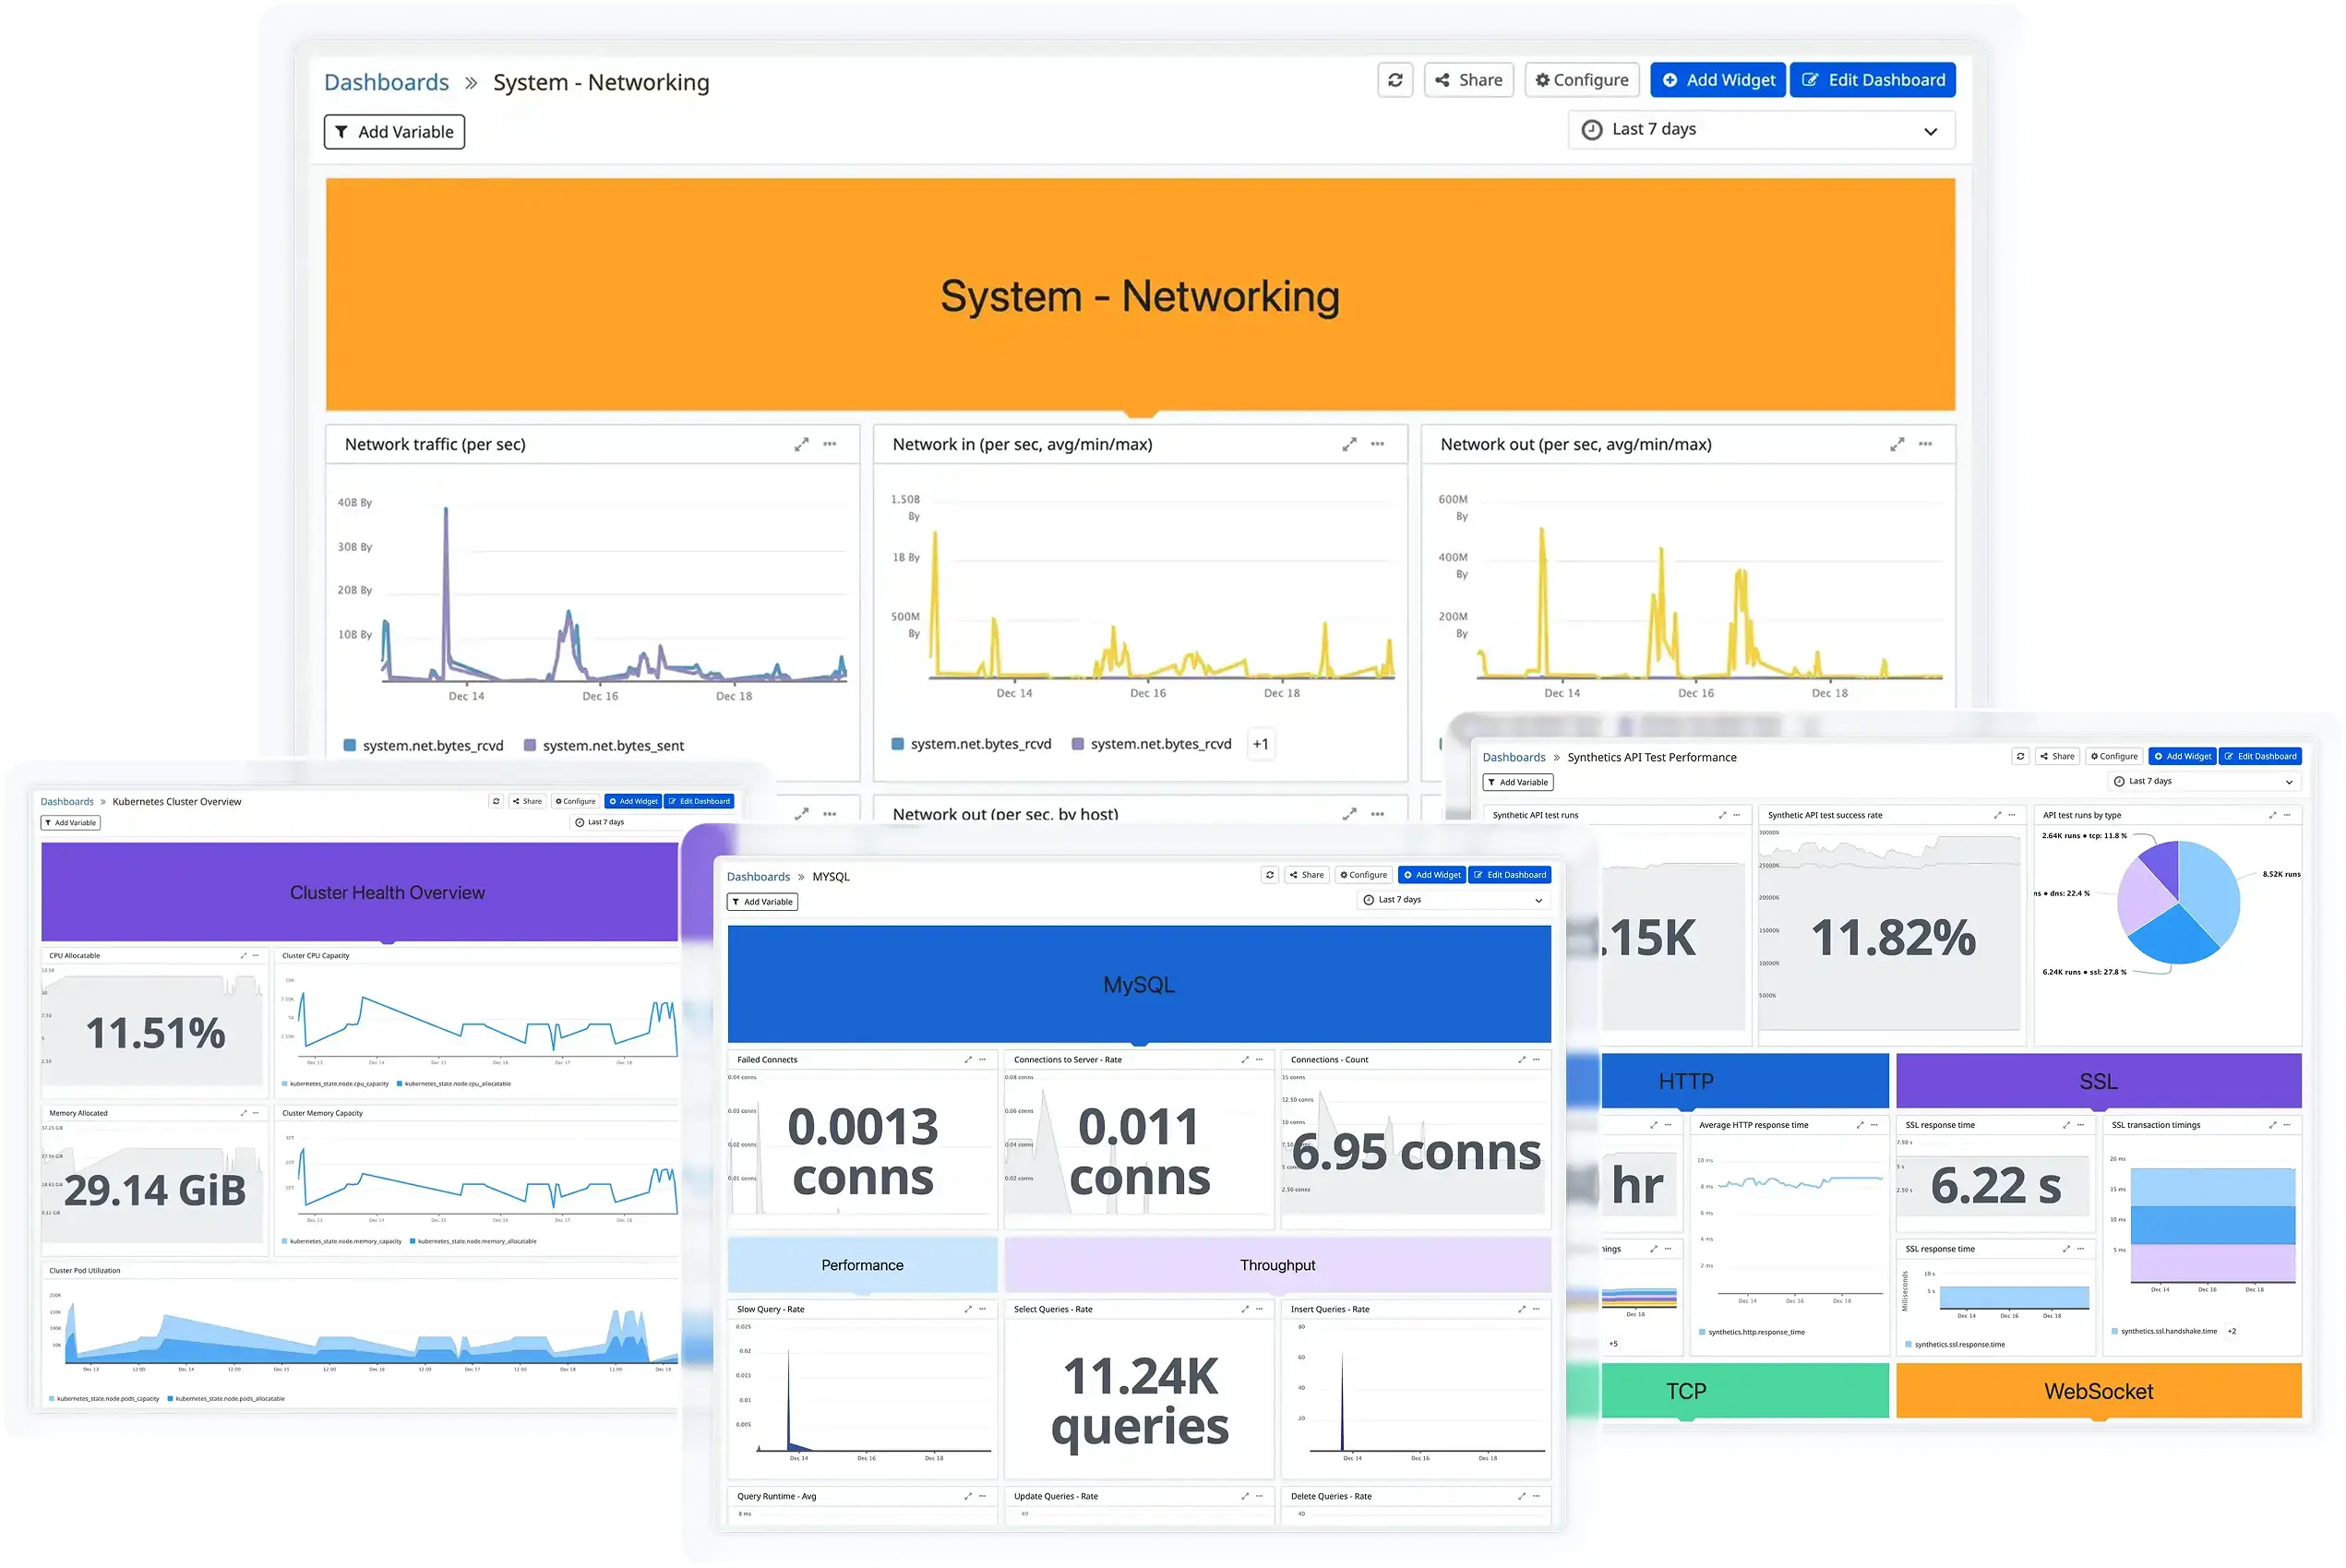
Dashboards, screen by screen.
Real screens from the Atatus app.
Questions about dashboards
Pricing, deployment, data and the agent. If something is missing, a person will answer it on a demo call.
Atatus dashboards sit on the same platform as your APM, logs, infrastructure, Kubernetes, database, synthetics and network data, so one dashboard can mix all of them. You can describe a dashboard in plain words and let AI build the widgets, or start from a ready-made one. Pricing has no per-user fees.
Type what you want in the prompt box, or pick a starter such as APM Overview, Kubernetes Overview, Logs Overview or Database Monitoring, and press Generate. The AI assistant creates the widgets and lists what it added. Keep chatting with it to change or add widgets, or edit the dashboard yourself.
Yes. The ready-made Kubernetes Cluster Overview dashboard shows CPU allocatable, memory allocated, cluster CPU and memory capacity, and cluster pod utilization. You can also ask the AI assistant for a Kubernetes dashboard or add Kubernetes widgets to any dashboard.
Yes. Add widgets, edit the dashboard, add variables so one dashboard can switch between services, pick the time range, and share it with your team. Widgets can show a single number, a time series, an area chart, bars or a pie.
Atatus agents for Node.js, Python, Java, Go, Ruby, .NET and PHP, OpenTelemetry, browser and mobile monitoring, the infrastructure agent, StatsD and log shippers such as Fluent Bit. Data from any of them can be charted on a dashboard.
Ready-made dashboards include Kubernetes Cluster Overview, MySQL, System - Networking and Synthetics API Test Performance. The AI builder also has starters for infrastructure, APM, logs, real user monitoring, Kubernetes, databases, synthetics, distributed tracing, processes, analytics and network devices.