A Beginner's Guide to OpenTelemetry
OpenTelemetry (OTel) is an open-source observability framework that provides a standardized way of collecting, processing, and exporting telemetry data (metrics, traces, and logs) from distributed systems.
It was born by a merger between two previously separate observability projects, OpenCensus and OpenTracing, and it is currently maintained by the Cloud Native Computing Foundation (CNCF).
It is designed to be vendor-agnostic and language-agnostic, meaning that it can be used with various programming languages, frameworks, and third-party telemetry solutions.
OpenTelemetry consists of a set of APIs, SDKs, and integrations that allow developers to instrument their applications and collect telemetry data. The APIs provide a common interface for instrumenting different types of telemetry data, while the SDKs provide the implementation of the APIs for specific languages and frameworks. The integrations enable the export of telemetry data to various backends, such as Prometheus, Jaeger, and Zipkin.
OpenTelemetry is continuously evolving and improving, with a strong community of contributors and a roadmap that includes support for new languages and frameworks, as well as integration with cloud-native platforms. Let’s look at it in more detail!
Table Of Contents
- Opentelemetry Components
- OTLP Protocols
- How does Opentelemetry work?
- Implementing Opentelemetry for your stack
- Choosing Instrumentation Type
- Benefits of Opentelemetry
OpenTelemetry Components
In the previous paragraph, we saw how APIs, SDKs, and integrations were prominent components of OpenTelemetry workflow. Here we will take a look at how these, along with collector and OTLP make up the entire telemetry pipeline work!
#1 APIs
OpenTelemtry provides a singular API and SDK format for all programs. This standard API ensures that you don't need to make changes in the codes while moving from one SDK to another SDK implementation.
The APIs can be further separated into four parts:
- Tracer API
- Metric API
- Context API
- Semantic conventions
The Tracing API provides a way to create and manage distributed traces in applications. It defines interfaces for creating spans, adding attributes and events to spans, and propagating context across distributed systems.
The Metrics API provides a way to collect and report metrics in applications. It defines interfaces for creating and updating counters, gauges, and histograms, and for reporting them to the backend. For example, you’d use Observers to "observe" values that aren't taking place in the context of a Span, such as the current CPU load or the total number of bytes free on a disk and counters to count things.
The Context API provides a way to manage context across distributed systems. It defines interfaces for creating and propagating context across application boundaries, allowing developers to trace requests across different services.
Semantic conventions include the general guidelines for naming spans and attributes, attributing errors to spans, etc. This way, it conserves the information shared across different sets of languages and codes.
#2 SDKs
The SDKs include libraries that developers can use to instrument their applications and collect telemetry data. The SDKs also provide exporters for sending telemetry data to different backends.
SDK can also be segmented into three distinct layers - tracer pipeline, meter pipeline, and context pipeline.
SpanProcessors process the spans throughout its lifecycle and exports it to the SpanExporter. Instead of exporting spans one by one, batching implementation exports a set of finished spans to the SpanExporter from where it ends up in the backend processing.
To deal with the metrics, we first need to aggregate the specific data with default aggregate meant for them. Vendors can decide the type of telemetry they need for the backend and subsequently aggregate data on that respect. Thereafter, they will be transported to MetricExporter.
Side note: Exporters can be either push-type or pull-type. Push-type exports are once which are being transferred to the backend on specified time intervals while pull-type exports are where the backend queries for data after which only the data will be transferred.
#3 Collector
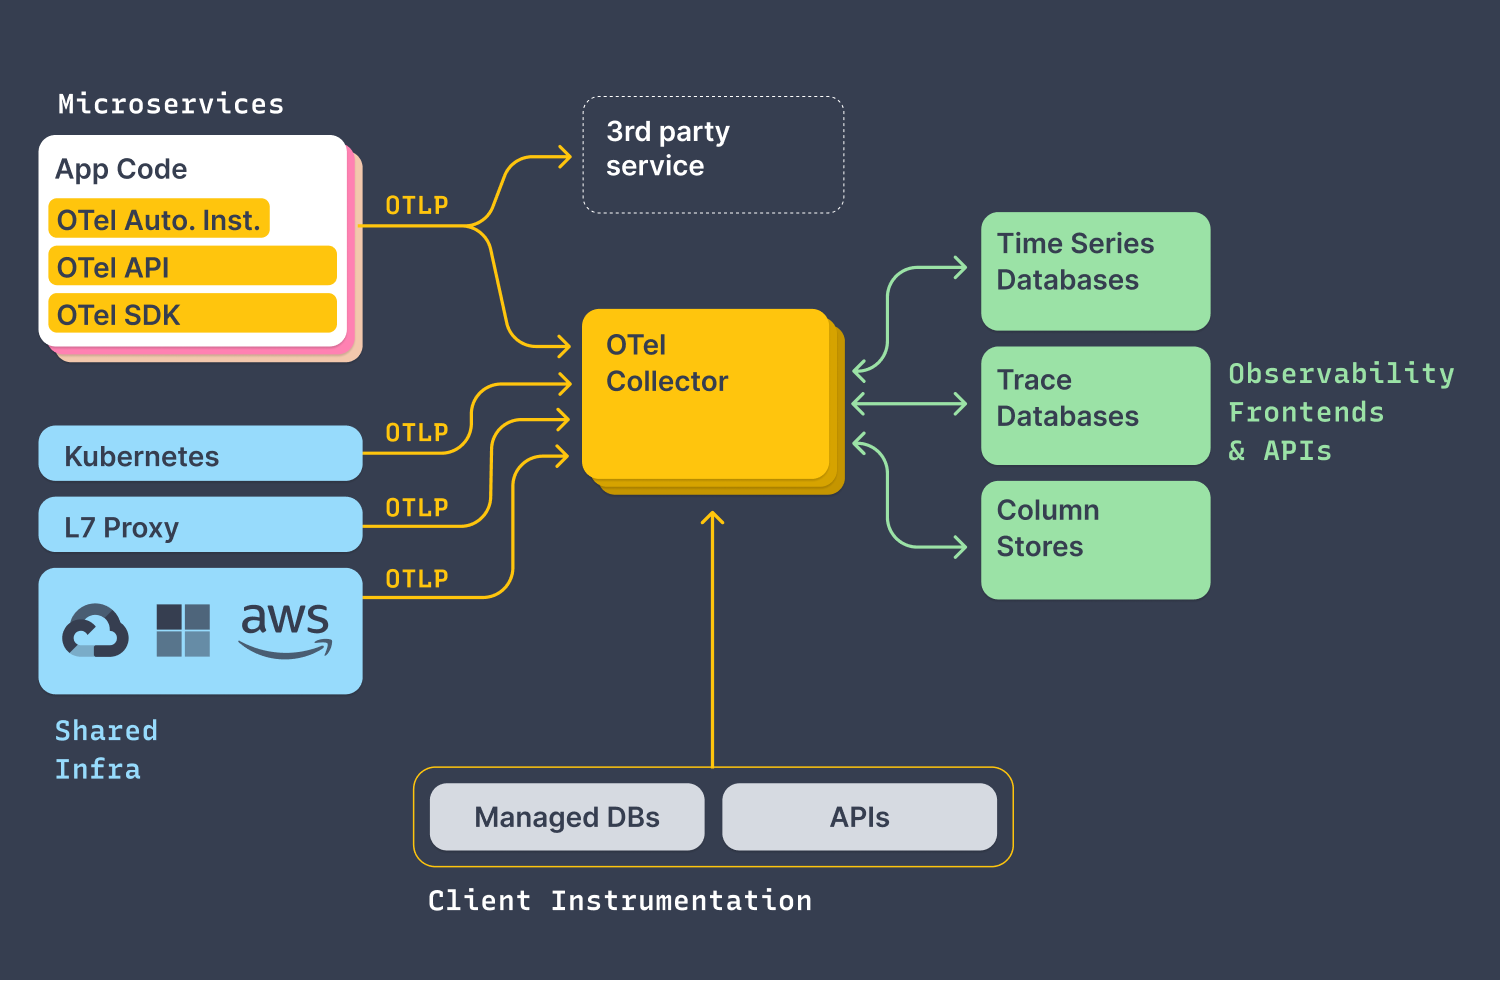
OpenTelemetry collectors receive telemetry data from instrumented applications and forward it to exporters. Collectors provide a central point for processing and filtering telemetry data before it is sent to the backend.
It utilizes a tail-based sampling of spans and exports the collected data to external vendors and other openTelemetry interfaces.
#4 Exporter
OpenTelemetry provides exporters for sending telemetry data to various backends, such as Prometheus, Jaeger, and Zipkin. These exporters allow developers to use their preferred telemetry solution without having to modify their application code.
OTLP Protocols
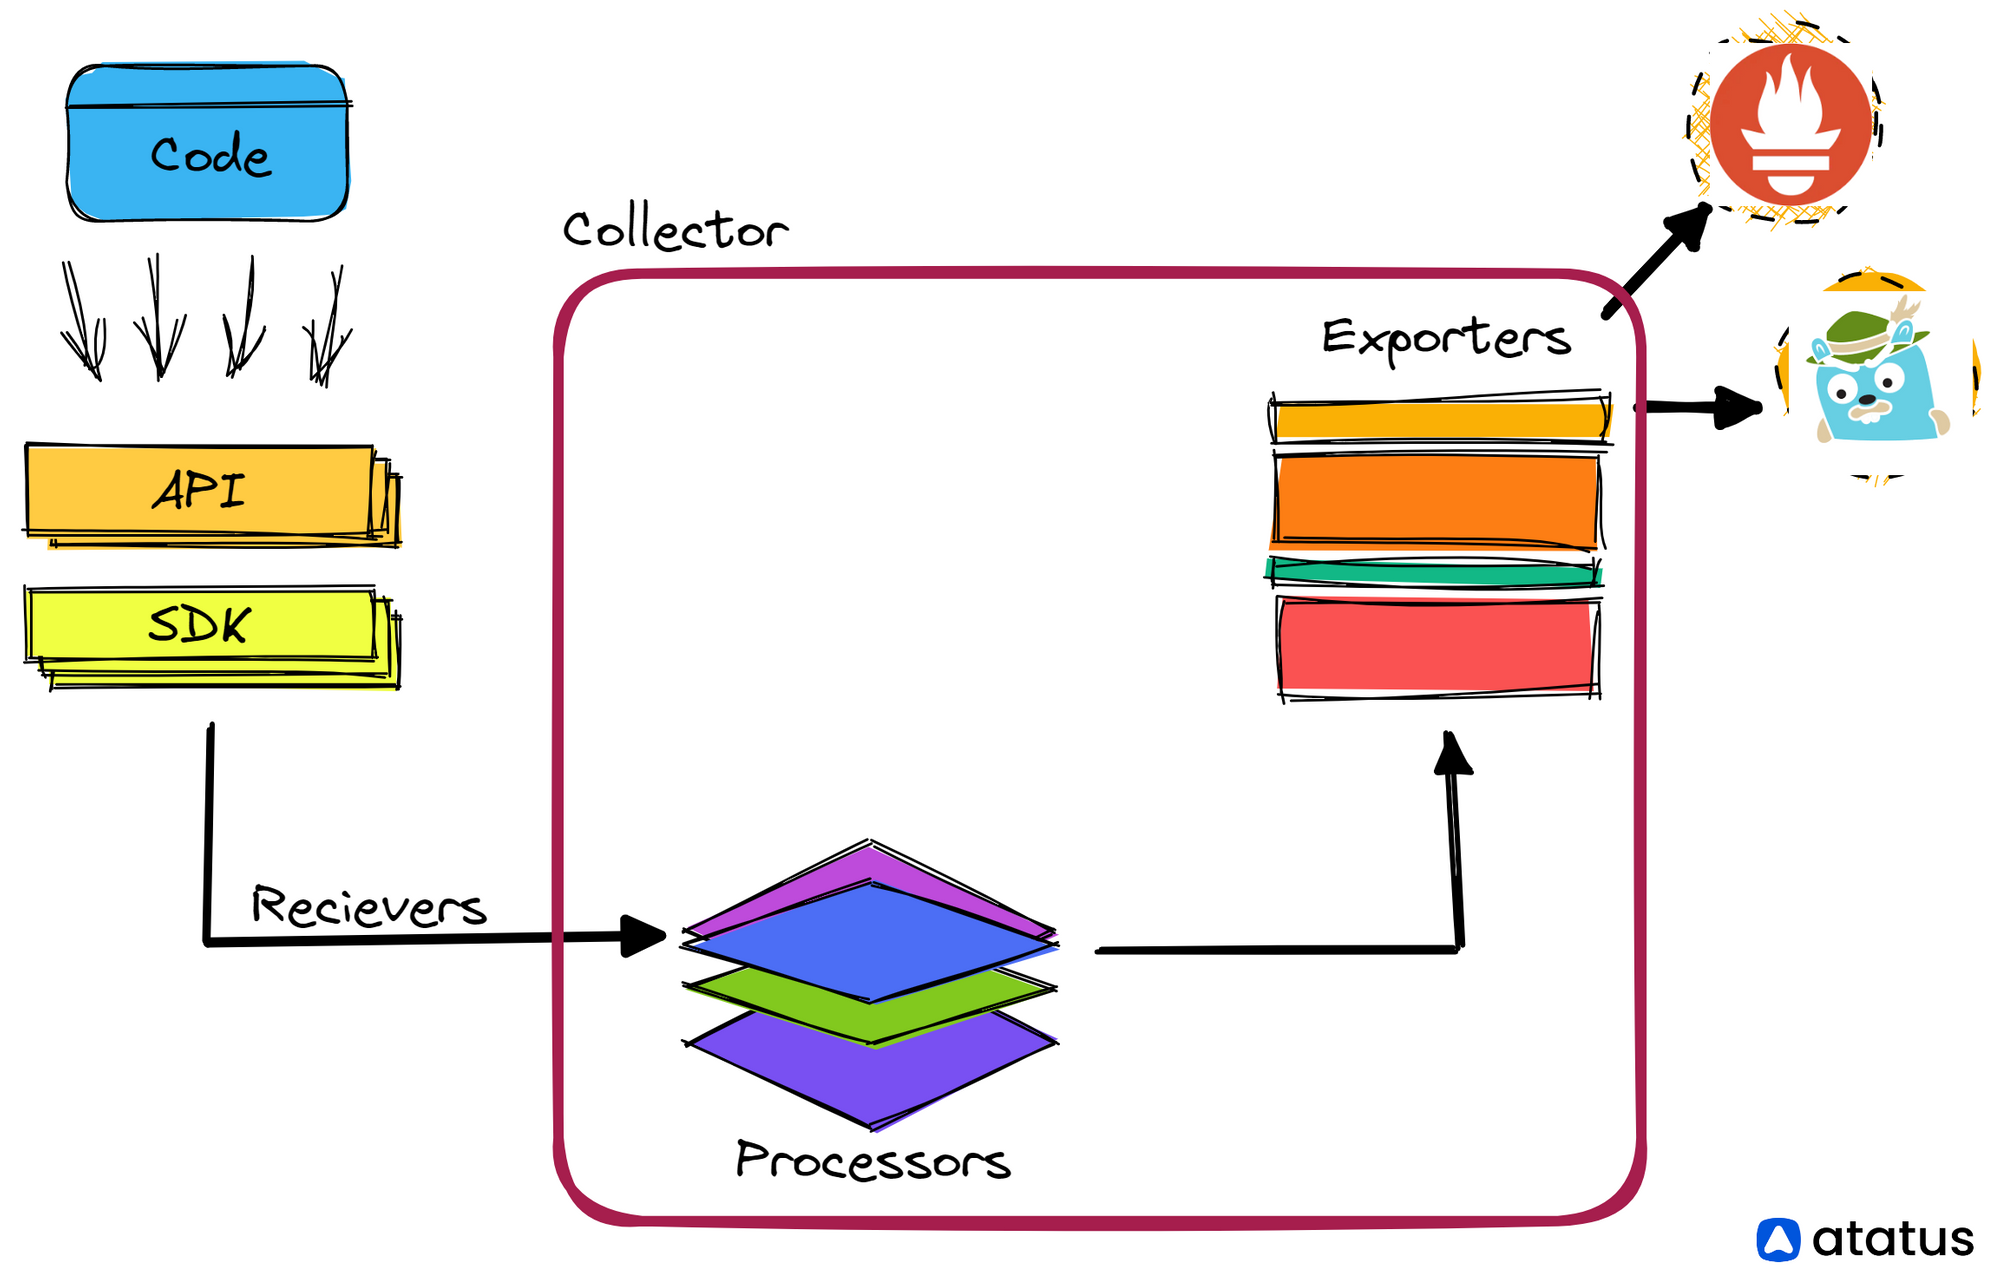
OTLP or OpenTelemetry Protocol typically includes three branches of the observability module - receivers, processors and exporters.
- Receivers - for ingesting incoming data. Ingestion can be of two type.
- Local ingestion - on-premises or hybrid deployments where data is constantly transmitted to the cloud and this data can be stored in a local cache and used later when the need arises.
- Span ingestion - when trace data is ingested in span format. Spans are typically indexed and consist of both root spans and child spans. This data is valuable because it contains key metadata, event information, and more.
- Processors - data processing including collection, sampling, filtering and aggregating metrics.
- Exporters - processed data is exported to higher aggregation units or backend analysis tools. The data is shared via Prometheus or Jaeger, etc.
How does Opentelemetry work?
Here's a step-by-step workflow for how OpenTelemetry works using an example of an e-commerce application:
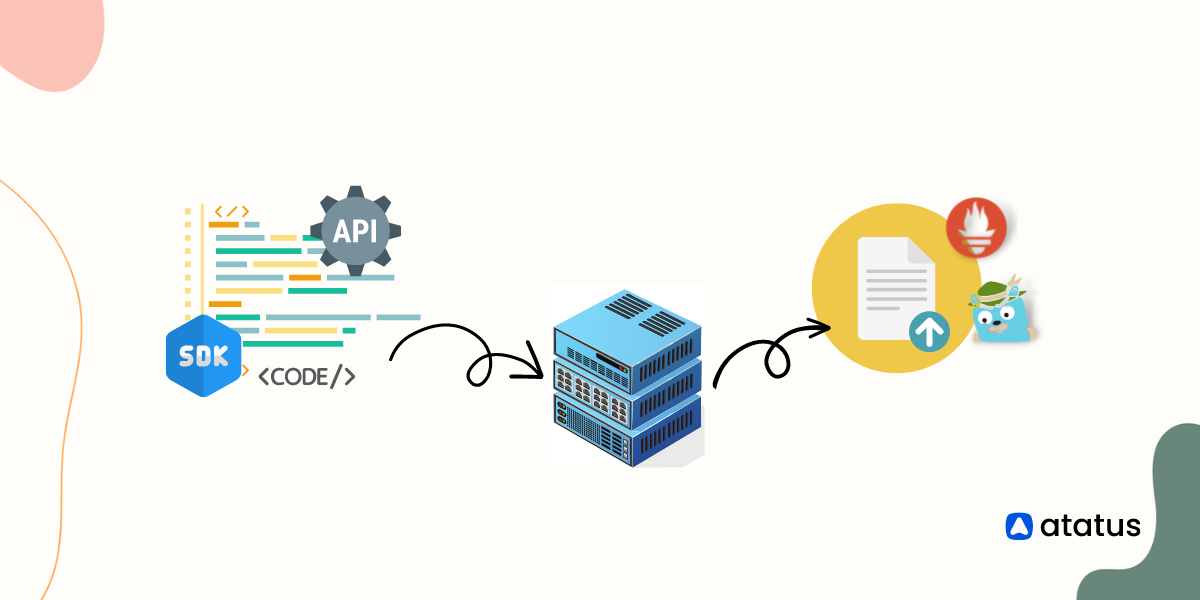
- Developers use OpenTelemetry libraries and APIs to instrument the e-commerce application to capture telemetry data such as traces, metrics, and logs. They add code to the application to capture data at various points, such as when a user makes a purchase, or when a backend service receives a request.
- OpenTelemetry collectors receive the telemetry data from the instrumented e-commerce application. Collectors can perform sampling, filtering, and aggregation of the data before forwarding it to the backend. For example, the collector might only collect a subset of trace data to reduce the amount of data sent to the backend.
- Developers can choose the telemetry solution that best fits their needs and use the appropriate exporter to send the data to that solution. Exporters include Jaeger for tracing, Prometheus for metrics, and Elasticsearch for logs.
- The telemetry solutions receive the data from OpenTelemetry, and analyze and visualize the data to provide insights into the performance and behavior of the e-commerce application. For example, the Jaeger tracing solution might show a visual representation of the call flow between the various services in the application, while the Prometheus metrics solution might provide metrics such as request latency and error rates.
- With the telemetry data collected and analyzed, developers and operators can quickly identify and diagnose issues, such as slow response times or error rates. They can then optimize the application to improve performance and reliability, such as by adjusting the configuration of the application or scaling out certain services.
Implementing Opentelemetry for your stack
Here’s a rundown on how to install OpenTelemetry for your stack:
- Choose your language and framework: OpenTelemetry supports multiple programming languages, including Java, Python, Go, C++, and others. Choose the language and framework that your stack uses.
- Install the OpenTelemetry SDK: OpenTelemetry provides SDKs for each supported language, which include both automatic and manual instrumentation capabilities. Install the SDK for your language and framework.
- Configure the SDK: OpenTelemetry SDK needs to be configured to define which telemetry data to collect, where to send it, and which exporters to use. The SDK configuration can be done through environment variables or a configuration file.
- Once the SDK is installed and configured, you can start instrumenting your application. This involves adding OpenTelemetry code to your application to create spans, add attributes, and log events.
- Choose an exporter: OpenTelemetry provides multiple exporters, including Jaeger, Prometheus, and Zipkin. Choose the exporter that best fits your needs and configure it to send telemetry data to your backend.
- Deploy and monitor: Deploy your instrumented application and monitor the telemetry data in your backend.
Here's an example implementation for a Java Spring Boot application using the OpenTelemetry Java SDK:
#1 Add the OpenTelemetry Java SDK to your project dependencies:
<dependency>
  <groupId>io.opentelemetry</groupId>
  <artifactId>opentelemetry-api</artifactId>
  <version>1.7.0</version>
</dependency>
<dependency>
  <groupId>io.opentelemetry</groupId>
  <artifactId>opentelemetry-sdk</artifactId>
  <version>1.7.0</version>
</dependency>
#2 Configure the OpenTelemetry SDK:
SdkTracerProvider tracerProvider = SdkTracerProvider.builder()
  .addSpanProcessor(SimpleSpanProcessor.create(new MySpanExporter()))
  .build();
OpenTelemetrySdk.builder()
  .setTracerProvider(tracerProvider)
  .buildAndRegisterGlobal();
#3 Instrument your application:
Span span = tracer.spanBuilder("mySpan").startSpan();
try (Scope scope = tracer.withSpan(span)) {
  span.setAttribute("myAttribute", "myValue");
  // your application logic
} finally {
  span.end();
}
#4 Choose an exporter:
private static final String OTEL_EXPORTER_JAEGER_ENDPOINT = "OTEL_EXPORTER_JAEGER_ENDPOINT";

public static void main(String[] args) {
  String endpoint = System.getenv(OTEL_EXPORTER_JAEGER_ENDPOINT);
  if (endpoint == null) {
    endpoint = "http://localhost:14268/api/traces";
  }
  JaegerGrpcSpanExporter exporter =
      JaegerGrpcSpanExporter.builder().setEndpoint(endpoint).build();
  SimpleSpanProcessor processor = SimpleSpanProcessor.builder(exporter).build();
  OpenTelemetrySdk.getTracerProvider().addSpanProcessor(processor);
}
#5 Deploy your instrumented application and monitor the telemetry data in Jaeger. Use the telemetry data to troubleshoot issues, optimize performance, and gain insights into your system.
Choosing Instrumentation type
Instrumentation is the process of adding code to an application to generate telemetry data, and OpenTelemetry supports both automatic and manual instrumentation.
Manual instrumentation in OpenTelemetry involves adding code to the application to generate telemetry data for custom application logic or to instrument libraries or frameworks that are not automatically instrumented. It requires adding code to the application using the OpenTelemetry API, such as creating spans and adding attributes to those spans.
Meanwhile, Automatic instrumentation in OpenTelemetry is provided by instrumenting libraries or frameworks that are used by the application. For example, if an application uses the HTTP library to communicate with other services, OpenTelemetry can automatically instrument the HTTP library to generate telemetry data for each HTTP request.
Similarly, if the application uses a database driver to communicate with a database, OpenTelemetry can automatically instrument the database driver to generate telemetry data for each database query.
OpenTelemetry provides various language-specific SDKs, which include both automatic and manual instrumentation capabilities. For example, the Java SDK includes automatic instrumentation for libraries such as JDBC, gRPC, and HTTP and APIs for manual instrumentation.
Similarly, the Python SDK includes automatic instrumentation for libraries such as Flask, Django, and requests, and it also includes APIs for manual instrumentation.
Automatic instrumentation can be used for commonly used libraries and frameworks, while manual instrumentation can be used for custom application logic and for libraries and frameworks that are not automatically instrumented.
Benefits of Opentelemetry
OpenTelemetry provides several benefits for developers and organizations that want to implement observability in their applications. Some of the key benefits of OpenTelemetry include:
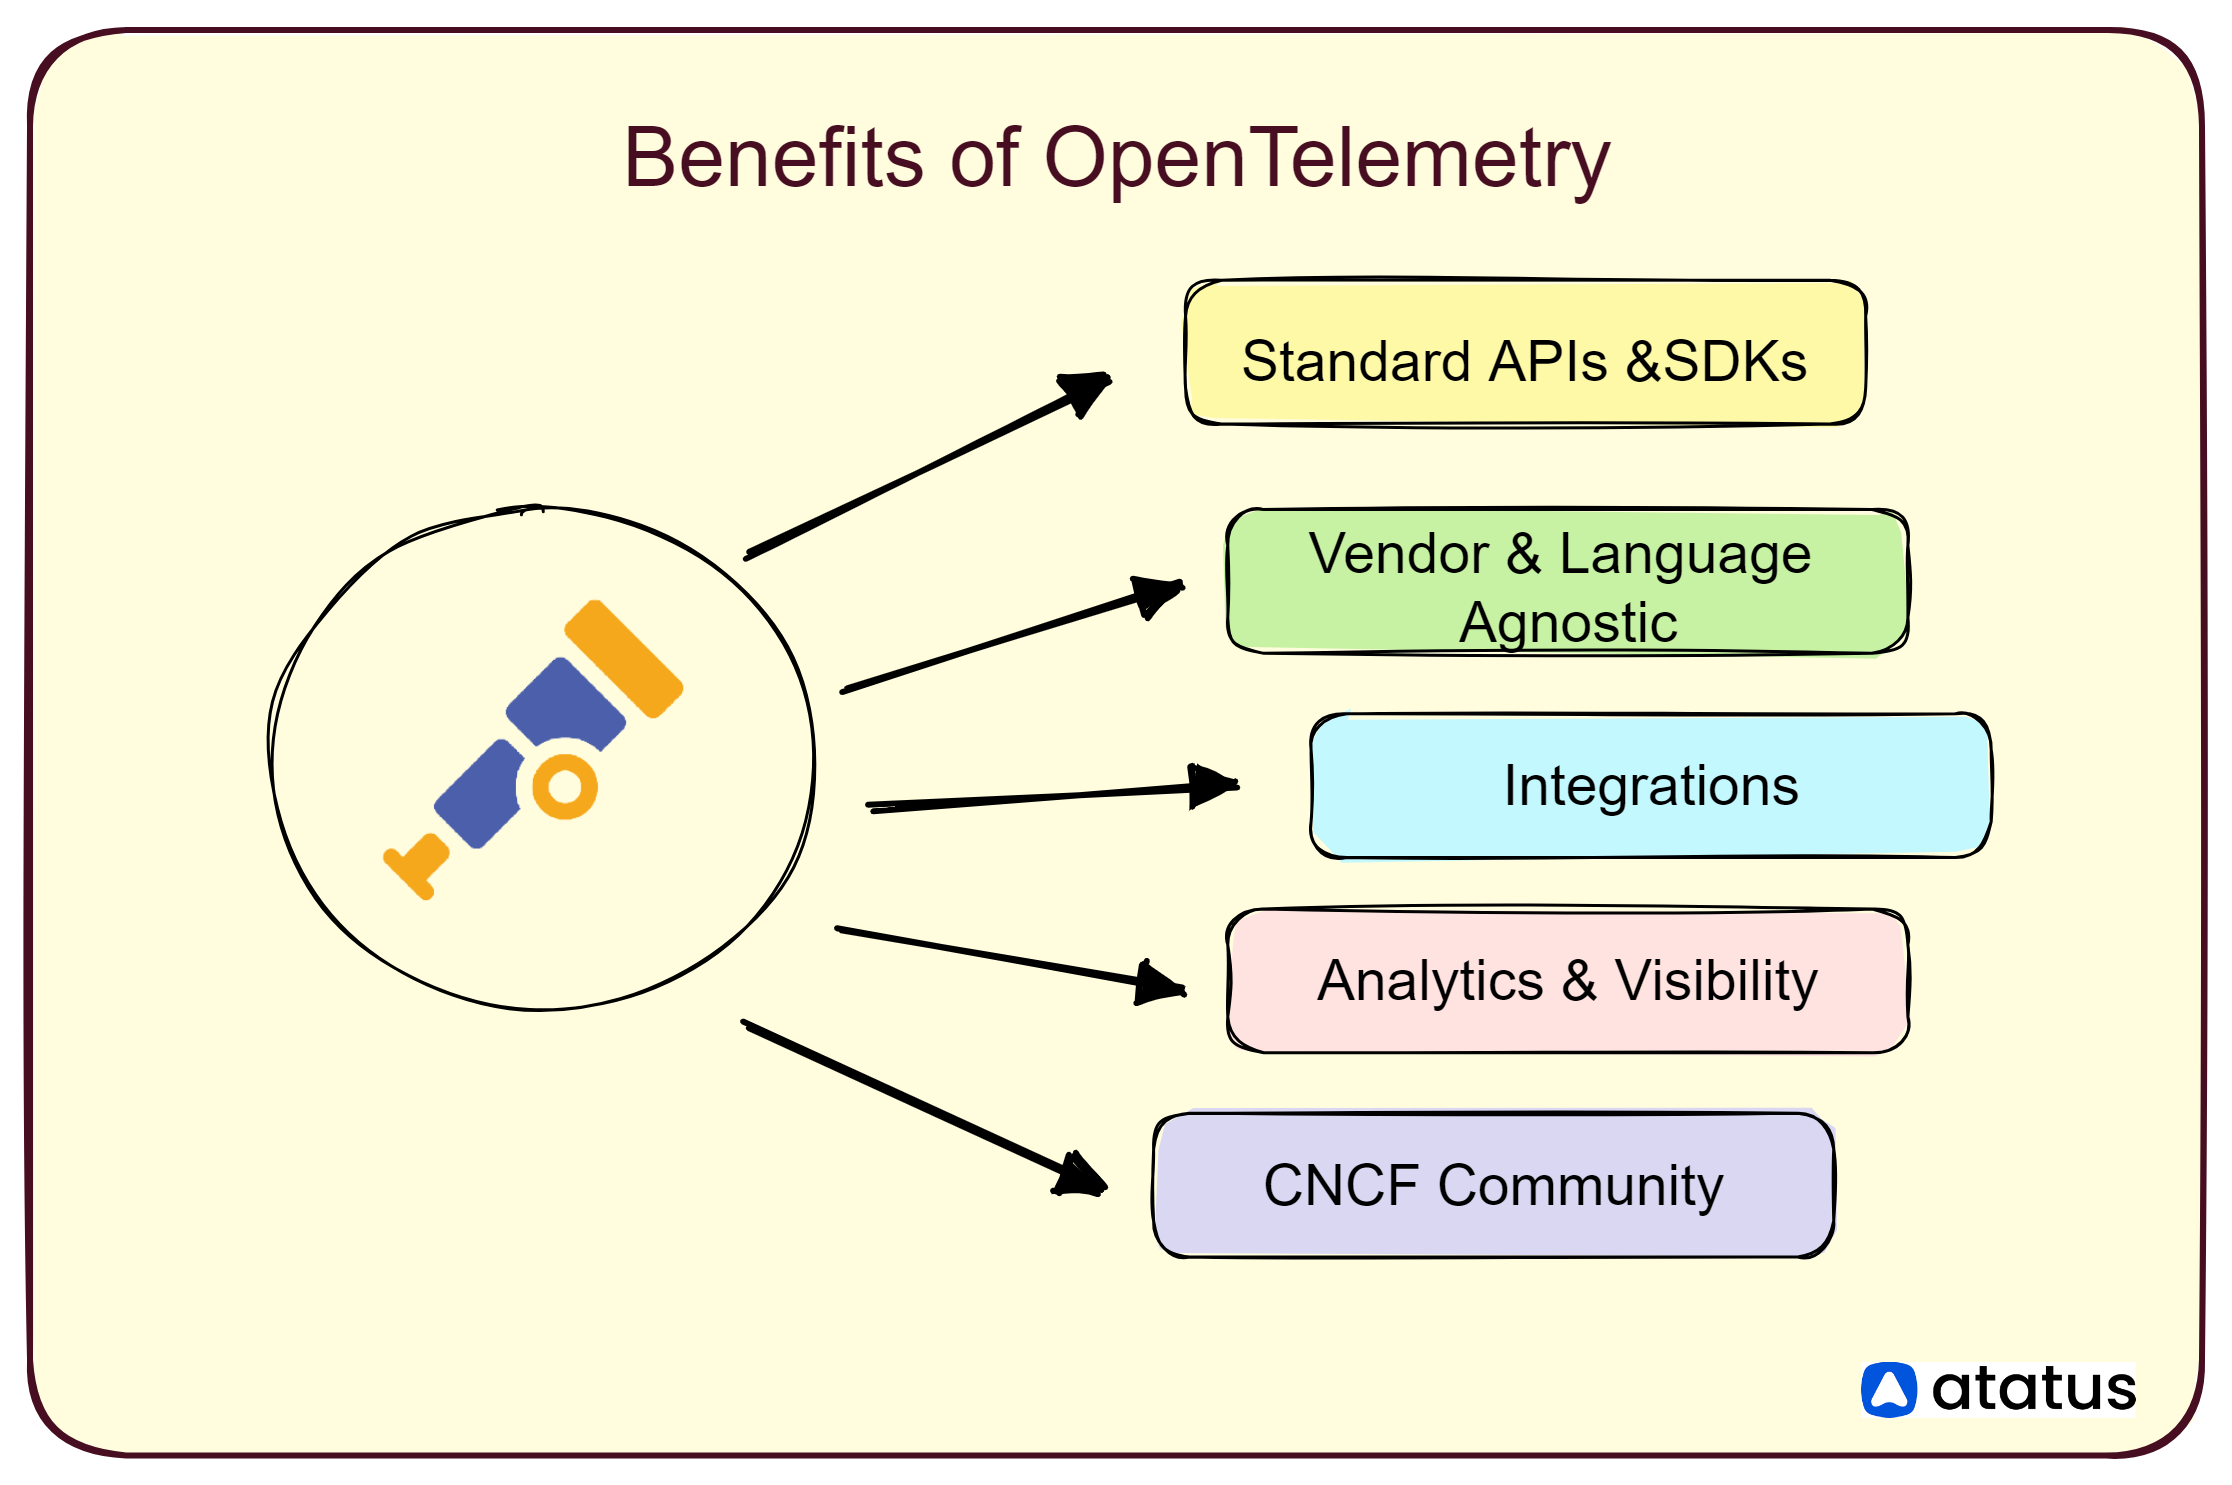
- Standardization: OpenTelemetry provides a standardized way of collecting, processing, and exporting telemetry data across different languages, frameworks, and third-party telemetry solutions. This makes it easier for developers to implement and manage telemetry data in their applications, without having to write custom instrumentation code for each solution.
- Flexibility: OpenTelemetry is designed to be vendor-agnostic and language-agnostic, which means that it can be used with a wide range of programming languages, frameworks, and third-party telemetry solutions. This gives developers the flexibility to choose the telemetry solution that best fits their needs, without being locked into a specific vendor or language.
- Interoperability: It provides integrations with popular libraries, frameworks, and platforms, allowing developers to instrument their applications without having to write custom instrumentation code. This makes it easier to integrate with existing systems and to trace requests across different services.
- Visibility: It provides a comprehensive view of the performance and behavior of distributed systems, allowing developers and operators to identify and diagnose issues quickly. This helps to improve the reliability and availability of applications, while reducing the time and cost of troubleshooting.
- Community: OpenTelemetry is maintained by the Cloud Native Computing Foundation (CNCF) and has a vibrant community of contributors and users. This community provides support, resources, and best practices for implementing and using OpenTelemetry effectively.
Wrapping Up
In conclusion, OpenTelemetry is a powerful observability framework that enables developers to collect and manage telemetry data across complex distributed systems. It provides a unified API and SDK for instrumenting applications to generate telemetry data, which can then be exported to various backends such as Prometheus, Jaeger, and Zipkin.
OpenTelemetry supports both automatic and manual instrumentation, allowing developers to generate telemetry data for their applications and libraries.
With OpenTelemetry, developers can gain insights into their system's performance, troubleshoot issues, and optimize their applications.
OpenTelemetry is an essential tool for building reliable and scalable systems in today's complex and distributed world.
Atatus API Monitoring and Observability
Atatus provides Powerful API Observability to help you debug and prevent API issues. It monitors the consumer experience and is notified when abnormalities or issues arise. You can deeply understand who is using your APIs, how they are used, and the payloads they are sending.
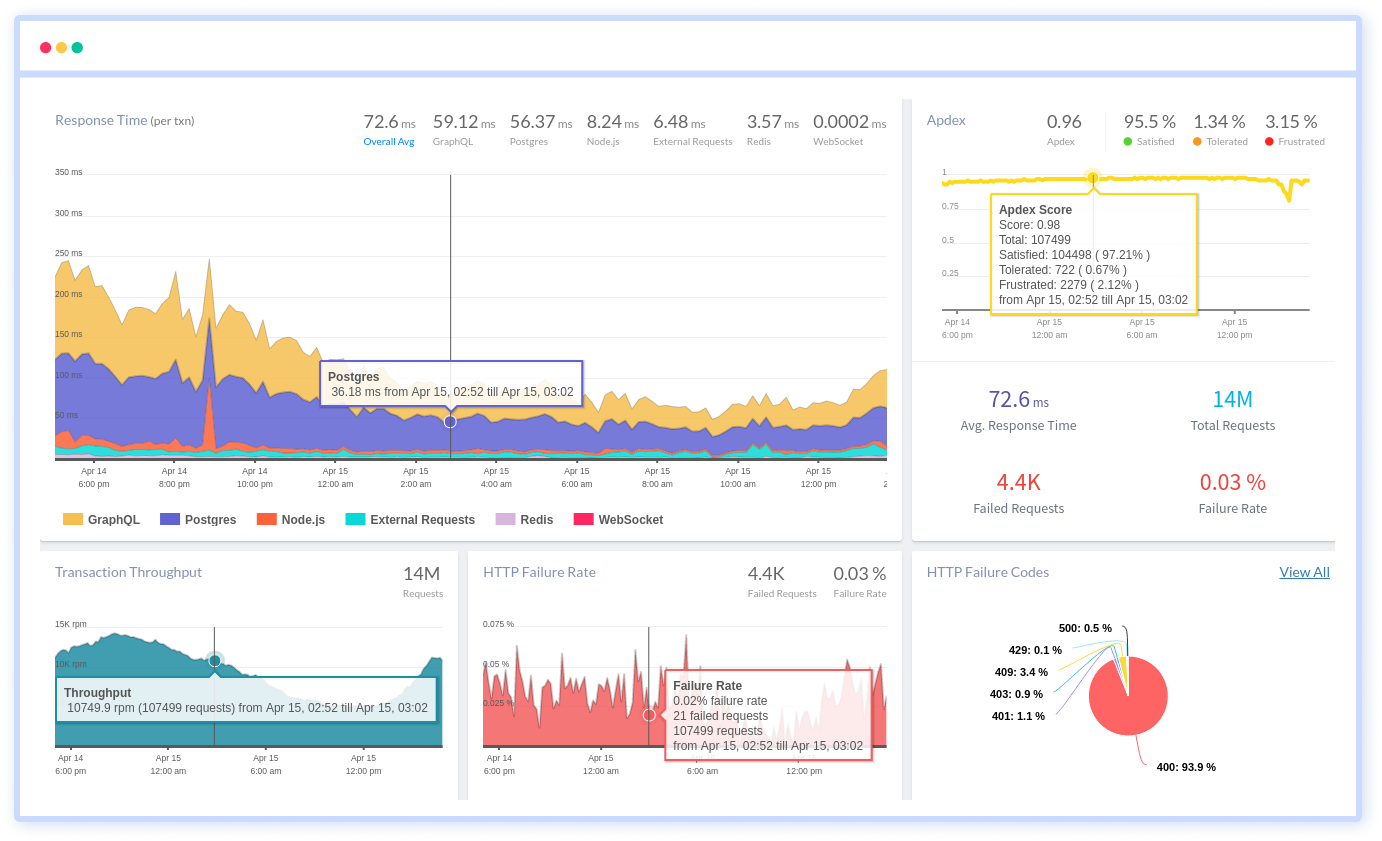
Atatus's user-centric API observability tracks how your actual customers experience your APIs and applications. Customers may easily get metrics on their quota usage, SLAs, and more.
It monitors the functionality, availability, and performance data of your internal, external, and third-party APIs to see how your actual users interact with the API in your application. It also validates rest APIs and keeps track of metrics like latency, response time, and other performance indicators to ensure your application runs smoothly.
#1 Solution for Logs, Traces & Metrics
![]() APM
APM
![]() Kubernetes
Kubernetes
![]() Logs
Logs
![]() Synthetics
Synthetics
![]() RUM
RUM
![]() Serverless
Serverless
![]() Security
Security
![]() More
More