Top 13 Prometheus Alternatives in 2026
Prometheus is a widely adopted open-source monitoring and alerting toolkit, popular among DevOps and SRE teams for its robust metrics collection and powerful query language (PromQL). It is fast, reliable, and purpose-built for modern, cloud-native environments.
However, Prometheus may not suit all teams or projects. In 2025, several alternatives offer different strengths that might better match your specific monitoring needs.
This guide explores the top Prometheus alternatives, comparing features, performance, and usability, so you can choose the right tool for your environment.
Table of Contents:
- Why does Prometheus matter?
- Why Consider Prometheus Alternatives?
- Top 13 Prometheus Alternatives in 2025
- How to Choose the Right Prometheus Alternative?
Why does Prometheus matter?
Prometheus has become a go-to tool for time-series data monitoring in the DevOps world. It offers:
- Pull-based metrics collection: Efficient for scraping metrics from endpoints.
- PromQL: A robust and flexible query language for monitoring and alerting.
- Kubernetes integration: Native support for service discovery in containerized environments.
- Alertmanager: Manages alerts and routes notifications.
- Open-source ecosystem: Strong community and extensibility.
Why Consider Prometheus Alternatives?
Despite its strengths, Prometheus also comes with some limitations. Let’s see some common reasons why people look for Prometheus alternatives.
- No long-term storage by default (requires external integrations)
- Manual dashboarding and alert setup
- No native support for logs or traces
- Steep learning curve for non-technical users
- Scaling becomes complex at large volumes
If your team needs an out-of-the-box solution, long-term retention, or full observability (metrics, logs, traces), you might want to explore more modern or enterprise-ready tools.
Here are some Prometheus alternatives you can check out for better observability, easier setup, and more advanced features like logs and traces.
Prometheus vs. Atatus: At a Glance
Before you work through all 13 alternatives below, here's how Atatus stacks up against Prometheus across the dimensions that matter most when evaluating a replacement.
| Feature | Prometheus | Atatus |
|---|---|---|
| Infrastructure Monitoring | Via exporters (node_exporter etc.) Manual setup required | Built-in, agent-based, ready out of the box |
| Application Monitoring (APM) | Not supported natively | Full APM with code-level transaction tracing |
| Distributed Tracing | Requires a separate backend (e.g. Jaeger, Tempo) | Native, correlated with metrics and logs |
| Logs | No native log storage or correlation | Centralized logs, correlated with traces and metrics |
| Setup Time | Hours to days. Exporters, scrape configs, Alertmanager | Minutes, one agent, dashboards appear automatically |
| Alerting | Via Alertmanager, a separate service to run and tune | Built-in alerting: threshold, anomaly-based, and smart rules |
| Root Cause Analysis | Manual correlation across PromQL queries and dashboards | Automated correlation across services, infra, and code |
| Full Stack Visibility | Metrics-only by design | Metrics, logs, traces, RUM, and infra one view |
| Maintenance Effort | High, TSDB scaling, retention, and HA are your responsibility | Low, fully managed SaaS, no infrastructure to run |
| Cost Predictability | Infra and ops costs are hidden in engineering time | Transparent, predictable subscription pricing |
Top 13 Prometheus Alternatives in 2025
- Atatus
- Zabbix
- Grafana Mimir
- InfluxDB
- Graphite
- Nagios
- Sensu
- Icinga
- SigNoz
- Dynatrace
- Datadog
- Sematext
- Splunk
Atatus
Atatus is a full-stack observability tool that works great as a Prometheus alternative. It is built to monitor applications that produce various types of telemetry data, bringing together logs, metrics, and traces in one unified view.
Atatus simplifies deployment through a fully managed SaaS model. It enables root cause analysis with correlation across services and infrastructure layers. Designed for simplicity, performance, and ease of setup, Atatus is an ideal Prometheus alternative for modern DevOps and SRE teams.
Key Features:
- APM & Distributed Tracing: Tracks application performance down to individual transactions.
- OpenTelemetry Support: Collects standardized metrics, making it a drop-in alternative for Prometheus-compatible agents.
- Logs Management: Centralizes and correlates logs with metrics and traces.
- Real User Monitoring (RUM): Monitors user behavior and frontend performance.
- Prebuilt Dashboards: Comes with ready-to-use dashboards across metrics, traces, and logs.
- Built-in Alerting and Dashboards: Provides ready-made visualizations for infrastructure and applications, reducing setup time.
Atatus vs Prometheus
| Feature | Atatus | Prometheus |
|---|---|---|
| Data Collection | Agent-based and agentless monitoring for full-stack observability | Pull-based metrics collection using exporters |
| Storage | Cloud-based storage with long-term retention | Local TSDB with short retention period |
| Dashboards & Alerts | Pre-built and customizable dashboards with smart alerting | Manual dashboard setup using Grafana; alerting via Alertmanager |
| Setup Complexity | Easy-to-setup SaaS platform | Requires manual configuration and infrastructure management |
| Use Case | Best for teams seeking end-to-end observability without infrastructure overhead | Ideal for cloud-native and Kubernetes-based environments |
Zabbix
Zabbix is an open-source monitoring platform supporting infrastructure, application, and network monitoring through agent-based and agentless mechanisms. As a Prometheus alternative, it stores historical data efficiently and provides a visual overview through dashboards and maps. It is well-suited for hybrid and enterprise environments. Zabbix supports complex trigger-based alerting.
Key Features:
- Custom Metric Collection: Supports agents, scripts, and more for flexible data ingestion.
- Scalable Data Storage: Uses an optimized database schema for long-term historical data.
- Built-in Visualizations: Includes native graphs, screens, and maps for infrastructure metrics.
- Trigger-Based Alerting: Offers granular alert conditions and escalation rules that extend beyond Prometheus's Alertmanager.
Zabbix vs Prometheus
| Feature | Zabbix | Prometheus |
|---|---|---|
| Data Collection | Agent-based, SNMP, IPMI support | Pull-based HTTP scraping |
| Storage | Uses relational databases (MySQL, PostgreSQL) | Time-series DB optimized for metrics |
| Visualization | Native web interface | Requires Grafana for advanced visuals |
| Alerting | Built-in alert engine with escalations | Alertmanager with integrations |
| Use Case | Hybrid IT monitoring (networks, servers) | Cloud-native and container metrics |
Grafana Mimir
Grafana Mimir is a high-scale, long-term storage backend for Prometheus metrics developed by Grafana Labs. It is designed for multi-tenant use and stores data in cloud object storage. Mimir allows querying with PromQL and supports high ingestion throughput. It is ideal for environments requiring durability and scale.
Key Features:
- PromQL Native: Fully supports Prometheus query language without modification.
- Cloud-Native Scalability: Scales horizontally to handle millions of active time-series.
- Multi-Tenant Architecture: Separates tenants' data for enterprise and SaaS models.
- Long-Term Storage: Integrates with object stores like AWS S3 and GCS for cost-effective metric retention.
Grafana Mimir vs Prometheus
| Feature | Grafana Mimir | Prometheus |
|---|---|---|
| Scalability | Highly scalable for large workloads | Best for small to mid-scale environments |
| Storage | Object storage with long retention support | Local storage with limited retention |
| Multi-tenancy | Supports multi-tenant architecture | No built-in multi-tenancy |
| Integration | Tight integration with Grafana Cloud | Integrates with Grafana manually |
| Use Case | Enterprise-grade, long-term metrics storage | Cloud-native short-term metrics monitoring |
InfluxDB
InfluxDB is a purpose-built time-series database optimized for high write throughput and efficient querying. It supports line protocol and Flux query language. InfluxDB is available as open-source, enterprise, and cloud versions. It is suitable for real-time analytics and custom dashboarding.
Key Features:
- High-Performance Ingestion: Designed for large volumes of time-series data with millisecond-level granularity.
- Flux Query Language: Advanced querying and transformation capabilities exceeding PromQL in flexibility.
- Telegraf Integration: Plugin-based agent for collecting metrics from diverse sources.
- Retention and Downsampling: Allows custom data retention policies and rollups for long-term storage management.
InfluxDB vs Prometheus
| Feature | InfluxDB | Prometheus |
|---|---|---|
| Storage Engine | Optimized for time-series data with compression | Efficient time-series storage with TSDB |
| Query Language | Flux and InfluxQL for complex querying | PromQL focused on metrics and alerts |
| Retention Policies | Custom retention policies per measurement | Retention depends on local disk and config |
| Data Types | Supports multiple field types including strings | Primarily numerical time-series data |
| Visualization | Native UI and integrations with Grafana | Grafana is commonly used |
Graphite
Graphite is a time-series metrics collection and visualization tool commonly used in legacy systems. It accepts metrics via plaintext protocol and supports basic graphing. While lacking modern observability capabilities, it is still used in stable environments.
Key Features:
- Simple Metric Ingestion: Accepts time-series metrics over TCP in plaintext format.
- Whisper Storage: Efficient time-series storage engine with fixed-size database files.
- Basic Graphite-Web UI: Built-in UI for viewing and customizing metrics graphs.
- Scalable Architecture: Can be horizontally scaled with Carbon relay and clustering.
Graphite vs Prometheus
| Feature | Graphite | Prometheus |
|---|---|---|
| Metric Model | Hierarchical metric naming structure | Labels-based metric model |
| Data Collection | Push model via agents or scripts | Pull-based from targets via exporters |
| Storage | Whisper database for long-term retention | TSDB with configurable retention |
| Visualization | Built-in dashboard and Grafana integration | Grafana integration widely used |
| Alerting | Limited native alerting; external tools required | Built-in alerting and Alertmanager |
Nagios
Nagios is a plugin-based infrastructure monitoring tool widely used for system health and availability checks. It monitors hosts, services, and network endpoints. Nagios relies on active checks and external scripts. It is known for reliability in traditional IT environments.
Key Features:
- Extensible Plugin Model: Thousands of existing plugins to monitor various metrics and services.
- Active and Passive Checks: Supports direct probing and external input for metrics.
- Alerting System: Customizable alerts with escalation and downtime suppression.
- Web-Based Status UI: Displays real-time status of systems and hosts.
Nagios vs Prometheus
| Feature | Nagios | Prometheus |
|---|---|---|
| Monitoring Approach | Plugin-based active checks (pull/push) | Pull-based metrics collection via exporters |
| Alerting System | Basic alerting through email or SMS | Advanced alerting with Alertmanager |
| Metrics Storage | Limited historical data; not optimized for time-series | Efficient time-series database (TSDB) |
| Visualization | Basic web UI and third-party tools | Grafana integration for advanced dashboards |
| Scalability | Challenging to scale in large environments | Designed for cloud-native scalability |
Sensu
Sensu is a flexible monitoring tool that supports both cloud-native and traditional infrastructure. It collects metrics, events, and health data using agent-based and agentless configurations. It supports automatic remediation and real-time alerts.
Key Features:
- Event-Driven Architecture: Monitors system health through automated, condition-based triggers.
- Plugin and Handler Support: Executes checks and routes events to multiple outputs (e.g., InfluxDB, Graphite).
- Custom Metrics Collection: Supports diverse input sources and backends.
- Integrated Alerting: Native support for multi-channel notifications and incident response workflows.
Sensu vs Prometheus
| Feature | Sensu | Prometheus |
|---|---|---|
| Monitoring Approach | Hybrid model with agent-based and agentless monitoring | Pull-based metrics collection via exporters |
| Alerting System | Advanced alerting and automated remediation | Alertmanager for advanced alerting |
| Metrics Storage | Customizable time-series data storage with integration to other backends | Efficient time-series database (TSDB) |
| Visualization | Integrates with Grafana and other visualization tools | Grafana integration for advanced dashboards |
| Scalability | Scalable for large and distributed environments | Designed for cloud-native scalability |
Icinga
Icinga, a prometheus alternative is a monitoring platform built on top of Nagios, offering improved UI, REST API, and distributed monitoring capabilities. It monitors infrastructure and services, providing dashboards and alert management. Icinga is suitable for IT environments requiring high availability.s
Key Features:
- Infrastructure and Service Monitoring: Tracks availability, usage, and performance of all assets.
- Nagios Plugin Support: Leverages existing ecosystem for broad compatibility.
- Modern Web Interface: Offers interactive dashboards and advanced reporting.
- Distributed Monitoring: Supports clustering and remote site visibility.
Icinga vs Prometheus
| Feature | Icinga | Prometheus |
|---|---|---|
| Monitoring Approach | Agent-based monitoring with Nagios-compatible checks | Pull-based monitoring with exporters for metrics collection |
| Alerting | Advanced alerting, supports escalations and notifications | Alertmanager for handling alerts and notification routing |
| Storage | SQL and flat file storage for historical data | TSDB (Time Series Database) for efficient metrics storage |
| Visualization | Integrates with Grafana for visualization | Grafana for advanced visualization and dashboarding |
| Scalability | Supports large-scale environments with clustering | Scalable for cloud-native environments with federation |
SigNoz
SigNoz is an open-source observability tool built for metrics, traces, and logs using OpenTelemetry. It provides APM capabilities with Prometheus-compatible data collection. SigNoz integrates with cloud-native environments and supports service maps and trace analysis.
Key Features:
- OpenTelemetry Native: Uses OTLP for receiving standardized telemetry data.
- Unified Observability: Collects and correlates metrics, logs, and traces in one platform.
- Prometheus-Compatible Metrics: Accepts Prometheus-formatted metrics with native storage.
- Service-Level Dashboards: Visualizes service performance and dependencies.
SigNoz vs Prometheus
| Feature | SigNoz | Prometheus |
|---|---|---|
| Monitoring Approach | Full-stack observability with logs, traces, and metrics | Primarily metrics-based monitoring with time-series data |
| Data Storage | Stores metrics, traces, and logs in one platform | Metrics stored in time-series databases with limited retention |
| Visualization | Supports Grafana integration for advanced dashboards | Uses Grafana or native Prometheus UI for visualization |
| Alerting | Built-in alerting based on metrics and logs | Alertmanager handles alerting based on metric thresholds |
| Use Case | End-to-end observability for full-stack monitoring | Focused on time-series metrics and infrastructure monitoring |
Dynatrace
Dynatrace is an AI-powered observability platform offering full-stack monitoring, infrastructure analysis, and APM. This Prometheus alternative collects and analyzes metrics, logs, and traces in real time. Dynatrace uses a single agent model for automation and data collection.
Key Features:
- OneAgent Technology: Automatically instruments and collects telemetry from systems.
- Metric Storage & Querying: Ingests custom metrics and supports Prometheus metric formats.
- AI-Driven Correlation: Detects root causes across infrastructure and application layers.
- Kubernetes Monitoring: Deep visibility into containers and orchestration layers.
Dynatrace vs Prometheus
| Feature | Dynatrace | Prometheus |
|---|---|---|
| Monitoring Approach | Full-stack observability with APM, logs, metrics, and traces | Focused on time-series metrics with a pull-based model |
| Data Storage | Cloud-native with auto-scaling, storage retention policies | Local storage with configurable retention policies |
| Integration | Seamless integration with cloud platforms, infrastructure, and applications | Integrates with Grafana and a wide range of exporters |
| Alerting | AI-powered anomaly detection and alerting with automatic root cause analysis | Alertmanager handles alerting based on metric thresholds |
| Use Case | Enterprise-level monitoring with full-stack observability and advanced features | Time-series monitoring for infrastructure and application metrics |
Datadog
Datadog is a cloud-native observability platform offering metrics, logs, traces, and security telemetry in one place. It supports Prometheus-compatible exporters and integrates with a wide range of cloud providers and services. Datadog is designed for scalability and automation.
Key Features:
- Prometheus Exporter Support: Directly ingests Prometheus-format metrics.
- Managed Metric Storage: Scalable and durable backend with custom retention policies.
- Advanced Visualization: Custom dashboards, service maps, and notebooks.
- Alerting and Anomaly Detection: Includes machine learning-based alerting for time-series data.
Datadog vs Prometheus
| Feature | Datadog | Prometheus |
|---|---|---|
| Monitoring Approach | Full-stack monitoring with metrics, APM, logs, and traces | Time-series metrics monitoring with a pull-based model |
| Data Collection | Automatic data collection from cloud services, containers, and servers | Manual configuration with exporters to collect data from various systems |
| Storage | Cloud-based, with seamless scalability and long-term retention options | Local storage with configurable retention policies |
| Visualization | Built-in dashboards and integrates with other visualization tools | Grafana integration for visualization |
| Alerting | Integrated alerting with automatic anomaly detection and AI-powered insights | Alertmanager for threshold-based alerting |
| Integration | Wide range of integrations with cloud providers, infrastructure, and applications | Requires custom integrations using exporters |
| Use Case | Comprehensive monitoring for enterprise-level applications and infrastructure | Ideal for infrastructure monitoring with a focus on time-series data |
Sematext
Sematext is a monitoring and log management platform offering support for metrics, logs, traces, and infrastructure insights. This Prometheus alternative supports custom and Prometheus-style metrics. Sematext is SaaS-based and designed for quick setup.
Key Features:
- Prometheus Metric Support: Collects Prometheus metrics via exporters or agents.
- Custom Dashboards: Real-time visualization with filtering and segmentation.
- Log-Metric Correlation: Links logs to metric events for context.
- Integrated Alerting: Trigger alerts based on threshold, anomaly, or absence of metrics.
Sematext vs Prometheus
| Feature | Sematext | Prometheus |
|---|---|---|
| Monitoring Approach | Full-stack monitoring with logs, metrics, and traces | Time-series metrics monitoring with a pull-based model |
| Data Collection | Automatic collection of logs, metrics, and traces from cloud and on-prem environments | Manual configuration through exporters to collect time-series data |
| Storage | Cloud-based storage with centralized retention and scalability | Local storage with configurable retention based on storage needs |
| Visualization | Built-in visualization tools and integrates with Grafana for advanced dashboards | Grafana integration for visualization |
| Alerting | Built-in alerting with anomaly detection and automated responses | Alertmanager provides threshold-based alerting |
| Integration | Multiple integrations with cloud platforms, infrastructure, and application services | Requires custom integrations via exporters |
| Use Case | Comprehensive observability solution for logs, metrics, and traces | Ideal for infrastructure monitoring with a focus on time-series data |
Splunk
Splunk is a data platform offering log management, metrics analysis, and observability tools across the stack. With Splunk Observability Cloud, it supports Prometheus and OpenTelemetry standards. Splunk provides advanced data analytics for IT and DevOps use cases.
Key Features:
- Metrics & Log Aggregation: Collects and processes Prometheus-style time-series metrics.
- OpenTelemetry Integration: Ingests standard telemetry from services and infrastructure.
- AI-Driven Insights: Detects patterns and anomalies across metrics and events.
- Prebuilt Observability Dashboards: Offers service-specific and custom dashboards for real-time visibility.
Splunk vs Prometheus
| Feature | Splunk | Prometheus |
|---|---|---|
| Monitoring Approach | Comprehensive monitoring with log analytics, metrics, and traces | Time-series data monitoring with a pull-based model |
| Data Collection | Collects logs, metrics, and event data from a wide range of sources | Collects metrics data from various sources using exporters |
| Storage | Cloud-based and on-premise storage for both logs and metrics | Local storage with customizable retention policies |
| Query Language | SPL (Search Processing Language) for querying logs and metrics | PromQL for querying time-series data |
| Alerting | Custom alerting based on logs, metrics, and events | Alertmanager provides alerting for time-series data based on defined thresholds |
| Integration | Extensive integrations with cloud services, databases, applications, and more | Manual integrations with exporters for metric collection |
| Use Case | Ideal for log management, security monitoring, and full-stack observability | Best for infrastructure monitoring with a focus on time-series metrics |
When Should You Move Beyond Prometheus?
Not every team needs to replace Prometheus. But a few patterns tend to signal that it's time to evaluate a full replacement rather than another integration:
- Microservices footprint is growing: Once you're past a handful of services, manually correlating metrics across dashboards stops scaling with your team.
- You need traces and logs, not just metrics: Debugging a production incident with metrics alone means guessing at the "why" behind the "what."
- Maintenance overhead is eating engineering time: If someone is spending real hours per month keeping Prometheus, Alertmanager, and Grafana healthy - that's a cost, even if it isn't on an invoice.
- Root cause investigations are slow: Pull-based metrics tell you something is wrong. They don't always tell you where to look first.
- Multiple teams need observability, not just SRE: As product and backend teams start asking for visibility, a self-hosted, ops-heavy stack becomes a bottleneck instead of an enabler.
If two or more of these sound familiar, it's worth seeing what a unified platform looks like in practice.
A Framework for Evaluating Any Prometheus Alternative
Whichever tool you're considering from this list or otherwise these are the questions worth asking before you commit.
| Evaluation Criteria | Why It Matters | Questions to Ask Vendors |
|---|---|---|
| Metrics | Determines whether you keep PromQL-style flexibility or lose query power in the move | Do you support Prometheus-format metrics and existing exporters? |
| Logs | Logs are often the missing piece in a pure Prometheus setup | Are logs correlated automatically with metrics and traces, or stored separately? |
| Traces | Tracing is essential for root-causing issues across microservices | Is distributed tracing native, or does it require a separate product? |
| Alerting | Poor alerting design is a top driver of on-call fatigue | What alert types are supported, static thresholds, anomaly detection, both? |
| Root Cause Analysis | Speed to root cause directly affects MTTR and incident cost | How does the platform correlate signals across services automatically? |
| Ease of Adoption | A tool your team won't fully configure delivers no value | What's the time to first dashboard after installing the agent? |
| Pricing | Self-hosted "free" tools often carry hidden infrastructure and ops cost | Is pricing based on hosts, data volume, or seats and how predictable is it at scale? |
| Scalability | What works for 10 services may not work for 200 | How does the platform handle high-cardinality metrics and data growth? |
| Support | Vendor support matters most during an incident, not a demo | What support tiers are available, and what are typical response times? |
Why Teams Choose Atatus Over Standalone Monitoring Tools
Most Prometheus alternatives solve one piece of the puzzle. Atatus is built around the idea that observability works better when it isn't split across four different tools.
- Unified Observability: APM, infrastructure monitoring, logs, RUM, error tracking, and distributed tracing in one platform, not bolted together after the fact.
- APM Beyond Metrics: Code-level transaction tracing shows exactly where time is being spent, not just that a service is slow.
- Infrastructure Without Exporter Sprawl: One agent covers hosts, containers, and Kubernetes environments, no exporter config per service.
- Logs Connected to Everything: Jump from a slow trace directly to the logs that explain it in the same UI, with no context switching.
- Real User Monitoring: Frontend performance alongside backend and infrastructure data, so a slow page load traces back to its actual cause.
- Faster MTTR: Metrics, logs, and traces are correlated automatically, so your team spends less time pivoting mid-incident and more time fixing.
The Hidden Cost of Managing Multiple Monitoring Tools
A self-hosted Prometheus stack rarely shows up as a line item which is exactly why its real cost is so easy to underestimate.
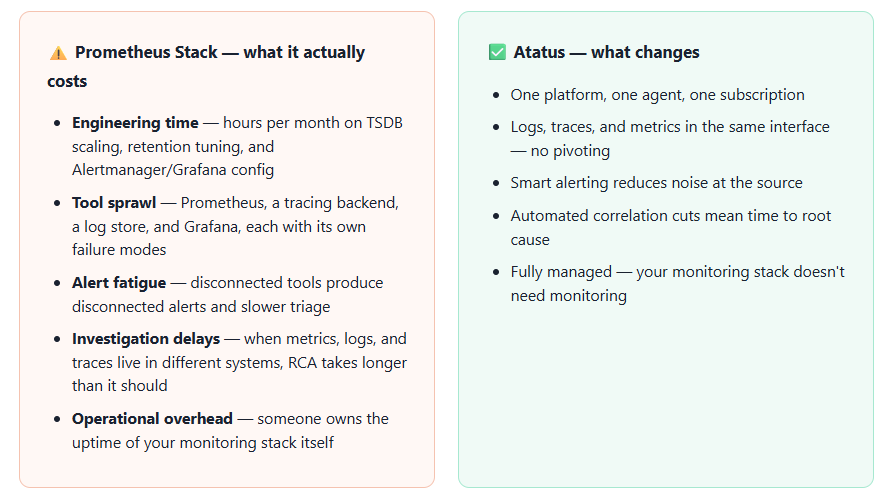
| Cost Factor | Prometheus Stack | Atatus |
|---|---|---|
| Tools to maintain | Prometheus + Alertmanager + Grafana + tracing/log backend | One platform |
| Where cost shows up | Engineering time and infrastructure mostly untracked | A single, predictable subscription |
| Time to root cause | Manual correlation across separate dashboards and tools | Automated correlation across all signals |
| Onboarding a new engineer | PromQL ramp-up and stack-specific knowledge required | Pre-built dashboards, minimal ramp-up |
How to Choose the Right Prometheus Alternative?
Choosing the right Prometheus alternative depends on your monitoring needs, infrastructure scale, and the kind of observability features you're looking for. Here are a few key questions to consider:
- Do you need more than just metrics?
Look for tools that also support logs and traces like Atatus, Datadog, or Splunk. - Is ease of setup and use important?
Some tools offer fully managed SaaS models that reduce maintenance and setup time. - Are you monitoring Kubernetes or hybrid environments?
Tools like Atatus and Zabbix are better suited for scalable or hybrid infrastructure. - Do you need long-term storage and historical analysis?
Prometheus needs external storage integrations, while tools like InfluxDB and Dynatrace offer built-in options. - What is your team’s technical comfort level?
Some alternatives come with ready-made dashboards and minimal configuration (e.g., Sematext, Atatus).
Ultimately, the best Prometheus alternative is the one that aligns with your team’s workflow, infrastructure complexity, and budget.
Ready to Move Beyond Prometheus?
Get metrics, logs, traces, and infrastructure monitoring in one platform, without the complexity of managing a Prometheus stack.
FAQs
How does Atatus compare to Prometheus for metrics monitoring?
Atatus is a full-stack observability platform, while Prometheus is a specialized open-source tool for time-series metrics. Unlike Prometheus, Atatus supports application-level metrics alongside infrastructure monitoring. It offers a hosted solution, reducing setup complexity. Thus, Atatus is a best Prometheus alternative for unified monitoring.
Does Atatus support alerting and dashboards like Prometheus?
Yes, Atatus includes integrated alerting and pre-configured dashboards with real-time visualizations. Prometheus requires integration with Alertmanager and Grafana for similar capabilities. Atatus simplifies alert configuration with threshold-based and anomaly-based options. It stands out as a Prometheus competitor with built-in observability tools.
Is Atatus easier to set up and scale than Prometheus?
Atatus offers zero-maintenance setup with automatic scaling and data retention.
In contrast, Prometheus requires manual setup, storage scaling, and high availability configuration. Atatus removes operational burden, suitable for rapid deployment. This makes it an efficient Prometheus alternative for growing environments.
What use cases does Atatus cover that Prometheus does not?
Prometheus focuses on infrastructure metrics; Atatus supports APM, RUM, Logs, and Synthetic Monitoring. These capabilities enable end-to-end performance visibility, including frontend and backend. Atatus unifies multiple monitoring needs in one platform. It fills gaps where the Prometheus tool lacks native support.
Is Atatus better suited for application performance monitoring than Prometheus?
Yes, Atatus provides code-level insights, transaction tracing, and error tracking.
Prometheus lacks APM-specific features and does not support detailed request analysis. Atatus enables proactive application optimization. Hence, it is a superior Prometheus competitor for APM use cases.
Is Prometheus enough for full observability on its own?
Prometheus covers metrics well but doesn't natively handle logs or distributed tracing. Most teams add Grafana, Loki, and Jaeger (or similar) to fill those gaps or move to a unified platform like Atatus to avoid managing multiple systems
What's the best way to monitor Kubernetes if Prometheus alone isn't enough?
Prometheus is widely used for Kubernetes cluster metrics, but adding a platform that includes logs, traces, and APM like Atatus gives you visibility into application behavior inside the cluster, not just infrastructure-level numbers.
What does "full-stack observability" actually mean compared to Prometheus's scope?
Full-stack observability means metrics, logs, traces, and frontend performance are all correlated in one place. Prometheus covers the metrics layer; a platform like Atatus extends that to APM, logs, traces, and real user monitoring without requiring separate tools for each signal.
How does root cause analysis differ between Prometheus and Atatus?
With Prometheus, root cause analysis means manually cross-referencing PromQL queries and Grafana dashboards. Atatus automatically correlates metrics, logs, and traces, so the most likely source of an issue surfaces without requiring manual investigation across tools.
How long does it take to migrate from Prometheus to a platform like Atatus?
Most teams get initial dashboards running within minutes of installing the Atatus agent, since metrics, infrastructure, and APM data start flowing automatically. A full migration timeline including porting existing PromQL alerts depends on the number of services and alert rules in your current setup.
Can I keep using Prometheus-formatted metrics if I switch to a platform like Atatus?
Atatus supports OpenTelemetry-based collection, which makes it straightforward to bring over Prometheus-style metrics without rebuilding your instrumentation from scratch.
#1 Solution for Logs, Traces & Metrics
![]() APM
APM
![]() Kubernetes
Kubernetes
![]() Logs
Logs
![]() Synthetics
Synthetics
![]() RUM
RUM
![]() Serverless
Serverless
![]() Security
Security
![]() More
More

![Splunk vs Prometheus: A Side-by-Side Comparison [2025 Guide]](/blog/content/images/size/w960/2024/08/Datadog-vs-sentry--13-.png)