
AI-Powered Dashboards That Unify Your Entire Observability Stack
Atatus gives engineering teams a single AI-powered observability dashboard for logs, metrics, traces, and infrastructure with intelligent anomaly detection that cuts MTTR by up to 70%.
500B+
Log events processed daily
<60s
Avg anomaly detection time
99.95%
Platform uptime SLA
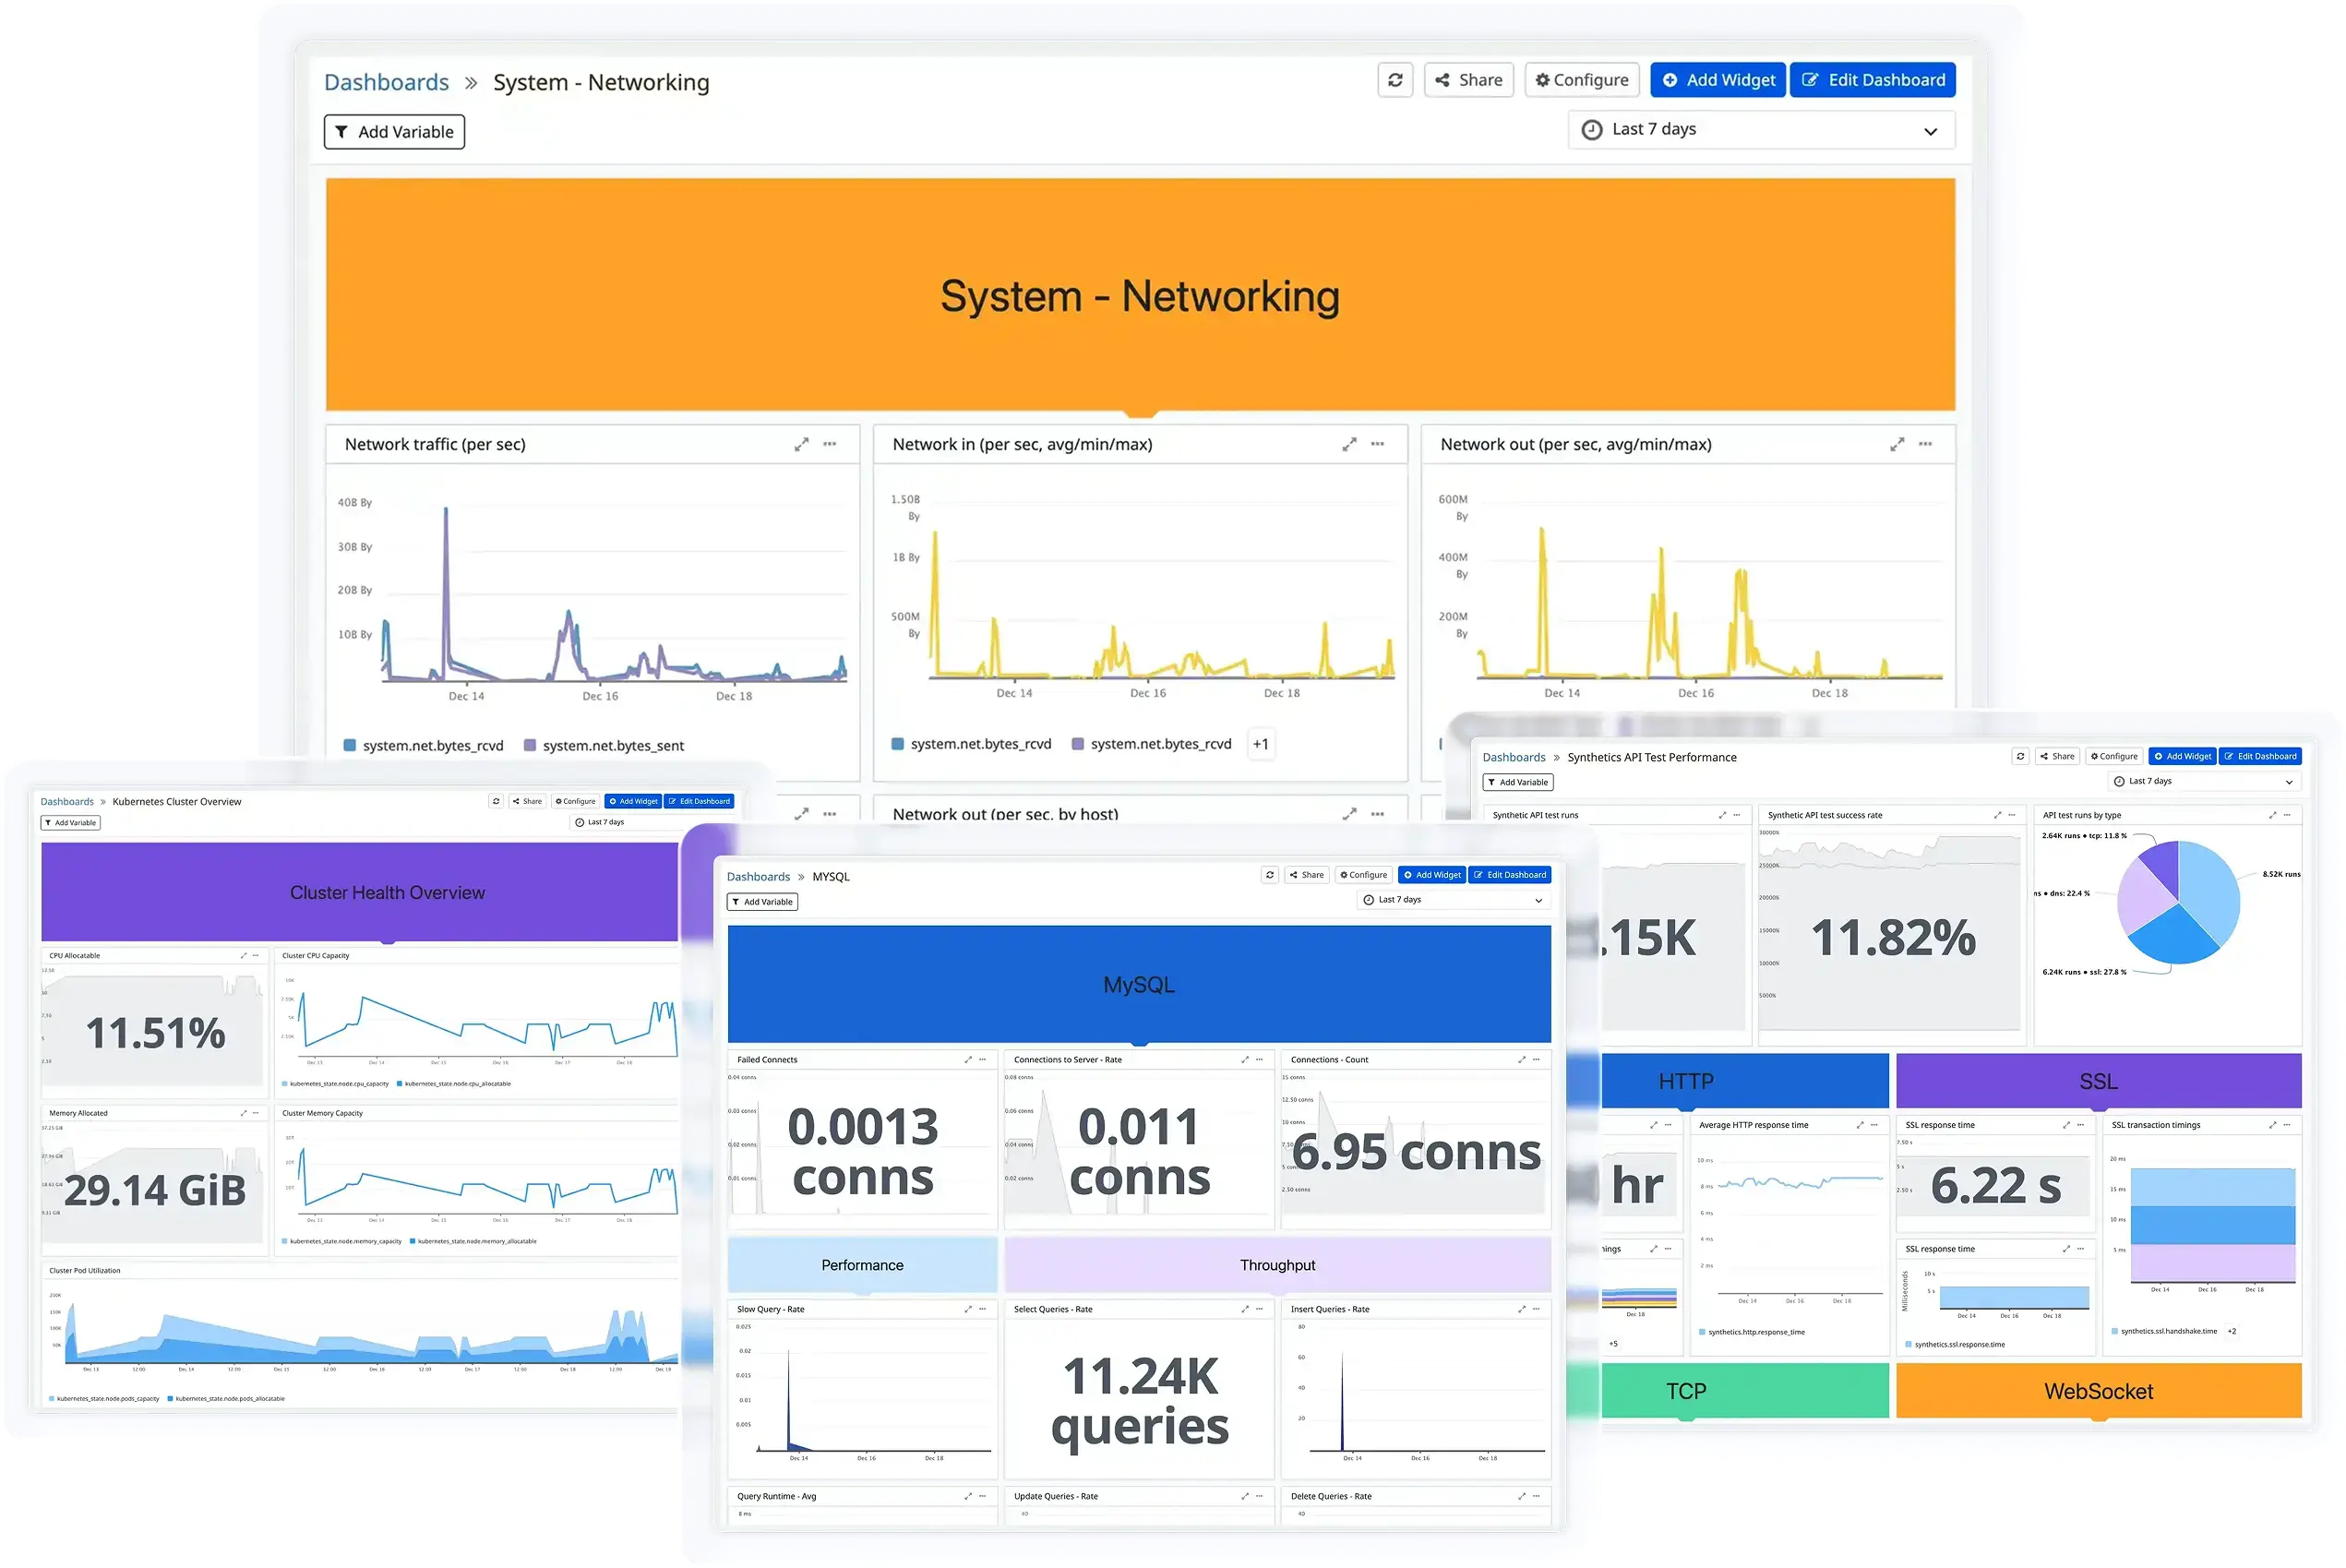
Everything Your Team Needs to See, Correlate, and Act
Atatus combines logs, metrics, traces, infrastructure health, and application performance into a single real-time monitoring dashboard with AI-assisted correlation built in from day one.
Real-Time Dashboards
Stream live telemetry from every service, node, and container into fully customizable dashboards. No refresh delays, your data is always current.
Cross-Signal Correlation
Link a spike in error rates to the exact trace, log, and deployment that caused it. Eliminate context-switching between disconnected tools.
Instant Anomaly Detection
AI baselines your system's normal behavior and alerts within seconds when something deviates before users report an issue.
Infrastructure Visibility
Monitor every host, container, pod, and cloud resource with infrastructure dashboards that surface capacity trends and saturation risks.
Team-Wide Collaboration
Share dashboards across SRE, DevOps, and engineering teams. Role-based views ensure every team sees exactly what they need.
Faster Root Cause Analysis
AI-generated summaries pinpoint the likely root cause in plain language, cutting investigation time from hours to minutes.
Purpose-Built Dashboards for Every Layer of Your Stack
From Kubernetes cluster health to executive-level SLO reports, Atatus provides specialized observability dashboards built for how engineering teams actually work.
Logs Dashboards
LogsVisualize log volume, error rates, and pattern distributions across all your services in real time. Filter, search, and correlate log data without leaving your dashboard context.
- Full-text log search with sub-second response
- Error rate trends by service, severity, and region
- Log-to-trace correlation in one click
- Scheduled log digest reports for teams
Metrics Dashboards
MetricsTrack system and custom business metrics with flexible visualization types including time series, heatmaps, gauge charts, and threshold alerts on a single operational dashboard.
- StatsD, Prometheus, and custom metric ingestion
- Multi-service metric overlays for fast comparison
- AI-calculated dynamic alert thresholds
- P50/P95/P99 percentile tracking
Traces Dashboards
TracesDistributed trace visualization with end-to-end request flows, service dependency maps, and latency breakdown, helping you pinpoint bottlenecks in microservices architectures.
- Full distributed trace waterfall view
- Service dependency topology maps
- Slow span detection and RCA suggestions
- OpenTelemetry and Jaeger compatible
Infrastructure Dashboards
InfrastructureMonitor CPU, memory, disk, network, and cloud resource health across every host, VM, and container. Purpose-built infrastructure monitoring dashboards that scale with your fleet.
- Host, VM, and bare-metal coverage
- Capacity forecasting with AI trend analysis
- Cloud-native AWS, GCP, Azure integrations
- Multi-cloud resource inventory views
Kubernetes Dashboards
KubernetesComplete Kubernetes dashboard monitoring from cluster and node health to pod-level metrics, namespace resource consumption, and deployment status tracking.
- Cluster, namespace, and pod-level metrics
- HPA scaling history and autoscaler insights
- Node pressure and eviction event tracking
- Multi-cluster observability in one view
Microservices Dashboards
MicroservicesMonitoring dashboards for microservices that map service relationships, track inter-service latency, and surface failure propagation paths before they cascade into outages.
- Service mesh topology visualization
- Upstream/downstream dependency tracking
- Error propagation path analysis
- Per-service SLO and error budget views
AI That Actually Reduces Investigation Time
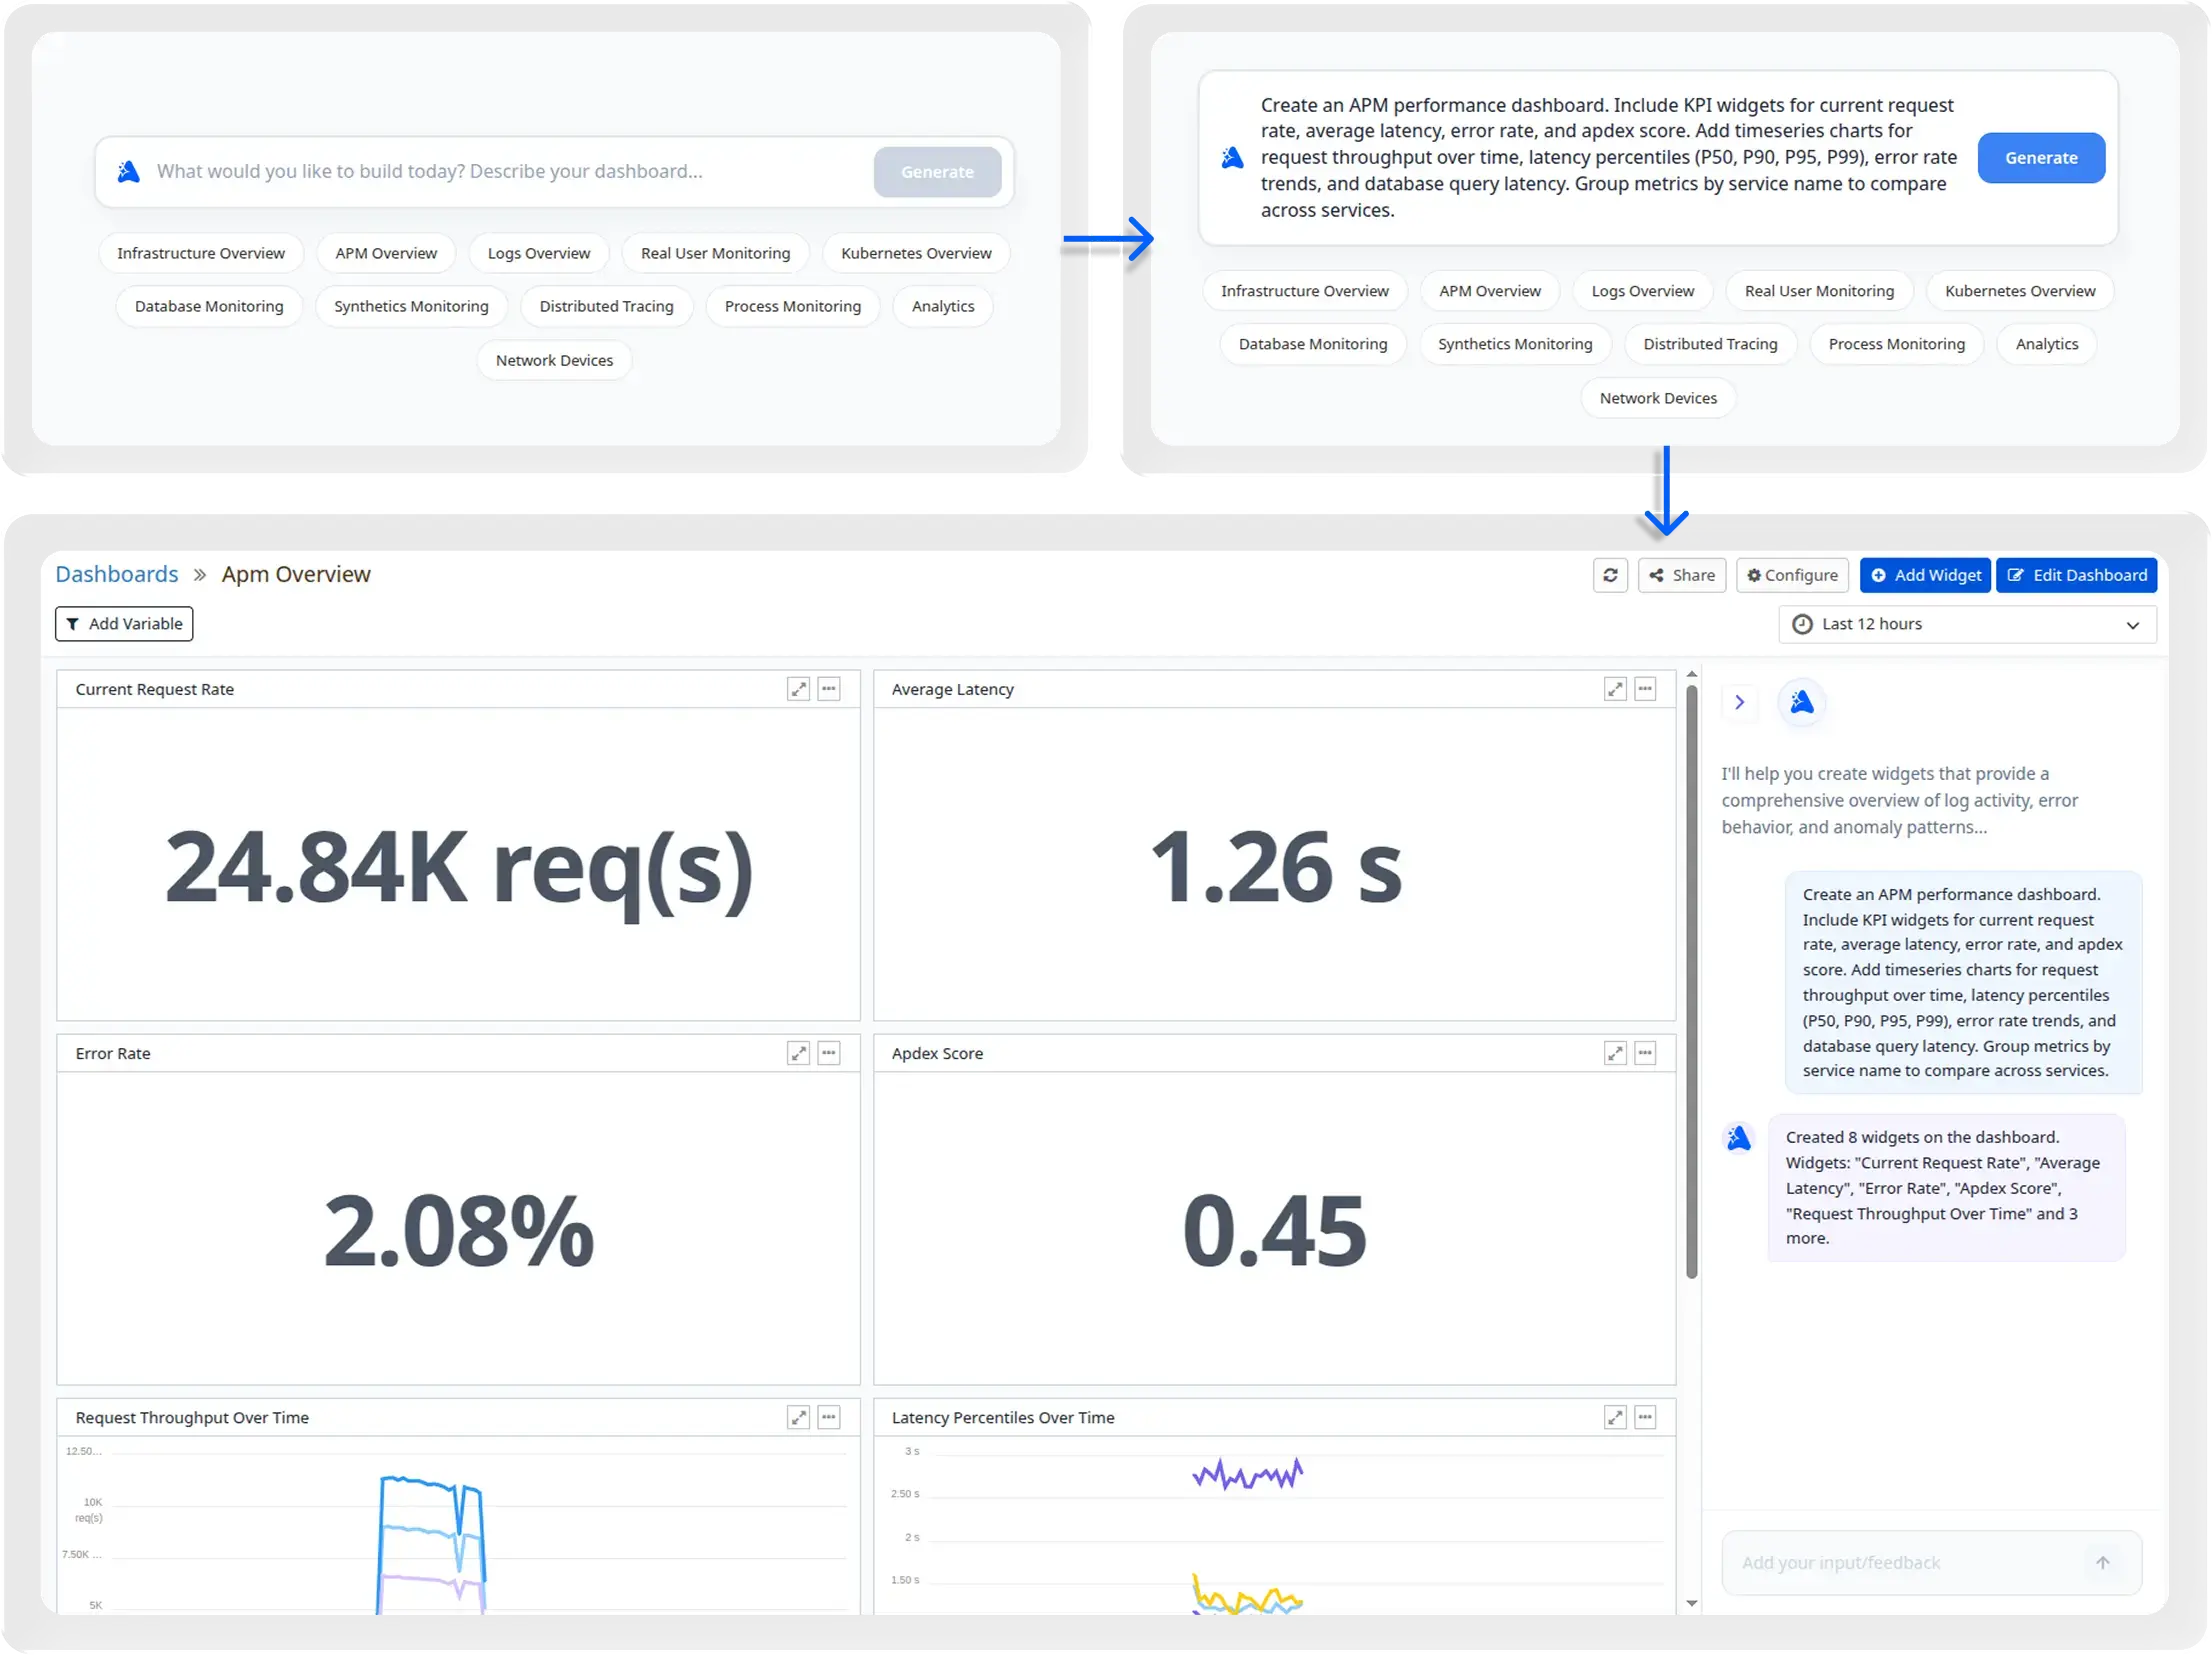
- Atatus doesn't just display your data, it reasons over it. AI-powered dashboards analyze telemetry patterns, detect anomalies, and surface actionable insights the moment something changes in your stack.
- Adaptive baselines learn your system's behavior across services, regions, and time windows. Catch regressions the moment they emerge, not after customers do.
- AI connects the dots between a slow trace, a burst of error logs, and a CPU saturation metric, giving you a unified incident timeline instantly.
- Get a plain-language summary of what changed in the last hour, what's at risk, and which services need attention without digging through 40 panels.
- Surface recurring failure patterns, seasonal traffic trends, and capacity headroom before they become incidents proactively.
Your Stack Deserves Better Than
Disconnected Tools
Teams using Datadog, New Relic, Grafana, or Dynatrace often face the same problems. Atatus was built to fix them.
Real-Time Data Visualization
Monitor live metrics with dynamic charts and graphs. Instantly spot anomalies, performance dips, and trends across your entire stack.
Custom Dashboard Builder
Create personalized layouts with drag-and-drop controls. Add widgets, save views, and share dashboards without writing code.
Collaborative Insights
Work together in live dashboards. Share views, add comments, tag teammates, and make data-backed decisions as a unified team.
Proven engineering impact
Numbers That Matter to Engineering Leadership
Fewer alert noise false positives
Adaptive AI baselines replace static thresholds, alerts fire only when behavior genuinely deviates, not when traffic spikes normally.
Average time to first dashboard
Auto-discovery detects your services, containers, and cloud resources and populates dashboards without manual configuration.
Faster incident root cause identification
Unified telemetry means engineers find the cause in the same tool they spotted the symptom, no tab-switching, no signal loss.
Start Visualizing in Under 5 Minutes
Three simple steps to unified observability dashboards. No credit card required.
Connect Data Sources
Link your applications, infrastructure, and services to Atatus. Auto-discover metrics and start visualizing data instantly.
Build Your Dashboard
Use drag-and-drop to arrange widgets. Add charts, graphs, and metrics that matter to your team. Save multiple views.
Share and Collaborate
Share dashboards with your team. Set permissions, add comments, and make data-backed decisions together in real-time.
"We cut our mean time to resolution from 47 minutes to under 8. The AI correlation feature alone saves our on-call engineers two to three hours per incident and we've completely replaced our old log tool, APM, and infrastructure monitoring with just Atatus."