Understanding High Cardinality and Its Role in Observability
If you've ever watched a dashboard freeze while loading a query, or opened a monitoring bill that jumped overnight, high cardinality is usually the reason. This guide explains what high cardinality and high-cardinality data actually mean, why cloud-native systems generate so much of it, where it shows up in metrics, logs, and traces, and how to manage it without losing the visibility that makes it valuable in the first place.
Table of Contents
- What Is High Cardinality?
- What Is High Cardinality Data?
- Why High Cardinality Matters in Modern Observability?
- Examples of High Cardinality
- What Problems Does High Cardinality Cause?
- High Cardinality in Metrics, Logs, and Traces
- High Cardinality in Kubernetes and Microservices
- Best Practices to Manage High Cardinality
- How Modern Observability Platforms Handle High Cardinality?
- How Atatus Helps You Monitor High-Cardinality Data?
- Frequently Asked Questions
What Is High Cardinality?
Cardinality simply means the number of unique values in a set. If a column called Gender only ever holds "Male" or "Female," its cardinality is 2. If a column called User ID holds a million distinct customer identifiers, its cardinality is a million. High cardinality is what you get when that second scenario is the norm rather than the exception, a field or dimension with so many unique values that treating each one individually becomes expensive to store, index, and query.
A simple analogy: imagine a bowl of M&Ms. If you're only tracking color, you might have six possible values, low cardinality. Now add type (plain, peanut, almond, pretzel, crispy) as a second dimension. Six colors times five types gives you thirty unique combinations. Add a "batch number" that's different for every bag, and your combinations explode into the thousands. That's cardinality growing from a manageable dataset into a high-cardinality one, purely by adding more granular, more unique dimensions.
In software systems, the same thing happens with identifiers: user IDs, session IDs, request IDs, container names. Each one is designed to be unique, which is exactly what makes it high cardinality.
What Is High Cardinality Data?
High cardinality data is telemetry, metrics, logs, or traces, where one or more labels (also called tags or dimensions) can take on a very large or effectively unbounded set of unique values. The relationship between these terms is worth untangling, since they're often used interchangeably but mean slightly different things:
- Data is the raw information your systems generate: a metric point, a log line, a trace span.
- Metrics are numeric measurements over time, like request count or latency.
- Labels/dimensions are the metadata attached to that data, such as
service=checkoutorpod=api-7d9f. - Unique values are the distinct values a given label can take, and the count of those values is the cardinality of that label.
So high cardinality describes the property (a large number of unique values), while high cardinality data describes the actual telemetry that exhibits that property. A metric with a user_id label is high-cardinality data because the user_id label itself has high cardinality. This distinction matters because it's the combination of labels, not any single one, that usually determines the total number of unique time series a monitoring system has to track.
Why High Cardinality Matters in Modern Observability?
High cardinality has always existed in data systems, but cloud-native infrastructure has made it the default rather than the exception. Here's why:
- Containers and Kubernetes assign unique, ephemeral names to every pod, container, and replica set. A single deployment event can generate hundreds of new label values that didn't exist minutes earlier.
- Microservices multiply the number of services, versions, and instances being monitored, and each combination of service, version, and instance is its own dimension.
- Ephemeral workloads, like serverless functions and autoscaled containers, are created and destroyed constantly, so the set of unique identifiers never stops growing.
- Distributed systems need to correlate a single request across dozens of services, which requires unique identifiers like trace IDs and request IDs by design.
In this environment, high cardinality isn't a mistake to be eliminated, it's a natural byproduct of the granularity needed to actually understand what's happening inside a distributed system. The real question isn't "how do we avoid high cardinality," it's "how do we manage it without breaking our observability stack."
See how much cardinality is costing your observability stack
Atatus correlates high-cardinality metrics, logs, and traces in one place, without the query slowdowns or surprise bills.
Examples of High Cardinality
Some of the most common high-cardinality fields in observability and application data include:
- User IDs - unique per customer, often millions of distinct values
- Session IDs - a new unique value per user session
- Request IDs - unique per API call or transaction
- Pod names - unique per Kubernetes pod, changing on every restart or scale event
- Container IDs - unique per container instance
- IP addresses - potentially millions of unique visitor IPs
- Device IDs - unique per device in IoT or mobile fleets
- Order IDs - unique per e-commerce transaction
- Trace IDs - unique per distributed request across services
Low Cardinality vs. High Cardinality: A Quick Comparison
| Attribute | Cardinality | Typical Unique Values |
|---|---|---|
| HTTP status code | Low | ~5–10 (200, 404, 500, etc.) |
| Environment | Low | ~3–5 (dev, staging, prod) |
| Region | Low–Medium | 10–30 |
| Service name | Medium | 10s–100s |
| Pod name | High | 1,000s, changes constantly |
| User ID | High | 10,000s–millions |
| Trace ID / Request ID | Very High | Effectively unbounded |
What Problems Does High Cardinality Cause?
High cardinality itself isn't the enemy, unmanaged high cardinality is. When monitoring tools weren't designed to handle it, common symptoms include:
- Metrics explosion - every unique label combination becomes a new time series, and the total count can grow combinatorially
- Expensive storage - more unique time series means more index entries and more disk usage
- Slower queries - scanning millions of unique series takes longer than scanning a handful of aggregated ones
- Dashboard latency - panels that query high-cardinality metrics can time out or take seconds to render
- Indexing issues - traditional B-tree indexes become less efficient as unique values scale into the millions
- Increased monitoring costs - platforms that bill per custom metric or time series see costs rise directly with cardinality
- Noisy alerts - alerting rules that fire per unique label value can generate alert floods during incidents
- Poor troubleshooting - paradoxically, cardinality that isn't organized well can bury the exact detail you need under noise
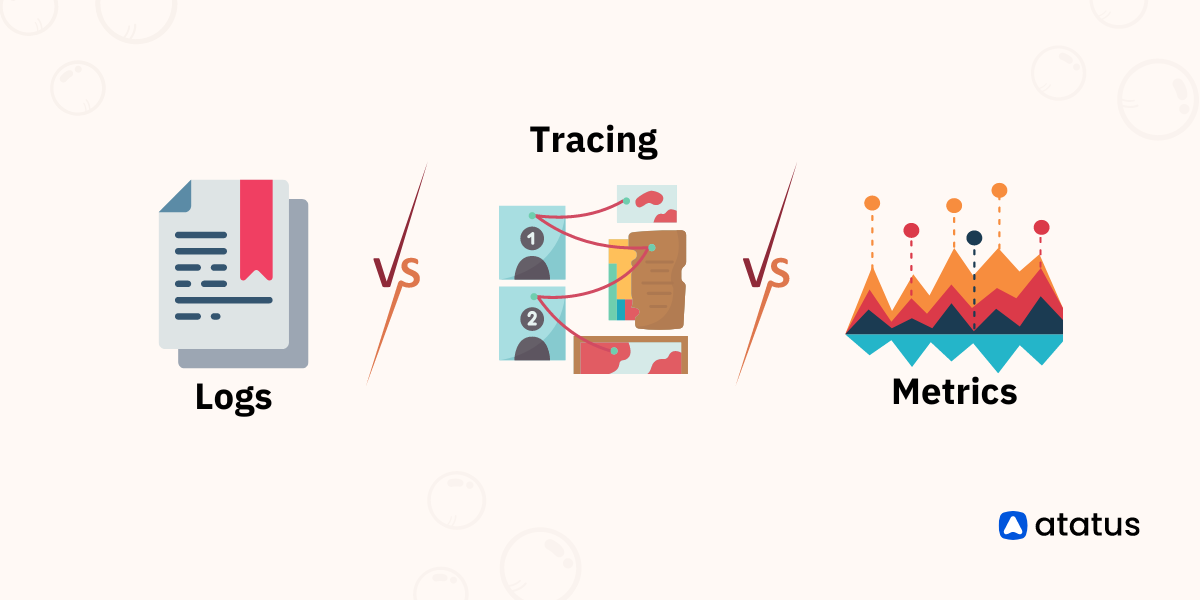
High Cardinality in Metrics, Logs, and Traces
High cardinality behaves differently depending on which telemetry type it touches, because each type is stored and queried differently.
High Cardinality in Metrics
Metrics are the most sensitive to cardinality because most metrics backends, including Prometheus-style time-series databases, create a distinct time series for every unique combination of label values. A metric like http_requests_total tagged with user_id can turn a single metric name into millions of individual series, straining memory and query performance. This is why metric labels should generally be reserved for low- or bounded-cardinality dimensions.
High Cardinality in Logs
Logs are naturally high-cardinality by design, every log line can carry a unique timestamp, request ID, or trace ID. The cost shows up in indexing and search: if every unique field value gets indexed the same way, log storage and search costs scale with cardinality. Structured logging with selective indexing helps keep high-cardinality log fields useful without indexing everything at full cost.
High Cardinality in Distributed Tracing
Traces are built around high cardinality, every trace ID and span ID is unique by definition, because the entire point of tracing is to follow one specific request through a distributed system. Trace backends are typically designed for this from the ground up, using sampling and trace-aware storage rather than treating every trace ID as a separate metric series.
High Cardinality in Kubernetes and Microservices
Kubernetes is one of the biggest drivers of high cardinality in modern observability. Pod names, container IDs, and replica set names are generated dynamically and change every time a pod restarts, scales, or gets rescheduled. A cluster running autoscaling workloads across many namespaces and nodes can generate a combinatorial explosion of unique label values, service name × namespace × node × pod × container can easily reach into the millions of unique combinations at scale.
Microservices architectures compound this further: each service, version, and instance adds another dimension, and correlating a request across a dozen microservices requires cardinality-heavy identifiers like trace IDs by necessity. This is why Kubernetes and microservices monitoring in particular demands an observability platform built for high-cardinality workloads from the start, not one that treats it as an edge case.
Best Practices to Manage High Cardinality
You don't need to eliminate high cardinality, you need to manage it intentionally. Some proven strategies:
- Use meaningful, bounded labels - reserve metric labels for dimensions with a known, limited set of values (environment, region, status code) and keep unbounded identifiers like user ID out of metric labels.
- Apply sampling - for traces and verbose logs, sample a representative subset instead of capturing every single event at full fidelity.
- Aggregate before storing - pre-aggregate high-cardinality data into rollups (e.g., per-minute averages) where per-request granularity isn't needed.
- Set retention policies - keep high-cardinality raw data for a shorter window and downsample or archive older data.
- Choose the right indexing strategy - use selective or partial indexing on high-cardinality log and trace fields rather than indexing every field identically.
- Establish tag governance - define naming conventions and approval processes for new metric labels so cardinality growth is intentional, not accidental.
- Follow OpenTelemetry best practices - use OpenTelemetry's semantic conventions to keep attributes consistent, and route high-cardinality fields to traces and logs (where they belong) rather than metric labels.
How Modern Observability Platforms Handle High Cardinality?
Purpose-built observability platforms handle high cardinality through a combination of architectural choices:
- Compression - columnar or time-series-optimized storage that compresses repetitive data efficiently
- Smart indexing - indexing strategies designed for high-dimensional data instead of traditional relational indexes
- Aggregation - the ability to roll up high-cardinality data on the fly without losing the option to drill down
- Intelligent storage tiers - hot storage for recent, high-cardinality data and cheaper cold storage for older data
- Query optimization - query engines that can filter and scan large cardinality spaces quickly
- Real-time analytics - the ability to slice by any label, including high-cardinality ones, without pre-defining every possible query
How Atatus Helps You Monitor High-Cardinality Data?
Atatus is a full-stack observability platform built to handle exactly this kind of granular, high-cardinality telemetry without the performance cliffs or cost spikes that come with legacy tooling.
- Application Performance Monitoring (APM) that tracks per-transaction, per-user detail without forcing you to sacrifice granularity for speed
- Distributed Tracing built to handle unique trace IDs across microservices, so you can follow one request end to end
- Infrastructure and Kubernetes Monitoring that keeps pace with ephemeral pods, containers, and autoscaling clusters
- Log Monitoring with selective indexing so high-cardinality fields stay searchable without indexing every field at full cost
- Real User Monitoring (RUM) for per-session, per-device visibility into real user experience
- Native OpenTelemetry support, so you can route high-cardinality attributes where they belong without re-instrumenting
- Fast querying across high-cardinality dimensions, so dashboards stay responsive even at scale
- Unified observability that correlates metrics, logs, and traces in one view instead of three separate tools
- Cost-efficient pricing that doesn't punish you for the granularity high cardinality provides
- Root cause analysis that uses high-cardinality detail to pinpoint the exact user, pod, or request behind an incident
- Developer-friendly dashboards that make it easy to slice by any label, high-cardinality or not, without pre-defining every view
If your team is watching dashboards slow down, queries time out, or your observability bill creep up as your infrastructure scales, that's usually high cardinality outgrowing your current stack, not a reason to throw away the detail. See how Atatus manages high-cardinality observability without the tradeoffs.
Conclusion
High cardinality isn't a flaw in your data, it's a byproduct of the granularity that modern, cloud-native systems need to be observable at all. Kubernetes, microservices, and distributed tracing all generate high-cardinality data by design, and trying to eliminate it usually means losing the exact detail that makes troubleshooting fast. The better path is managing it deliberately: bounded metric labels, sampling, selective indexing, tag governance, and an observability platform architected to handle high-cardinality metrics, logs, and traces without the performance or cost tradeoffs of legacy tools.
Ready to see your high-cardinality data without the slowdown?
Correlate metrics, logs, and traces in one platform built for Kubernetes-scale cardinality.
Frequently Asked Questions
What is high cardinality?
High cardinality describes a dataset or field with a very large number of unique values relative to the total number of records. Common examples in observability include user IDs, pod names, and trace IDs.
What is high cardinality data?
High cardinality data is telemetry, metrics, logs, or traces, that contains dimensions or labels with many distinct values. Each unique combination can create a separate time series, growing storage and indexing needs quickly.
Is high cardinality bad?
No, not inherently. High cardinality is what enables granular, per-request visibility. It only becomes a problem when your monitoring stack can't efficiently index, store, or query that granularity.
Why is high cardinality expensive?
Every unique label combination can create a new time series. Platforms that bill per time series or custom metric see costs rise directly with cardinality, and databases not built for it need more compute and memory to stay fast.
High cardinality vs. low cardinality — what's the difference?
Low-cardinality fields have a small, fixed set of values (like HTTP status code). High-cardinality fields have a large or unbounded set of values (like user ID), multiplying the number of unique time series your system tracks.
How does high cardinality affect Prometheus?
Prometheus stores each unique label combination as its own time series in memory. High-cardinality labels can cause memory pressure, slow queries, and instability in the Prometheus TSDB if left unmanaged.
Why does Kubernetes create high-cardinality data?
Kubernetes constantly creates and destroys ephemeral, uniquely named resources, pods, containers, replica sets. Every restart or scale event introduces new label values, naturally driving up cardinality.
What are examples of high-cardinality metrics?
Metrics tagged with user ID, session ID, request ID, pod name, or full request URL are classic examples, since each tag can take thousands or millions of distinct values.
What are examples of high-cardinality logs?
Logs including trace ID, session ID, IP address, or raw request payloads are high-cardinality. Indexing every unique value in these fields can significantly raise log storage and search costs.
How do you reduce high cardinality?
Aggregate or bucket unbounded labels, apply sampling to traces and logs, set retention and tag governance policies, and keep very high-cardinality identifiers like user ID in logs or traces rather than metric labels.
Does OpenTelemetry create high-cardinality data?
OpenTelemetry doesn't cause high cardinality itself, but its flexible attribute model makes it easy to attach high-cardinality fields to spans and metrics. Following its semantic conventions keeps cardinality intentional.
Which observability tools handle high-cardinality data best?
Platforms built with efficient time-series storage, smart indexing, and query optimization handle high-cardinality workloads best. Atatus is built to correlate high-cardinality metrics, logs, and traces without the slowdowns or cost spikes common in legacy tools.
#1 Solution for Logs, Traces & Metrics
![]() APM
APM
![]() Kubernetes
Kubernetes
![]() Logs
Logs
![]() Synthetics
Synthetics
![]() RUM
RUM
![]() Serverless
Serverless
![]() Security
Security
![]() More
More

![New Relic vs Splunk - In-depth Comparison [2026]](/blog/content/images/size/w960/2024/10/Datadog-vs-sentry--19-.png)