RabbitMQ Monitoring: Metrics, Tools, and Best Practices

RabbitMQ is a widely-used open-source messaging broker that facilitates message-oriented middleware for modern applications. It serves as a reliable and scalable mechanism for managing communication channels and messages between distributed applications.
However, as modern distributed systems become increasingly complex, monitoring RabbitMQ's performance, availability, and other critical metrics becomes crucial for seamless operations. This is where RabbitMQ monitoring metrics come into play.
RabbitMQ monitoring metrics comprise a set of metrics and statistics that provide insights into RabbitMQ's behavior and performance. These metrics help to identify potential issues, improve system reliability, availability, and performance.
With RabbitMQ monitoring metrics, DevOps teams can proactively detect and address anomalies, optimize resource utilization, and prevent system downtime.
In this blog post, we will explore RabbitMQ monitoring metrics and delve into the essential metrics that should be monitored. We will also cover how these metrics can be leveraged to troubleshoot issues and how to configure RabbitMQ to monitor these metrics effectively.
Table of Content
- What is RabbitMQ?
- Working of RabbitMQ
- Need for RabbitMQ Monitoring
- Key Metrics to monitor RabbitMQ
- RabbitMQ Monitoring Tools
- RabbitMQ Monitoring: Best Practices
What is RabbitMQ?
RabbitMQ is a message broker software that allows different applications to communicate with each other by exchanging messages. It acts as a mediator between different systems and applications, allowing them to communicate and exchange data in a reliable and scalable way.
It is based on the Advanced Message Queuing Protocol (AMQP), which is a standard communication protocol for message-oriented middleware, and also supports other protocols like MQTT, STOMP, and HTTP.
The fundamental concept of RabbitMQ is the queue, which stores messages and delivers them to one or more subscribed consumers. This allows for asynchronous and distributed communication, without the sender needing to know the specific details of the receiver.
In addition to message queuing, RabbitMQ also offers advanced features such as message routing, persistence, clustering, and high availability. These capabilities make RabbitMQ a popular choice for building messaging systems that are both scalable and fault-tolerant.
Working of RabbitMQ
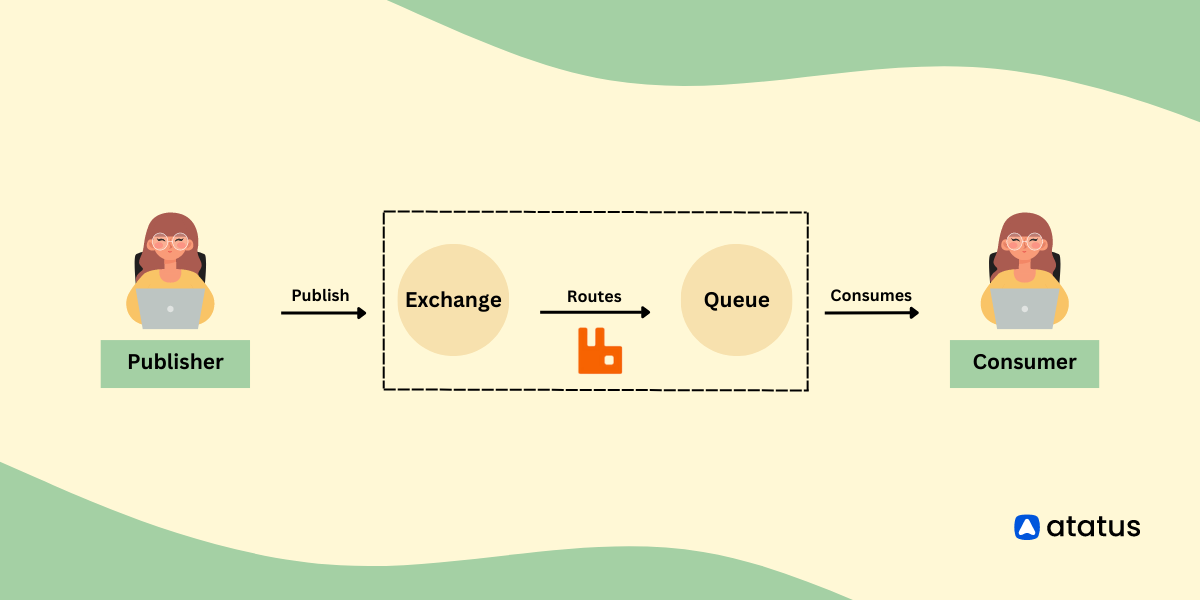
In the below diagram shows the following components and features of the RabbitMQ system:
- Producer: This component creates and sends messages to an exchange. A message can contain any data that needs to be communicated between systems.
- Exchange: This component receives messages from producers and routes them to the appropriate queues based on a routing key. The exchange can be configured to use different routing algorithms like direct, topic, or fanout.
- Queue: This component stores messages until they are consumed by a consumer. Queues can be bound to one or more exchanges using a binding key. The binding key specifies the criteria for messages that should be routed to the queue.
- Consumer: This component subscribes to one or more queues and receives messages from them. Consumers can be implemented in any programming language that supports AMQP.
The workflow involves the following steps:
- The producer creates and sends a message to an exchange.
- The exchange receives the message and routes it to one or more queues based on a routing key.
- Queues receive messages and store them until they are consumed by a consumer.
- Consumers subscribe to one or more queues and receive messages from them.
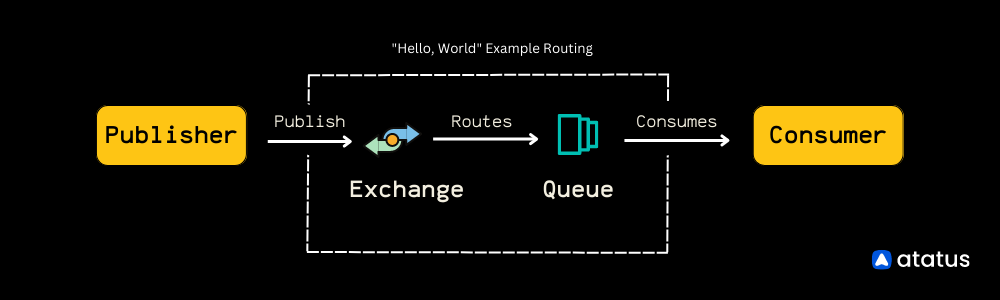
Here's a code example in Node.js that demonstrates how to implement the "Hello World" example using RabbitMQ:
const amqp = require('amqplib');

// Connect to RabbitMQ
amqp.connect('amqp://localhost').then(function(connection) {
  // Create a channel
  return connection.createChannel().then(function(channel) {
    // Create a queue called "hello"
    const queue = 'hello';
    channel.assertQueue(queue, { durable: false });

    // Define a callback function to process messages received by the consumer
    const callback = function(msg) {
      console.log("Received message: %s", msg.content.toString());
    };

    // Start consuming messages from the "hello" queue
    channel.consume(queue, callback, { noAck: true }).then(function() {
      console.log("Waiting for messages...");
    });

    // Send a message to the "hello" queue
    const message = 'Hello World';
    channel.sendToQueue(queue, Buffer.from(message));
    console.log("Sent message: %s", message);
  });
}).catch(function(err) {
  console.error("Error:", err);
});
In this example, a connection is established to RabbitMQ and a channel is created. A queue called "hello" is created and a message containing the text "Hello World" is sent to the queue. A consumer subscribes to the "hello" queue and receives the message from RabbitMQ. When the consumer receives the message, it prints the message to the console.
To run this example, you will need to install the amqplib library using npm or another package manager.
Need for RabbitMQ Monitoring
Effective monitoring of RabbitMQ is crucial for ensuring the reliability and smooth functioning of your messaging system.
There are several reasons why monitoring RabbitMQ is important, including:
- Performance Optimization: By monitoring RabbitMQ, you can identify performance bottlenecks, such as queues that are filling up faster than they can be processed. This information can help you optimize your system to improve its performance and scalability.
- Availability Assurance: RabbitMQ monitoring enables you to detect and resolve issues that could potentially cause the messaging system to become unavailable or crash. This helps you prevent downtime and ensures that your messaging system is always available to process messages.
- Debugging Support: Monitoring RabbitMQ can help you identify and fix issues that are causing messages to be lost or not processed correctly. This ensures that your messaging system functions as expected and that messages are processed correctly.
- Capacity Planning: By monitoring RabbitMQ, you can gain insights into how much capacity is left in your messaging system, allowing you to plan for future growth. This helps you ensure that your system has sufficient resources to handle increased message volumes.
Key Metrics to monitor RabbitMQ
Health checks are the primary metrics used for monitoring a RabbitMQ system to determine the health of a node. However, what constitutes a healthy node varies depending on the project requirements. Some projects may consider a node with an Erlang VM to be healthy, while others may require it to host a specific service like a producer.
While health checks provide useful information, they have limitations as they mainly monitor system-level factors instead of RabbitMQ properties. Therefore, to understand the overall performance of RabbitMQ, it's important to record metrics from all nodes in the cluster for longer periods of time.
The metrics gathered from RabbitMQ nodes can be categorized into three main categories:
Examining these metrics individually may not provide sufficient details on the system's condition. However, combining multiple measures can provide a wealth of information, enabling effective troubleshooting of any issues that may arise.
1. Infrastructure or Kernal Metrics
Infrastructure or Kernel Metrics are an important aspect of RabbitMQ monitoring that involves tracking the underlying hardware and operating system resources that the messaging system is running on. These metrics provide valuable insight into the overall health and performance of RabbitMQ by identifying how resources are being utilized and where there might be potential bottlenecks.
To monitor the system effectively, there are several Infrastructure or Kernel Metrics that are commonly tracked in RabbitMQ, including:
- CPU Usage: This metric measures the percentage of CPU resources used by the system. High CPU usage can indicate that RabbitMQ is overloaded and struggling to process messages efficiently.
- Memory Usage: This metric measures the amount of memory used by the system. High memory usage can indicate that RabbitMQ is under a heavy load and unable to keep up with incoming messages.
- Disk Usage: This metric measures the amount of disk space used by the system. High disk usage can indicate that RabbitMQ is processing a large volume of messages or there may be issues with message retention.
- Network Utilization: This metric measures the amount of network bandwidth used by the system. High network utilization can indicate that RabbitMQ is processing a large number of messages or that there are problems with network connectivity.
2. RabbitMQ Metrics
RabbitMQ Metrics are the data points and statistics collected from the RabbitMQ system to monitor and evaluate its health, performance, and resource usage. These metrics offer insights into how RabbitMQ is processing messages, how exchanges and queues are being utilized, and identify any underlying issues or bottlenecks that may exist.
i.) Node Metrics
Node Metrics are a set of metrics that are specific to each node within a RabbitMQ cluster. They help in monitoring the health and performance of each node.
Some examples of node metrics are as follows:
mem_used: The total amount of memory used by the node.mem_limit: The high watermark for memory usage.mem_alarm: A boolean value indicating whether a memory alarm is in effect.disk_free_limit: The low watermark for free disk space.disk_free_alarm: A boolean value indicating whether a disk alarm is in effect.fd_total: The total number of file descriptors available on the node.fd_used: The number of file descriptors currently in use on the node.io_file_handle_open_attempt_count: The number of attempts to open a file handle.sockets_total: The total number of sockets available on the node.sockets_used: The number of sockets currently in use on the node.message_stats.disk_reads: The number of disk reads performed by the message store.message_stats.disk_writes: The number of disk writes performed by the message store.cluster_links: The number of inter-node communication links.gc_num: The number of times the garbage collector has run.gc_bytes_reclaimed: The number of bytes reclaimed by the garbage collector.proc_total: The Erlang process limit for the node.proc_used: The number of Erlang processes currently in use on the node.run_queue: The length of the Erlang runtime run queue.
ii.) Queue Metrics
Metrics related to queues in RabbitMQ are specific to each queue and can provide valuable information on the queue's health and performance. These metrics can be used to monitor various aspects of the queue.
Some examples of queue metrics are as follows:
Memory: This metric indicates the amount of memory used by the queue.messages: This metric indicates the total number of messages in the queue, including both ready and unacknowledged messages.messages_ready: This metric indicates the number of messages in the queue that are ready to be delivered to consumers.messages_unacknowledged: This metric indicates the number of messages in the queue that have been delivered to consumers but have not yet been acknowledged.message_stats.publish: This metric indicates the number of messages published to the queue recently.message_stats.publish_details.rate: This metric indicates the rate at which messages are being published to the queue.message_stats.deliver_get: This metric indicates the number of messages delivered to consumers from the queue recently.message_stats.deliver_get_details.rate: This metric indicates the rate at which messages are being delivered to consumers from the queue.message_stats.*: This includes other message statistics for the queue, such as the number of acknowledgements, redeliveries, and messages expired.
iii.) Cluster-wide Metrics
Metrics that provide an overview of the RabbitMQ cluster are called cluster-wide metrics. They offer insights into the performance and health of the entire messaging system.
Examples of these metrics are:
cluster_name: The name of the RabbitMQ cluster.message_stats: Cluster-wide message statistics, including publish rates, delivery rates, and other message-related data points.object_totals.connections: The total number of connections across all nodes in the cluster.object_totals.channels: The total number of channels across all nodes in the cluster.object_totals.queues: The total number of queues across all nodes in the cluster.object_totals.consumers: The total number of consumers across all nodes in the cluster.queue_totals.messages: The total number of messages across all queues on all nodes in the cluster, including both ready and unacknowledged messages.queue_totals.messages_ready: The number of messages ready for delivery across all queues on all nodes in the cluster.queue_totals.messages_unacknowledged: The number of unacknowledged messages across all queues on all nodes in the cluster.message_stats.publish: The number of messages published recently across all nodes in the cluster.message_stats.publish_details.rate: The rate at which messages are being published across all nodes in the cluster.message_stats.deliver_get: The number of messages delivered to consumers recently across all nodes in the cluster.message_stats.deliver_get_details.rate: The rate at which messages are being delivered to consumers across all nodes in the cluster.message_stats.*: Other message statistics not covered by the above metrics.
3. Application Metrics
Application metrics can help pinpoint issues with specific components, such as publishers or consumers, and identify bottlenecks or slowdowns in downstream services. Some client libraries and frameworks provide built-in metrics collectors, while others require developers to track metrics in their code.
Examples of application metrics that are relevant to most systems include:
- Connection opening rate,
- Channel opening rate,
- Publishing rate, delivery rate,
- Positive/negative delivery acknowledgement rate,
- Delivery processing latency (mean and 95th percentile)
RabbitMQ Monitoring: 6 Best Tools
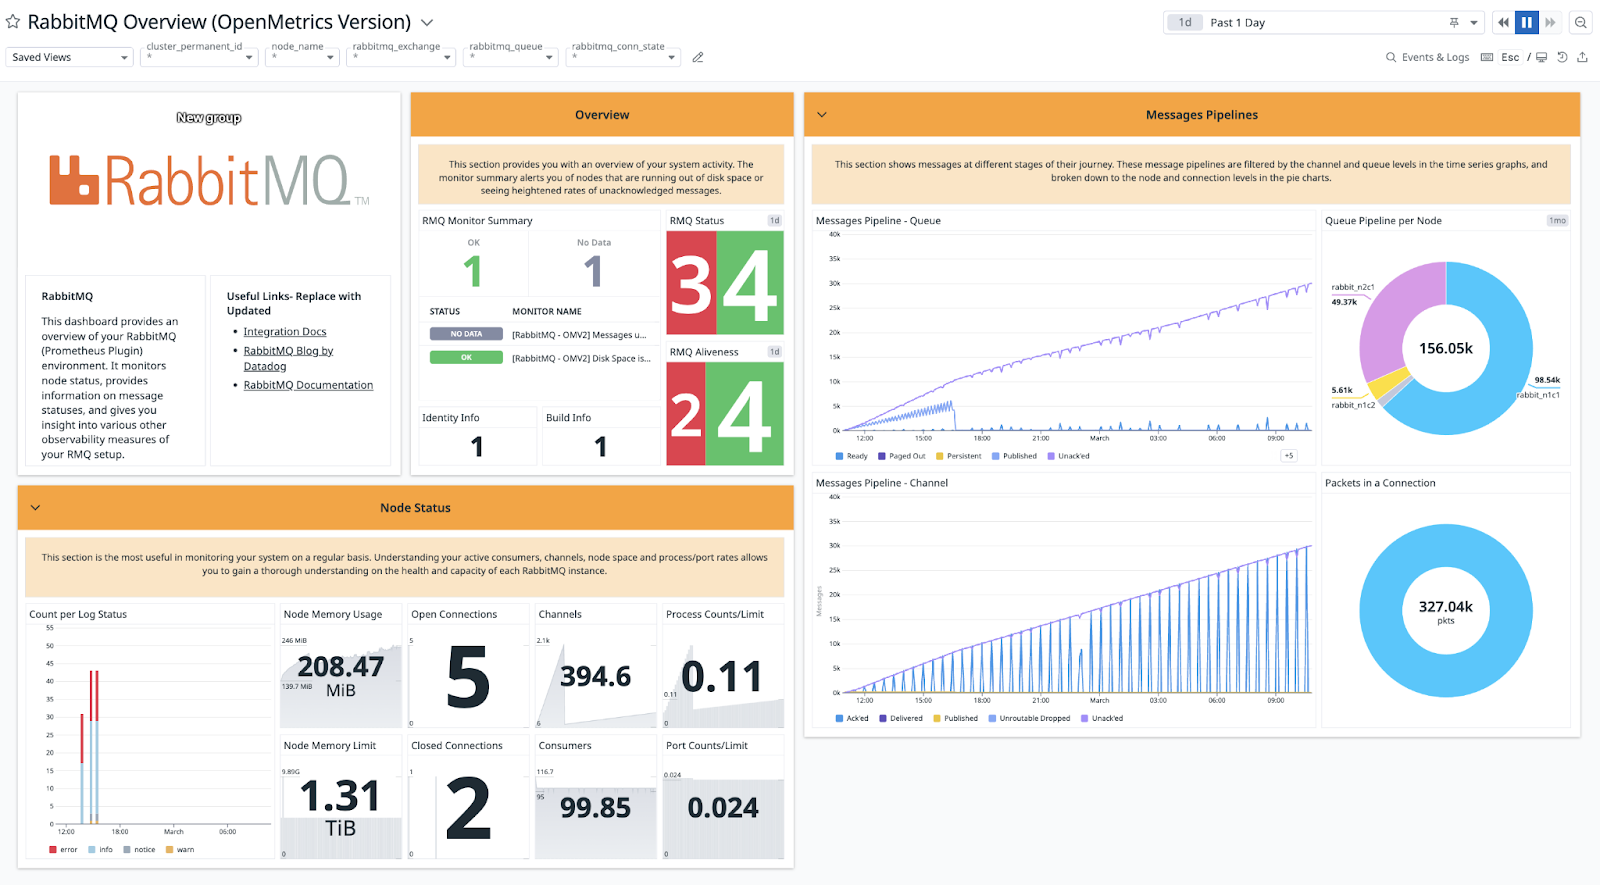
1. RabbitMQ Management Plugin
The RabbitMQ Management Plugin is a built-in monitoring tool that comes with the RabbitMQ message broker.
The plugin provides a web-based management interface that allows users to view queue and connection metrics, monitor message rates, and configure exchanges and queues. The management plugin is easy to use and provides detailed metrics on the performance of the RabbitMQ broker.
2. Atatus
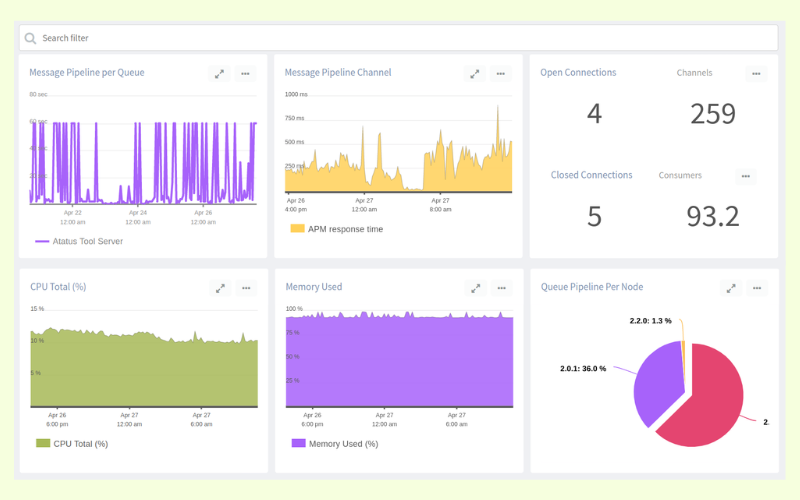
Atatus is a cloud-based application performance monitoring solution that offers a comprehensive suite of tools for RabbitMQ monitoring. It provides real-time insights into the performance and health of your RabbitMQ message broker system.
Features
- Real-time monitoring: Atatus provides real-time visibility into your RabbitMQ message broker system, so you can detect issues and take action before they affect your application.
- Queue monitoring: Atatus lets you monitor the size of your queues, the number of messages in each queue, and the rate at which messages are being added and removed from each queue.
- Connection monitoring: Atatus tracks the number of connections to your RabbitMQ server, along with the number of channels and the rate of messages being published and consumed.
- Alerting: Atatus can send you alerts via email, SMS, or Slack when certain metrics exceed a certain threshold or when there are other issues with your RabbitMQ system.
- Historical analysis: Atatus stores historical data on message throughput, latency, and error rates, so you can identify trends and make informed decisions about capacity planning and resource allocation.
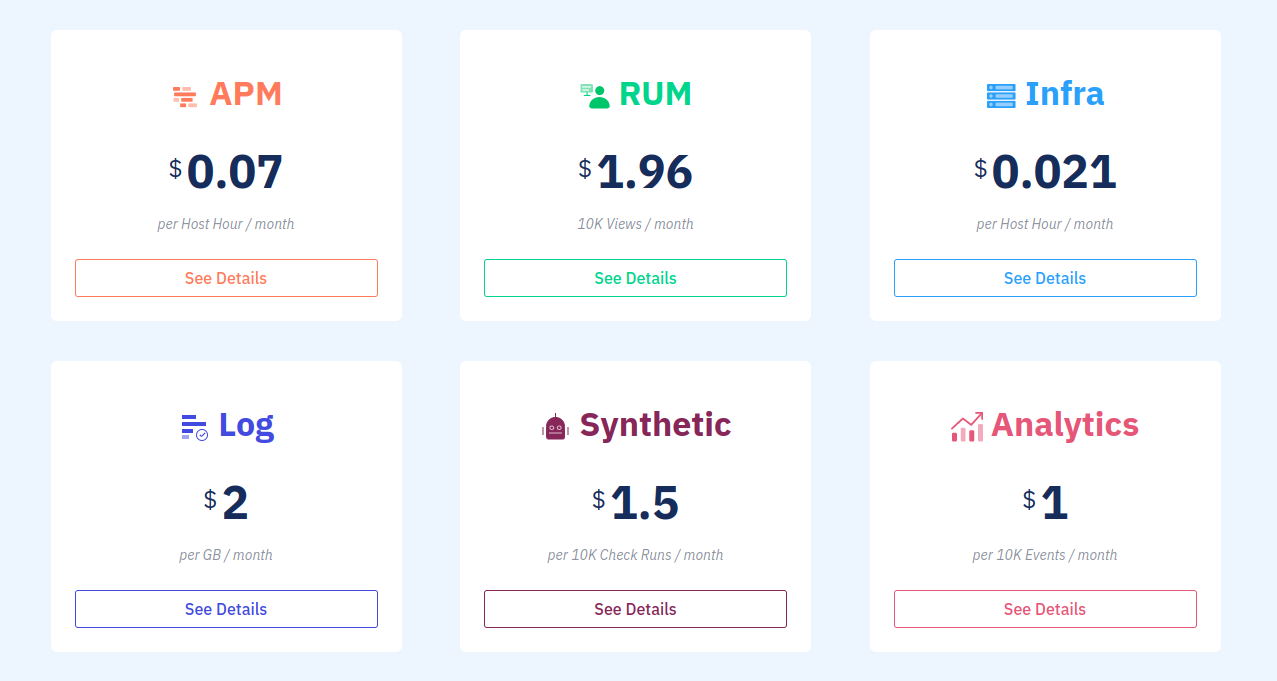
Pricing
Atatus pricing is based on a subscription model, with different plans available depending on your needs. The plans start from $0.07 per Host hour/month for APM, $1.96, 10k Views / month for Browser monitoring, $0.021 per Host hour/month for Infra, $2 per GB / month for Logs, $1.5 per 10k Check runs / month for Synthetic and $1 per 10k Events / month for Analytics.
3. AWS Cloud Watch
AWS CloudWatch is a tool that you will instantly recognize and feel comfortable using if you are familiar with AWS. CloudWatch is where most AWS service logs and metrics are collected. It is simple to link with a wide range of outside services and features a robust log-search feature that makes metric collecting simple.
Similar to other tools on this list, setting up AWS CloudWatch to gather metrics from RabbitMQ requires a fair amount of configuration before data can start to flow. However, anyone who has set up any other AWS service shouldn't have any issues.
One configuration file splits the metrics into categories for exchange, queue, connection, and channel, making configuration simple. This configuration file instructs CloudWatch on which metrics need to be gathered. As anticipated, CloudWatch is able to get practically all RabbitMQ metrics.
Advantages
- Good compatibility with other AWS services
- Has automated Lambda trigger functionality based on rules
- Easy to use and set up, but only within AWS
Disadvantages
- Lacks compatibility with providers other than AWS
- There are few chart possibilities for dashboards.
- Users are dissatisfied with UI/UX
Pricing
For the first 10,000 metrics each month, it costs $0.30 per metric.
4. Datadog
With the help of the well-liked system monitoring program Datadog, you can keep an eye on both RabbitMQ and system metrics. Simply install Datadog Agents, and they'll take care of installing the necessary programs so you can monitor RabbitMQ. The Datadog Agents will then need to be configured in order to link from the RabbitMQ infrastructure to the Datadog dashboard.
The majority of system metrics as well as practically all metrics accessible in RabbitMQ may be collected by Datadog. RabbitMQ is not supported by the well-known Watchdog function, which employs algorithms to find and notify you of possible system and application faults. For a straightforward RabbitMQ cluster, the Datadog dashboard is enough even without the Watchdog function.
Runbook is one of Datadog's unique features. This serves as a general guide that instructs team members on how to respond to alerts and issues while also giving the problem's historical background.
Advantages
- It is simple to respond to alarms using Runbook.
- Alerting with features for period digests and email templates
- adequate visualization
Disadvantages
- The user interface might be difficult to navigate.
- The documentation is inadequate.
- It might be difficult to set up.
- Only offers one premium plan
Pricing
$15 per host per month is the starting price.
5. Solarwinds
With out-of-the-box monitoring templates for RabbitMQ nodes on Linux/Unix and Windows, SolarWinds Server & Application Monitor (SAM) simplifies RabbitMQ monitoring. These templates are customisable and can assist you in monitoring individual instances that cover essential RabbitMQ performance data like as memory utilisation, free disc space, and uptime.
SAM instantly finds your environment and is designed to begin you monitoring your infrastructure in minutes, with over 1,200 monitoring templates available. Stop switching between monitoring tools. SAM centralises server and application performance and health monitoring across multiple devices, servers, and apps.
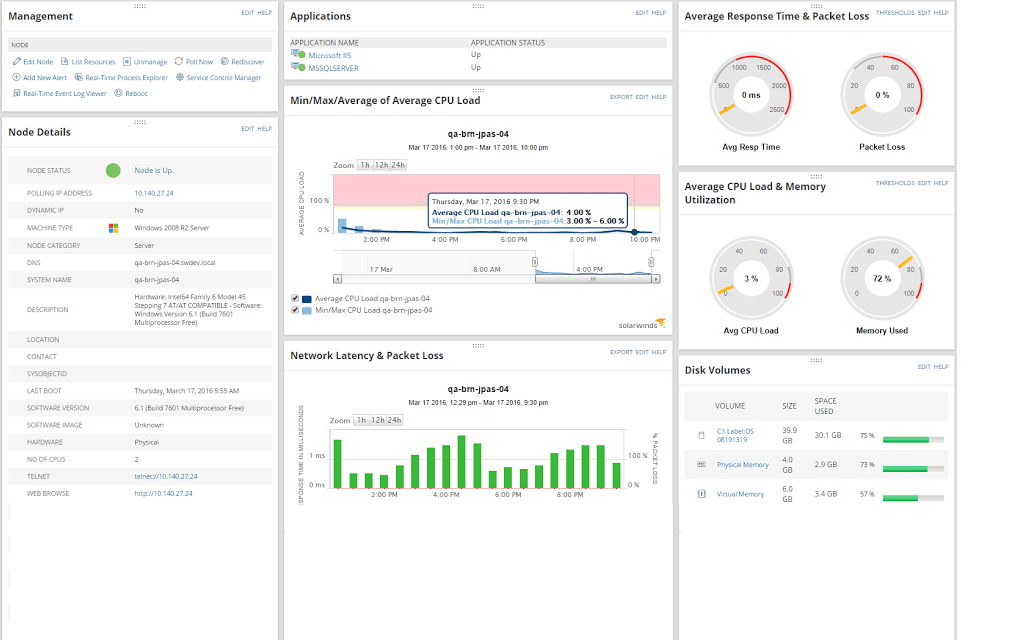
RabbitMQ has a significant benefit in that it exposes statistics for all of its primary components. If you understand what to look for, this can help with troubleshooting.
However, many teams spend many hours collecting important metrics in order to get to the bottom of problems. SolarWinds SAM can monitor essential RabbitMQ metrics such as Exchanges, Bindings, Connections, and Messages in Queues in real time.
SAM has customisable alarms that may send notifications anytime an issue related to your RabbitMQ instances emerges. SAM is intended to assist you in determining which nodes are affected, this can considerably minimise the amount of time spent troubleshooting.
6. Sematext
Sematext is a monitoring programme that collects metrics from a wide range of systems and applications. It effortlessly interfaces with a RabbitMQ cluster to gather all RabbitMQ metrics as well as system metrics from the RabbitMQ network; moreover, being a full but general-purpose monitoring solution, it includes a strong visualisation tool.
So, once you've gathered all of this data, you can create custom dashboards to exhibit the indicators that are most essential to your organisation.
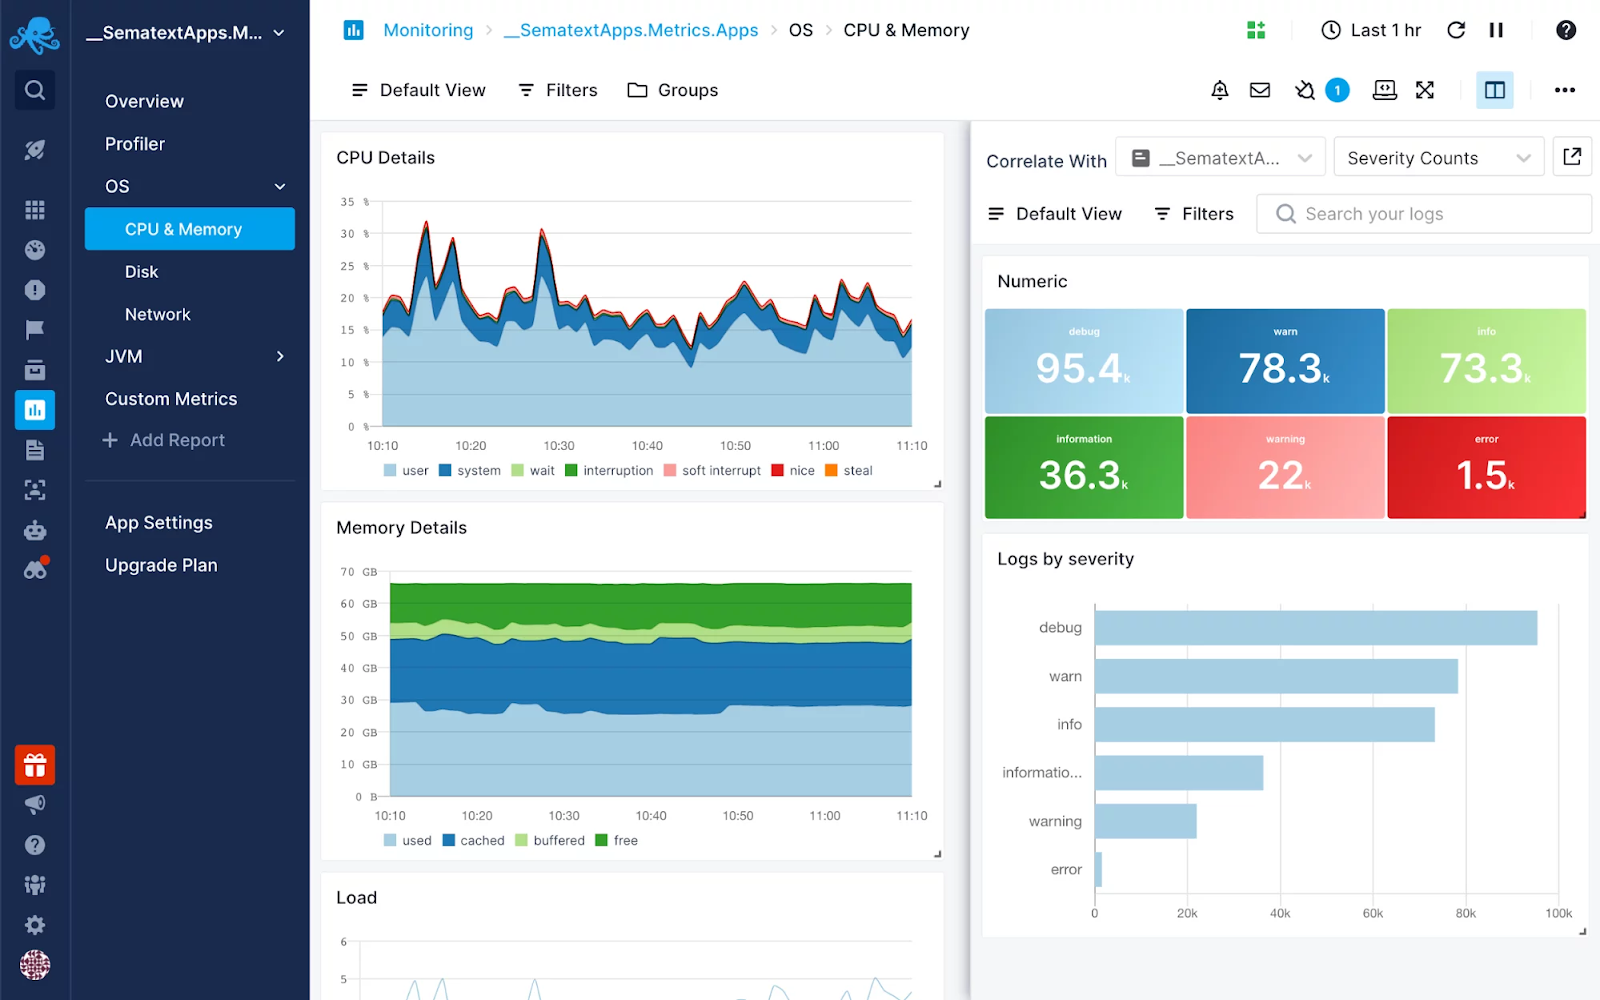
Sematext gives tremendous insight into the complete RabbitMQ infrastructure with distinct, thorough dashboards devoted to various RabbitMQ and system metrics, including queues & nodes.
Then there are Sematext Agents, which are Sematext services that operate on the nodes in your cluster. These people can discover RabbitMQ installations automatically and then allow me to take over to specify all the metrics I'd like to watch and customize the dashboard to my exact specifications.
RabbitMQ Logs Integration is also available from Sematext. You may use this capability to generate charts using data retrieved from log messages, such as client authentication and RabbitMQ restarts. Correlating log data with RabbitMQ metric data in a split-screen view (as illustrated in the picture below) will offer greater insight into an issue while troubleshooting.
RabbitMQ Monitoring: Best Practices
To ensure optimal performance and prevent issues, it is important to monitor RabbitMQ closely. Here are some best practices for RabbitMQ monitoring:
- Monitor key metrics, such as message rates, queue sizes, consumer counts, and network traffic.
- Set up alerts to respond quickly to issues before they become critical.
- Use RabbitMQ management UI for real-time monitoring and management of queues and resources.
- Enable logging and configure it to provide the necessary information.
- Use monitoring tools such as Prometheus, Grafana, and Nagios for deeper insights into performance and issue identification.
- Monitor the underlying infrastructure to ensure RabbitMQ has the necessary resources.
- Regularly review and adjust RabbitMQ configurations to ensure peak efficiency.
Conclusion
In summary, monitoring metrics are crucial for maintaining the health and performance of messaging systems that utilize RabbitMQ. They provide valuable insights into the system's behavior, allowing administrators to identify issues, determine the root cause of problems, and implement corrective measures.
Infrastructure-level metrics such as node and cluster-wide metrics, and queue-level metrics, are important for monitoring the general health and performance of the system. Meanwhile, application metrics are essential for identifying issues that are specific to certain applications. These metrics can help administrators pinpoint misbehaving components like runaway publishers or consumers that are unable to keep up with the rate.
In essence, monitoring RabbitMQ metrics is a critical aspect of ensuring the reliability and scalability of messaging systems. By using the right tools and processes, administrators can use metrics to detect and resolve issues before they cause significant downtime or negatively impact the user experience.
Monitor Your Entire Application with Atatus
Atatus is a Full Stack Observability Platform that lets you review problems as if they happened in your application. Instead of guessing why errors happen or asking users for screenshots and log dumps, Atatus lets you replay the session to quickly understand what went wrong.
We offer Application Performance Monitoring, Real User Monitoring, Serverless Monitoring, Logs Monitoring, Synthetic Monitoring, Uptime Monitoring, and API Analytics. It works perfectly with any application, regardless of framework, and has plugins.

Atatus can be beneficial to your business, which provides a comprehensive view of your application, including how it works, where performance bottlenecks exist, which users are most impacted, and which errors break your code for your frontend, backend, and infrastructure.
If you are not yet an Atatus customer, you can sign up for a 14-day free trial.
#1 Solution for Logs, Traces & Metrics
![]() APM
APM
![]() Kubernetes
Kubernetes
![]() Logs
Logs
![]() Synthetics
Synthetics
![]() RUM
RUM
![]() Serverless
Serverless
![]() Security
Security
![]() More
More