Prometheus vs Zabbix: A Hands-On Technical Comparison and a Modern Alternative
When choosing a monitoring tool, two popular names often come up, Prometheus and Zabbix. Both are powerful and widely adopted but come with different approaches and learning curves. Prometheus is favored in cloud-native environments for its time-series data model and flexibility, while Zabbix has long served traditional IT infrastructures with its rich agent-based monitoring.
But what if you are looking for a simpler, more unified solution? That’s where Atatus comes in, a modern, all-in-one monitoring platform that serves as a powerful Prometheus and Zabbix alternative. Let’s compare these three tools side by side and see which one suits your needs best.
Table of Contents:
- What is Prometheus?
- What is Zabbix?
- Prometheus vs Zabbix: A Comprehensive Comparison
- Installation and Setup
- Data Collection and Storage
- Query Language and Data Processing
- Visualization and Dashboards
- Alerting and Notifications
- Scalability and Performance
- Pricing Comparison
- Decision Framework: When to Choose Prometheus or Zabbix?
- Why Atatus is a Better Alternative to Prometheus and Zabbix?
- Advanced Use Cases: Prometheus vs Zabbix for Specific Environments
What is Prometheus?
Prometheus is an open-source metrics-based monitoring system developed for reliability and scalability. It is popular in cloud-native environments.
Use case: Prometheus is ideal for developers and DevOps teams who want to monitor microservices, containers, and application performance with custom metrics.
What is Zabbix?
Zabbix is an open-source monitoring tool designed for monitoring networks, servers, applications, and cloud services. It’s well-suited for traditional IT environments.
Use case: Zabbix is great if you are managing a large number of physical or virtual servers, network devices, or cloud infrastructure and want detailed control over alerts and reporting.
Now that we have looked at what Zabbix and Prometheus are and their primary use cases, let’s dive deeper into how they compare in terms of installation, data handling, visualization, alerting, and so on. And to make this more useful, we will also look at Atatus, a great Zabbix and Prometheus alternative.
Prometheus vs Zabbix: A Comprehensive Comparison
1. Installation and Setup
Prometheus
Prometheus offers a simpler installation process. A single binary deployment can be used, and configuration is managed through YAML files. However, integrating additional components like Grafana for visualization and Alertmanager for notifications requires extra steps.
Zabbix
Setting up Zabbix involves installing the server, database, and web frontend. While the process is straightforward for those familiar with traditional IT infrastructures, it can be time-consuming. Configuring agents on each host adds to the setup complexity.
Atatus
Atatus simplifies setup with minimal configuration, offering a unified dashboard for Application performance monitoring, infrastructure, and logs. It automatically instruments supported applications, removing the need for manual setup.
To get started, simply click on Add Data in the UI.
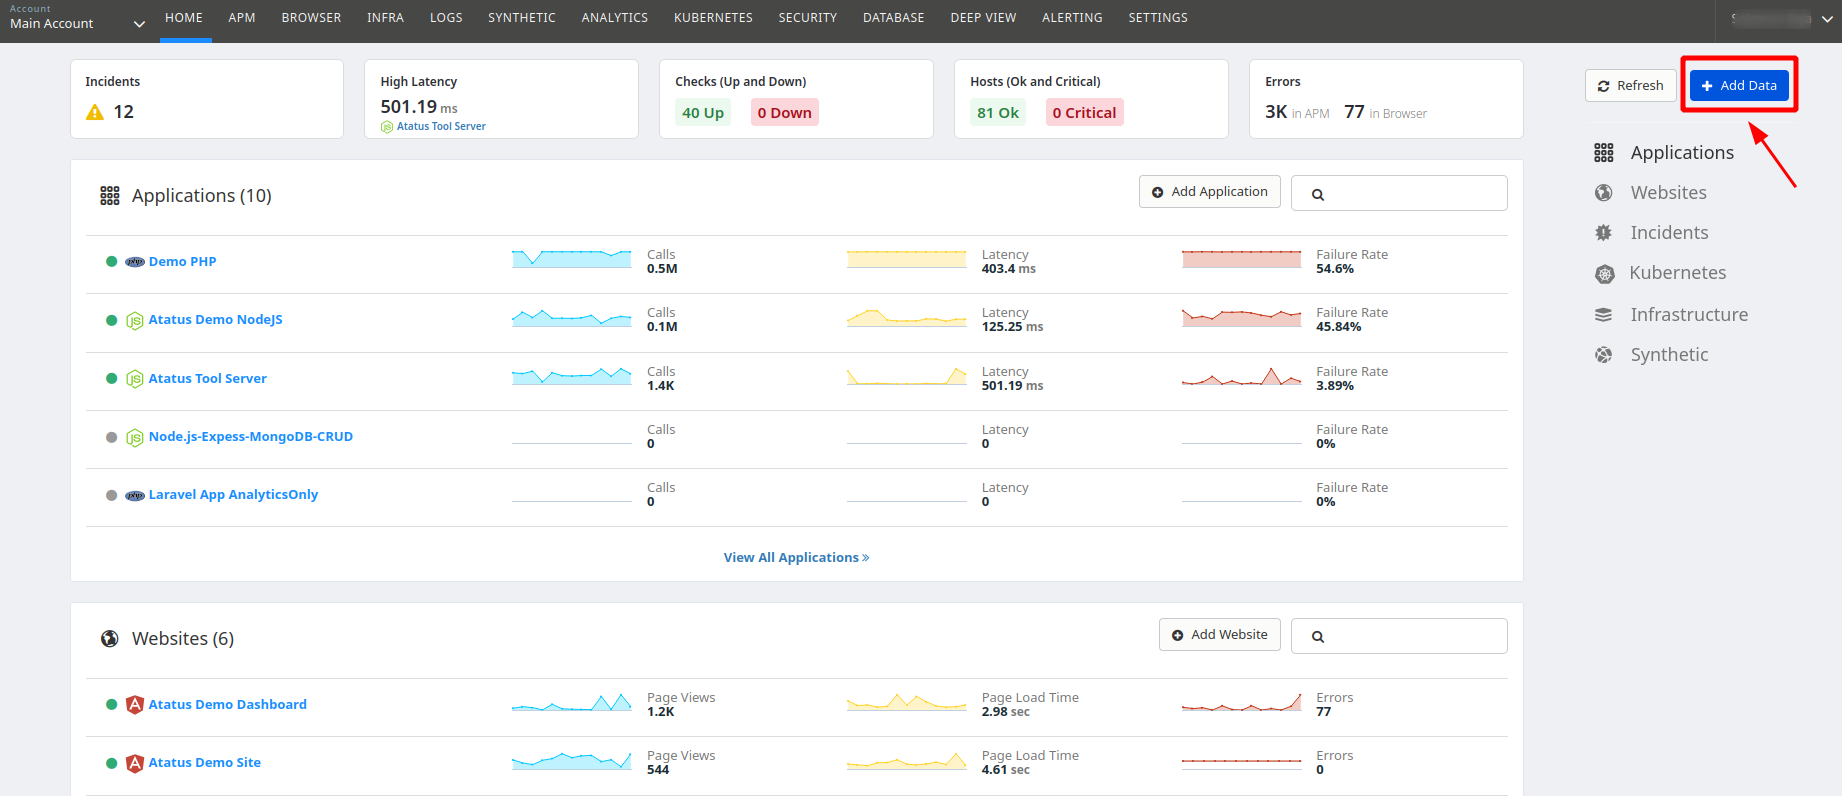
From there, you can choose the type of monitoring you need, like APM, infrastructure, real user monitoring, logs, or database monitoring, based on your tech stack.
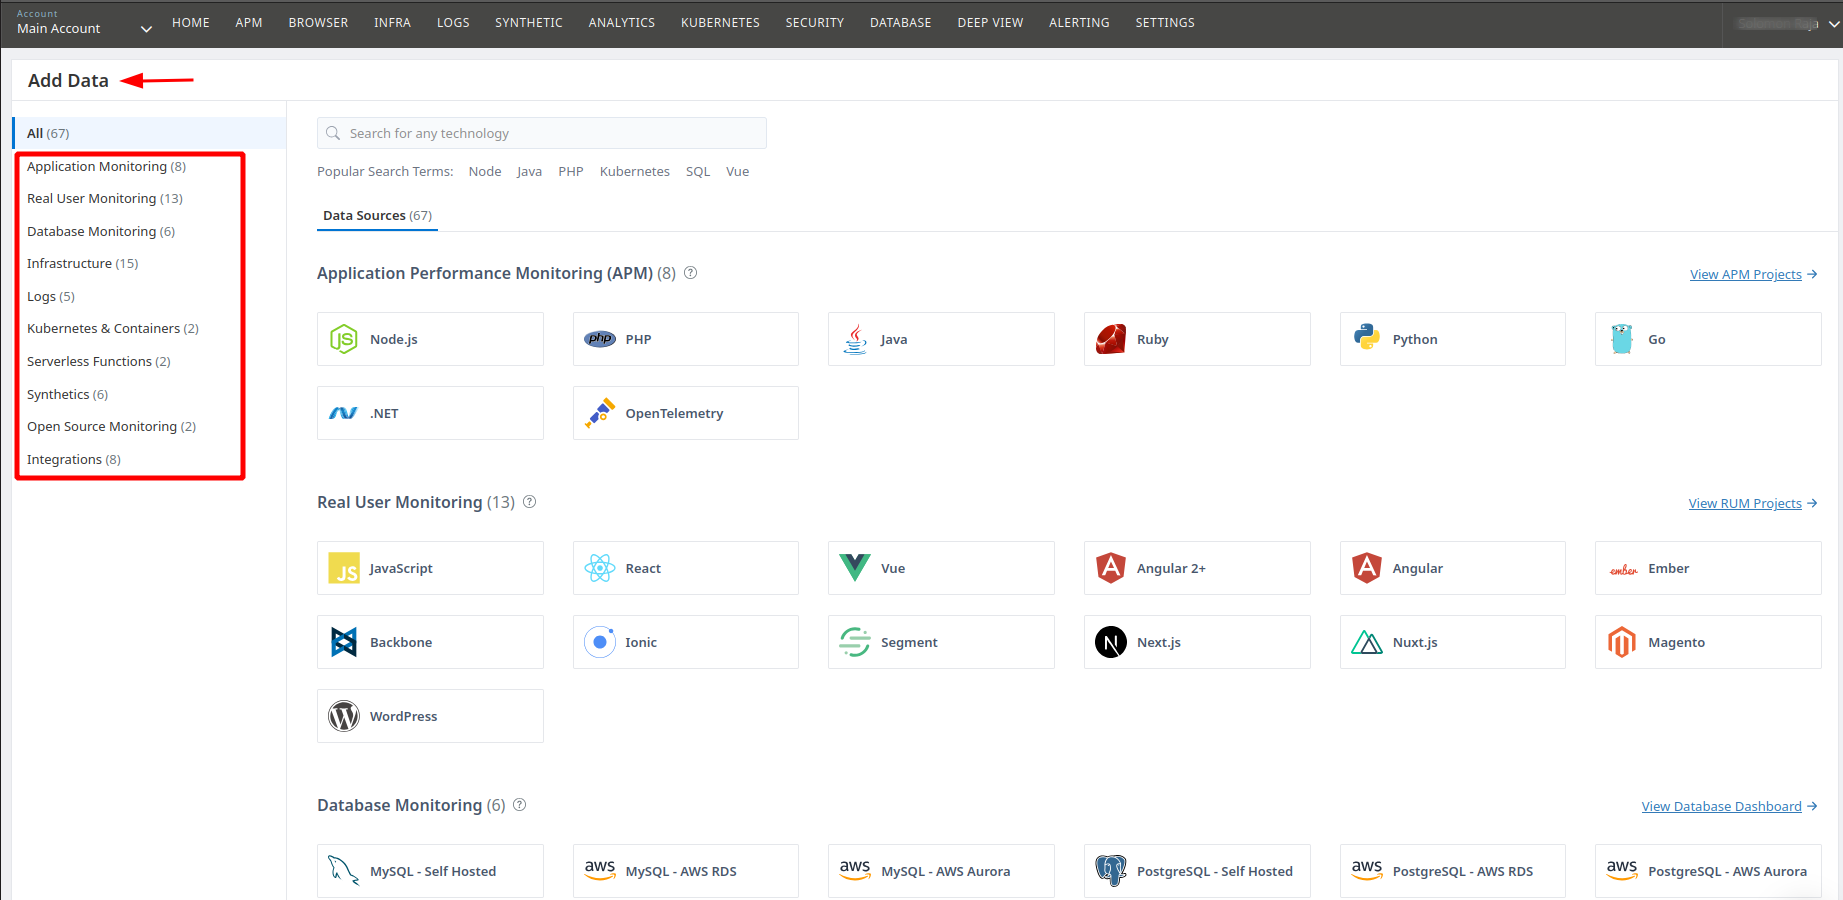
Once the agent is installed with your license key, data collection begins instantly, capturing performance metrics, traces, and logs. Then the collected data is processed and visualized in real-time dashboards.This approach reduces setup complexity, making Atatus a quick and efficient monitoring solution.
⚙️ Still wiring Prometheus exporters together at midnight?
Most teams spend their first week configuring Prometheus, Grafana, and Alertmanager. Atatus gives you metrics, traces, logs, and alerts out of the box, with agent installation completed in under 5 minutes.
2. Data Collection and Storage
Prometheus
Prometheus employs a pull model, scraping metrics from targets at specified intervals. It uses its own time-series database, storing data for 15 days by default. For longer retention, external storage solutions are needed.
Zabbix
Zabbix utilizes a push model, where agents send data to the server. It supports various protocols like SNMP, JMX, and IPMI. Data is stored in an external database (MySQL, PostgreSQL), which can be optimized for large installations.
Atatus
Atatus uses lightweight, agent-based data collection to monitor application and infrastructure performance in real time. It supports multiple platforms and programming languages like Node.js, Java, PHP, Python, and more.
All collected data is sent to a scalable backend that automatically handles storage and processing. This setup ensures long-term data retention and visibility without requiring any manual configuration.
3. Query Language and Data Processing
Prometheus
Prometheus offers PromQL, which is powerful if you are comfortable with its syntax. It lets you filter and analyze time-series data, apply mathematical functions, and create complex queries to visualize trends.
However, when I first started, the learning curve was quite steep, writing PromQL queries took some practice. Still, once mastered, it provides unmatched flexibility in metric analysis.
Zabbix
Zabbix uses predefined item keys and triggers for data collection and alerting. While these are effective for standard monitoring setups, I found it limiting when I needed to create complex metrics or custom aggregations.
Creating advanced logic often meant writing external scripts or preprocessing the data before it reached Zabbix. It does not support a native query language for flexible data exploration, which made real-time troubleshooting harder.
Atatus
Atatus offers a more user-friendly query experience. Unlike Prometheus, you don’t need to learn a dedicated query language, most things can be achieved through the UI.
You can filter metrics, traces, and logs side by side, which can save your time during debugging. Advanced users can also use structured queries, but I personally like the balance it strikes between simplicity and power.
4. Visualization and Dashboards
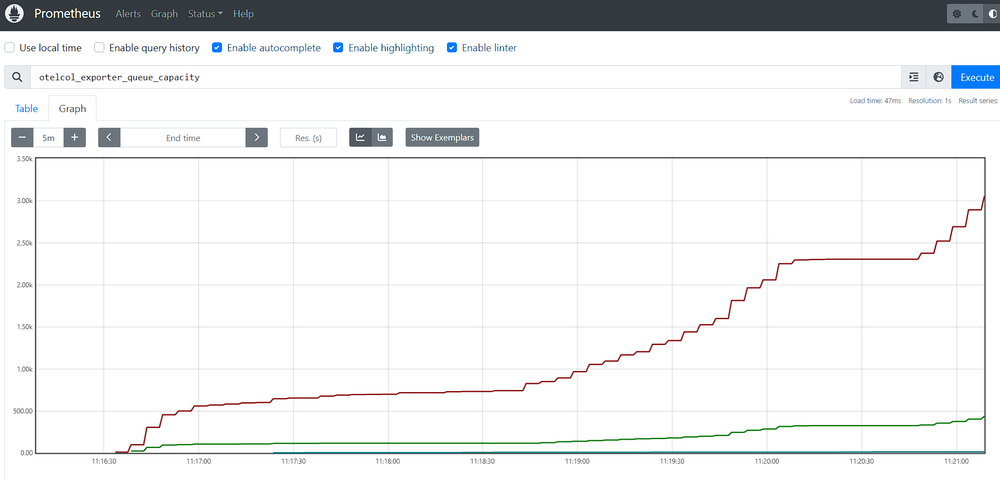
Prometheus
Prometheus doesn’t focus much on visualization itself, it provides a basic expression browser for evaluating PromQL queries. For rich dashboards, I integrated it with Grafana. With Grafana, I could build dynamic dashboards, but it required extra configuration and maintenance. Overall, this combo works great, but it adds another tool to your stack.
Zabbix
Zabbix comes with built-in dashboards that work fine, but they feel old and not very user-friendly. You can create network maps, graphs, and tables, but there aren’t many options to customize them the way you want.
When I worked with a lot of data, the dashboards were a bit slow to update in real time. Additionally, arranging the widgets was not very smooth, which made the dashboard setup feel less efficient.
Atatus
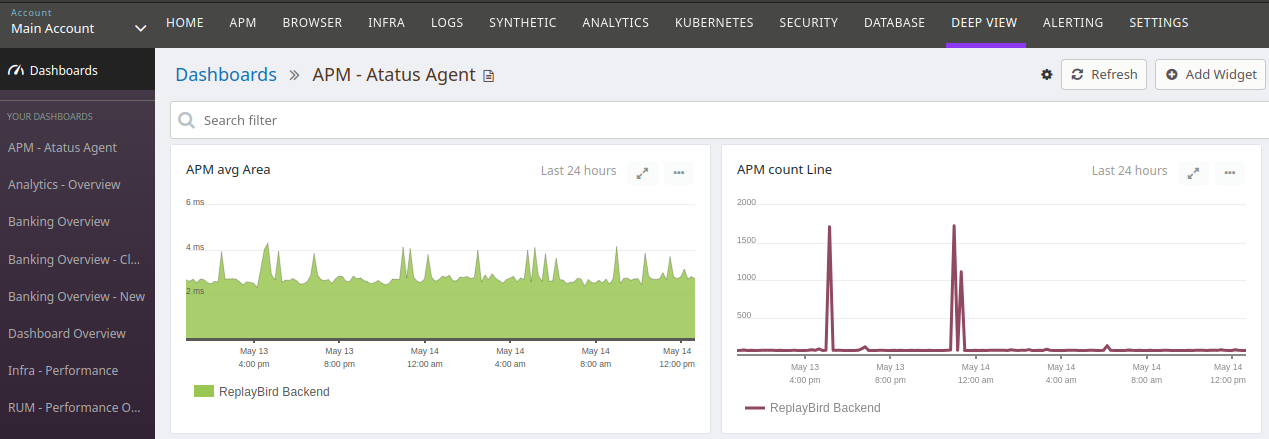
Atatus provides modern, out-of-the-box dashboards without the need for external tools like Grafana. Users get instant access to pre-built visualizations for metrics, traces, and logs after agent installation.
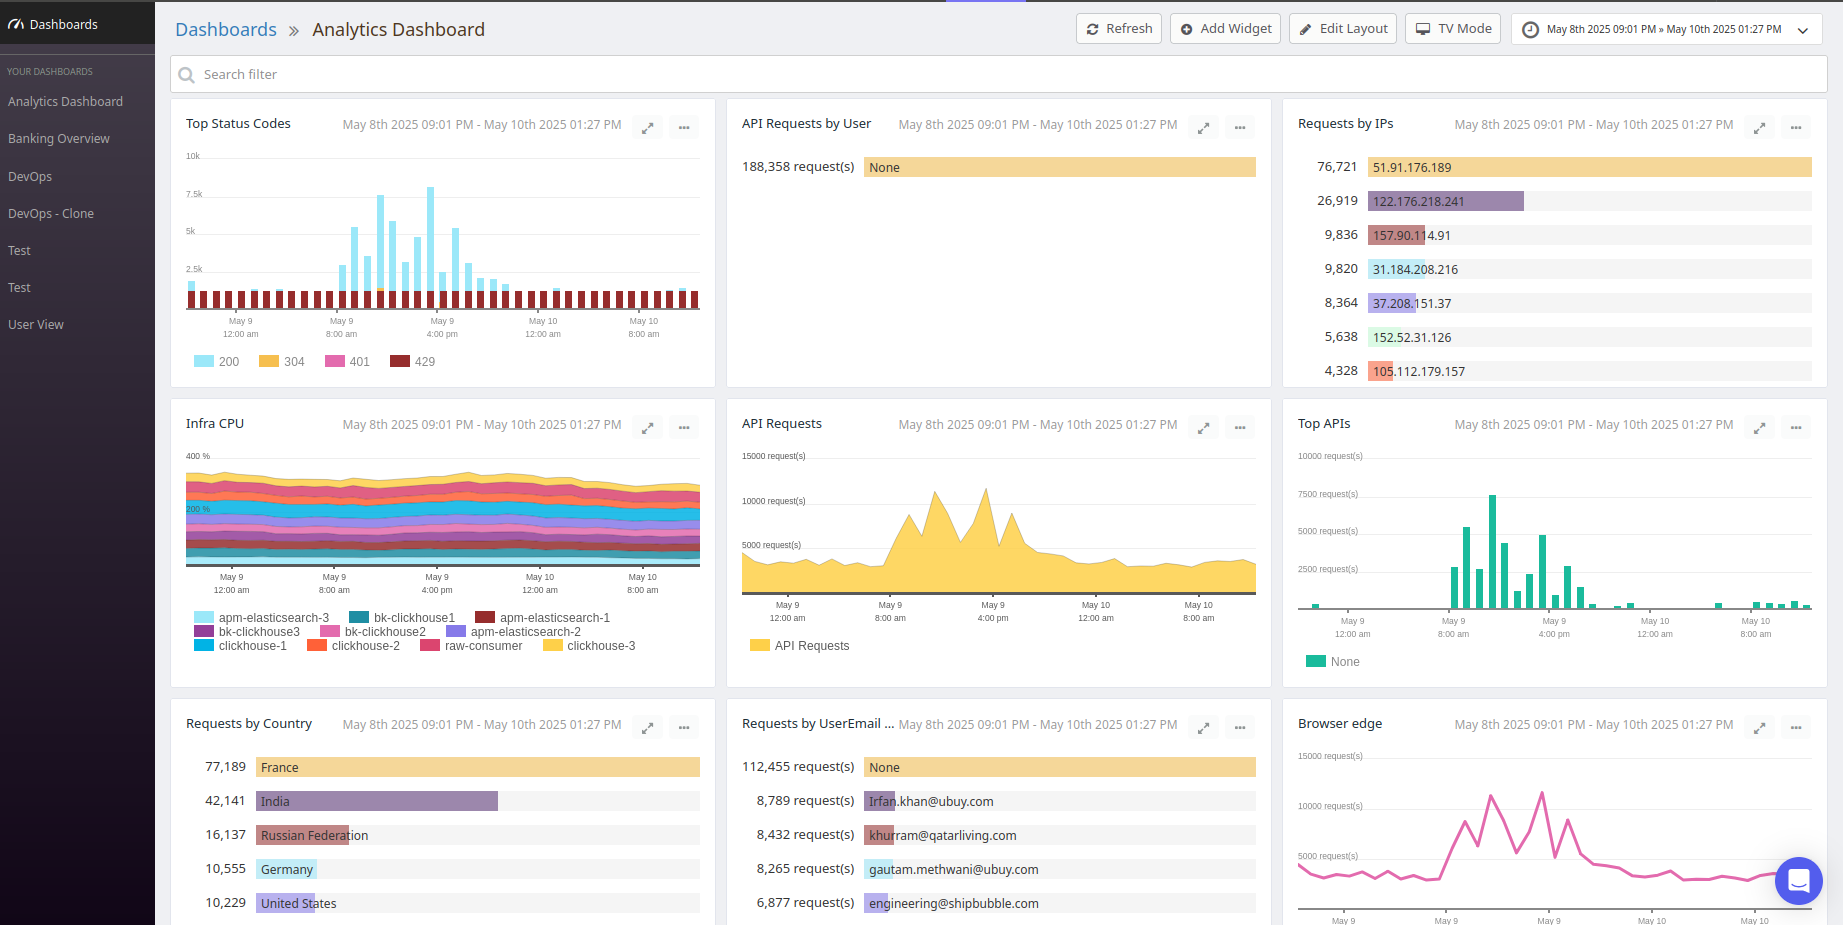
Customizing dashboards is simple with drag-and-drop widgets and real-time updates. Built-in correlation between logs and metrics accelerates issue resolution.
👩💼 Engineering Time Is Too Valuable for Tool Maintenance
Every hour spent maintaining Prometheus, Grafana, exporters, and alerting pipelines is time not spent shipping product. Consolidate metrics, traces, logs, and alerts in Atatus and let your engineers focus on building, not maintaining tooling.
5. Alerting and Notifications
Prometheus
Prometheus uses Alertmanager, which is flexible but not easy for beginners. Writing alert rules using PromQL required a good understanding of your metrics and query structure. Once alerts are configured, you can route them via Slack, email, PagerDuty, etc. But setting up silencing, grouping, and templating required editing YAML files, which slowed things down for me initially.
Zabbix
Zabbix has a very detailed alerting system, I could define triggers, thresholds, escalation paths, and get notifications via email, SMS, or scripts. But the configuration felt a bit too complex at times, especially when setting escalation rules or maintenance windows. It’s powerful, but the UI made it feel like a lot of steps for something simple.
Atatus
Atatus offers a straightforward and powerful alerting mechanism that simplifies incident detection across APM, infrastructure, and logs. Alerts can be configured with critical and warning thresholds directly from the UI without complex scripting. Notification channels can be easily added and mapped to specific alert rules, ensuring that the right teams are informed when issues arise.
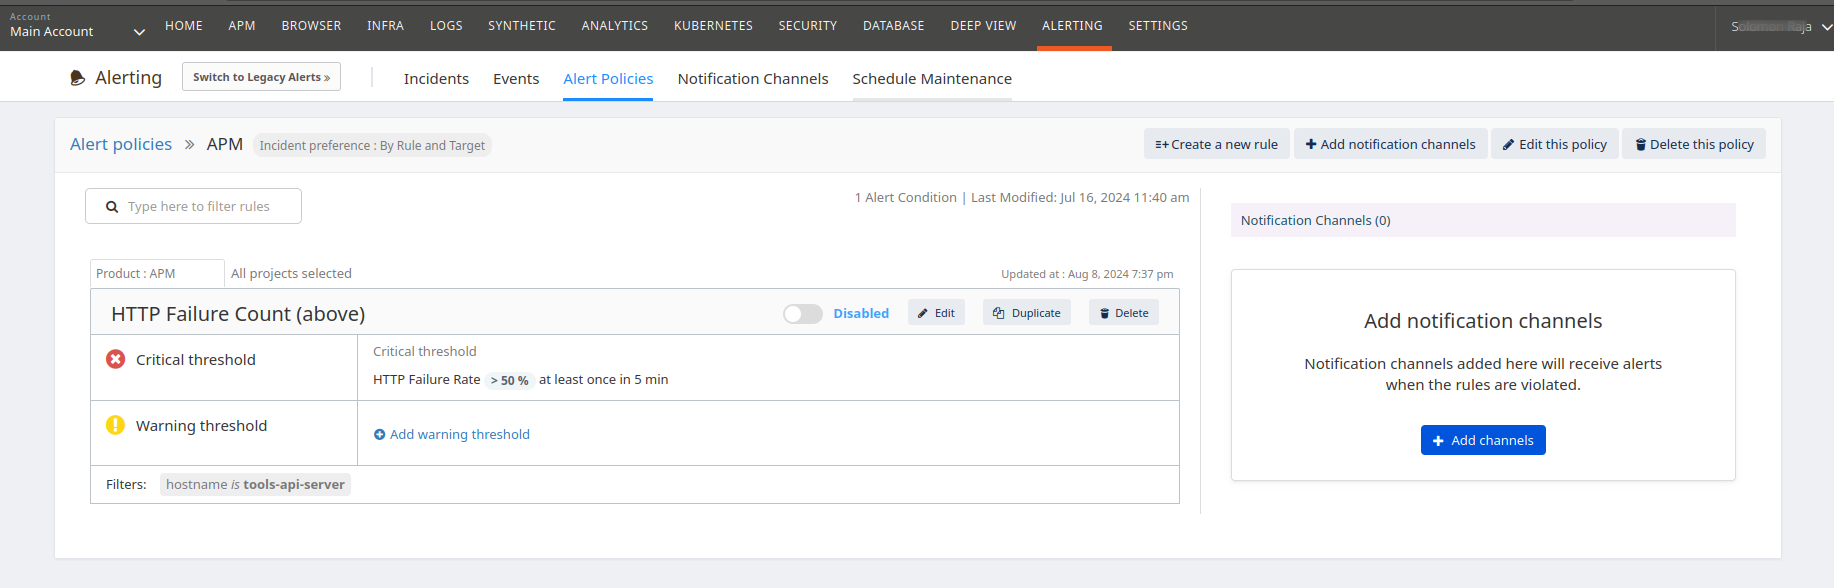
Unlike Prometheus, which depends heavily on PromQL for alert rules, or Zabbix’s multi-step trigger definitions, Atatus provides a cleaner, faster configuration experience with built-in support for environment-level filtering and project-based alert policies.
6. Scalability and Performance
Prometheus
Prometheus works well for smaller, containerized environments but faces performance bottlenecks at scale. Horizontal scaling isn’t natively supported. For larger deployments, sharding or using tools like Thanos or Cortex becomes necessary, which adds operational overhead.
Zabbix
Zabbix is capable of handling large-scale environments but can become resource-intensive as the number of monitored items increases. Scaling requires deploying proxies or distributed setups, which may introduce latency and complicate management.
Atatus
Atatus is built on a cloud-native, horizontally scalable architecture. Whether you're monitoring 10 servers or 10,000 microservices, Atatus adapts seamlessly. You don’t need to worry about scaling storage, retention, or dashboard performance. It auto-scales based on your usage, giving you enterprise-grade performance with zero maintenance.
7. Pricing Comparison
Prometheus
Prometheus is an open-source tool. You don’t pay for the tool itself, but operational costs come from managing the infrastructure like storage, high availability setups, and scaling. If you integrate Grafana, Alertmanager, or long-term storage solutions, those may add complexity and cloud storage costs.
Zabbix
Zabbix is also an open-source tool. Like Prometheus, there are no licensing fees. However, you will incur infrastructure and resource costs to manage Zabbix servers, agents, and database backends. Zabbix does offer paid support plans, which may be necessary for enterprise-grade use.
Atatus
Atatus offers a transparent pricing based on usage. You don’t need to manage the infrastructure, which can reduce hidden operational costs. Atatus also offers a free trial, making it easy to evaluate before committing.
Real-world TCO note: Teams running Prometheus at scale typically pay $800–$3,000/month in EC2 + S3 storage costs for Thanos, plus 0.5–1 FTE of SRE time managing the stack. Zabbix PostgreSQL backends at 10,000+ metrics/s require dedicated DBA attention. A managed platform like Atatus bundles infrastructure, retention, and support into a predictable per-host price.
Decision Framework: When to Choose Prometheus or Zabbix?
Choose Prometheus if:
- You are working in a cloud-native environment with microservices and containers.
- You need a time-series database monitoring solution.
- You prefer code-driven monitoring, where defining metrics and alerts via YAML fits your workflow.
- You are already using Grafana or want deep integration with Kubernetes and modern CI/CD pipelines.
- You are comfortable managing integrations like Alertmanager and exporters.
Choose Zabbix if:
- You have a traditional IT setup and prefer using familiar databases like MySQL, MariaDB, PostgreSQL, SQLite, Oracle, or IBM DB2 for storing monitoring data.
- You need agent-based monitoring with strong built-in alerting, templates, and SNMP/JMX support.
- You want a centralized dashboard for all metrics and are okay with more setup effort.
- You are managing a large on-premise infrastructure and need historical data for months or years.
Choose an Observability Platform Instead if:
- You need APM + Infrastructure + Logs + RUM in one place
- Your team has outgrown maintaining open-source monitoring stacks
- Time-to-value matters more than configuration control
- You're scaling from 10 to 100+ services without adding headcount
- You want AI-powered anomaly detection without building it yourself
🔭 Get Unified Observability, Not More Tools
See how Atatus covers metrics, traces, logs, APM, RUM, and error tracking in a single pane without the Prometheus + Grafana + Alertmanager dependency chain.
When Prometheus and Zabbix Aren't Enough?
Both Prometheus and Zabbix are excellent tools in their intended contexts. But as engineering teams scale, a pattern emerges: the monitoring stack itself becomes a source of operational pain.
- Tool Sprawl: Prometheus alone doesn't cover logs, traces, or user-facing performance. Teams end up running Prometheus + Loki + Tempo + Grafana + Alertmanager each with its own config, upgrade cycle, and failure mode.
- Operational Overhead: Prometheus requires managing scrape configs, relabeling rules, Thanos sidecars for HA, and S3 retention policies. Zabbix needs database tuning and proxy scaling. This is invisible engineering time that doesn't ship features.
- Alert Fatigue: When Prometheus Alertmanager and Zabbix triggers each fire separately, on-call engineers receive duplicate or conflicting pages. Without unified context, mean time to resolution (MTTR) suffers.
- Lack of Unified Visibility: Prometheus sees your containers. Zabbix sees your servers. Neither sees your user-facing JavaScript errors, slow database queries, or real user latency. Root cause lives in the gaps between tools.
- Slow Root-Cause Analysis: Context-switching between Prometheus, a log aggregator, and APM dashboards during an incident adds minutes per handoff. Modern observability correlates metrics → traces → logs → user sessions in a single click.
- Maintenance Burden at Scale: At 500+ services, Prometheus scrape interval tuning and cardinality management become full-time jobs. Zabbix database vacuuming and housekeeping at 10M+ metrics require DBA expertise that most engineering teams don't have in-house.
This is not a criticism of Prometheus or Zabbix both are technically sound. The question is whether maintaining them is the best use of your team's capacity when alternatives exist.
Where Atatus Fits In?
Atatus was built for teams that have hit these ceilings. Rather than replacing your monitoring culture, it replaces the operational burden: you get the same depth of observability data such as metrics, traces, logs, APM, RUM, error tracking, Kubernetes dashboards through a single agent, with no infrastructure to manage, no cardinality limits to tune, and no Grafana panels to rebuild after every upgrade.
The practical difference: a team migrating from Prometheus + Grafana typically goes from a multi-day setup to first production metrics in under an hour.
Why Atatus is a Better Alternative to Prometheus and Zabbix?
If you are looking for a simpler, more efficient way to monitor your systems without the operational overhead of open-source tools, Atatus offers a modern, all-in-one observability platform that outperforms both Prometheus and Zabbix in key areas.
Prometheus vs Zabbix vs Atatus: Full Feature Comparison
To provide a better understanding, let's compare Atatus directly with Prometheus and Zabbix. This table is designed for evaluation-stage teams. The commentary below each row explains what the gap actually means for your team:
| Feature | Prometheus | Zabbix | Atatus |
|---|---|---|---|
| Time-series metrics support | ✅ Native support | Limited | ✅ Fully supported with powerful dashboards |
| Alerting | ❌ Requires Alertmanager | ✅ Template-based | ✅ Built-in, customizable, real-time |
| Visualization | ❌ Needs Grafana | ✅ Basic dashboards | ✅ Interactive, customizable dashboards |
| Setup complexity | ❌ Complex exporters & configs | ❌ Complex for large scale | ✅ Minimal setup with auto-instrumentation |
| Scalability | ❌ Requires extra tools (Thanos, Cortex) | ❌ Limited at high device counts | ✅ Cloud-native, no extra tools needed |
| Full-stack observability | ❌ Metrics only | ❌ Limited to infrastructure | ✅ APM, logs, RUM, synthetics, error tracking |
| Maintenance | ❌ High, manual management | ❌ Requires DB and server upkeep | ✅ Fully managed, zero maintenance |
📊 Want to see these capabilities live, not in a table?
A 30-minute technical demo with an Atatus engineer tailored to your environment. Whether you're running Kubernetes, microservices, cloud-native applications, on-prem infrastructure, or hybrid deployments, we'll walk through how Atatus works with your stack. No sales slides. Just the product.
Advanced Use Cases: Prometheus vs Zabbix for Specific Environments
Your monitoring requirements look very different depending on your infrastructure type. Here's how Prometheus and Zabbix compare in the scenarios engineering teams actually face in 2026.
Prometheus vs Zabbix for Kubernetes
Prometheus with kube-state-metrics and Kubernetes service discovery is the default Kubernetes monitoring path. Zabbix supports Kubernetes but requires manual proxy configuration. For teams running mixed Kubernetes + VM infrastructure, neither fully bridges the gap, this is where a unified platform like Atatus adds the most value, providing cluster, namespace, pod, and node views alongside APM data.
Prometheus vs Zabbix for Cloud-Native Applications
Cloud-native apps on AWS, GCP, or Azure require monitoring ephemeral compute, managed databases, serverless functions, and CDN layers. Prometheus handles container metrics well but has no cloud-native service integrations. Zabbix's cloud monitoring is largely limited to VM-level data. Atatus integrates cloud metrics natively alongside application-layer observability.
Prometheus vs Zabbix for Microservices
In microservices architectures, the monitoring challenge shifts from "is this server up?" to "which service call is causing this latency?" Prometheus tracks metrics per service but lacks distributed tracing. Zabbix wasn't designed for this topology. Distributed tracing (available natively in Atatus) is the critical capability that makes microservices debuggable.
Prometheus vs Zabbix: Total Cost of Ownership
Both tools are open-source with zero license fees. But "free" monitoring is a myth at scale. Prometheus TCO includes: EC2/storage for Thanos, Grafana hosting, SRE time for cardinality management, and Alertmanager maintenance. Zabbix TCO includes: database server licensing, DBA time, proxy infrastructure at scale. A managed platform trades CAPEX for predictable OPEX and typically reduces total cost once you account for engineering hours.
Prometheus vs Zabbix at Scale (1,000+ Services)
At enterprise scale, Prometheus cardinality limits become a real constraint, high-cardinality labels (user IDs, request IDs) can destabilize the TSDB. Zabbix scales with proxy nodes but database write throughput caps out. Both require dedicated infrastructure teams. Enterprise teams often migrate to managed observability platforms when their monitoring stack becomes a product team in itself.
Prometheus vs Zabbix for Enterprise Security & Compliance
Both tools require self-managed security patching, access control configuration, and audit logging setup. For teams in regulated industries (SOC 2, HIPAA, ISO 27001), managing open-source monitoring infrastructure adds compliance scope. Managed observability platforms typically come with SOC 2 compliance, RBAC, SSO, and data residency options out of the box.
🏢See How Atatus Fits Your Environment
Every engineering environment is different. Book a personalized demo to see how Atatus helps teams monitor applications, infrastructure, APIs, and user experience from a unified observability platform. We'll walk through your architecture and answer your team's specific requirements.
Questions Engineers Asks During Demo
1) Is Prometheus better than Zabbix?
It depends on your stack. Prometheus is built for cloud-native and Kubernetes environments. Zabbix is better for traditional on-premise servers and network devices. If you need both application and infrastructure visibility in one place, neither is fully sufficient.
2) What are the biggest limitations of Prometheus and Zabbix?
Prometheus is metrics-only. No logs, traces, APM, or RUM without additional tools. Zabbix wasn't designed for containerized environments and has limited Kubernetes support. Both carry significant setup and maintenance overhead that most teams underestimate.
3) Can Prometheus and Zabbix be used together?
Yes, but it adds complexity such as two alert pipelines, two dashboards, and no unified incident view. Teams that run both usually consolidate onto a single platform once the maintenance burden becomes unsustainable.
4) What is a good alternative to Prometheus and Zabbix?
Unified observability platforms like Atatus, Datadog, New Relic, or Dynatrace cover metrics, logs, traces, APM, and RUM in one place without the infrastructure overhead of running open-source tools at scale.
5) How long does it take to set up Prometheus, Zabbix, and Atatus?
Prometheus with Grafana and Alertmanager takes 2–5 days. Zabbix with server, database, and agents takes 1–3 days. Atatus installs via a single agent and most teams see first production data within an hour.
#1 Solution for Logs, Traces & Metrics
![]() APM
APM
![]() Kubernetes
Kubernetes
![]() Logs
Logs
![]() Synthetics
Synthetics
![]() RUM
RUM
![]() Serverless
Serverless
![]() Security
Security
![]() More
More


![Datadog vs Splunk: A Side-by-Side Comparison [2026]](/blog/content/images/size/w960/2024/12/Untitled-design--41-.png)