Top 10 Serverless Monitoring Tools in 2025
Monitoring serverless applications is critical to ensure optimal performance, reduce errors, and maintain end-to-end observability. Choosing the right serverless monitoring tools can help track serverless performance metrics, cold starts, and distributed traces across cloud functions. Below, we explore the top 10 cloud-native and third-party serverless monitoring solutions, highlighting their features, pros, cons, and best use cases.
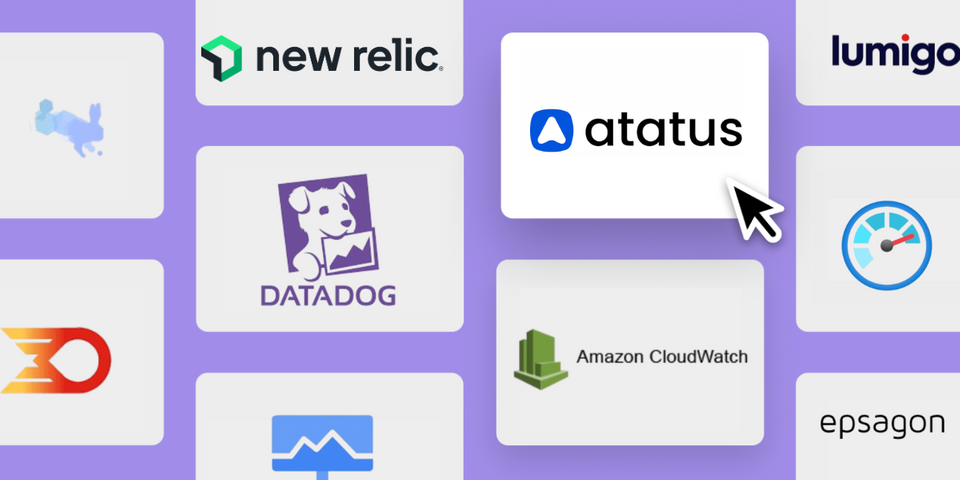
Top 10 Serverless Monitoring Tools
- Atatus
- AWS CloudWatch
- Google Cloud Monitoring
- Azure Monitor
- Datadog
- New Relic
- Dynatrace
- Thundra
- Epsagon
- Lumigo
1. Atatus
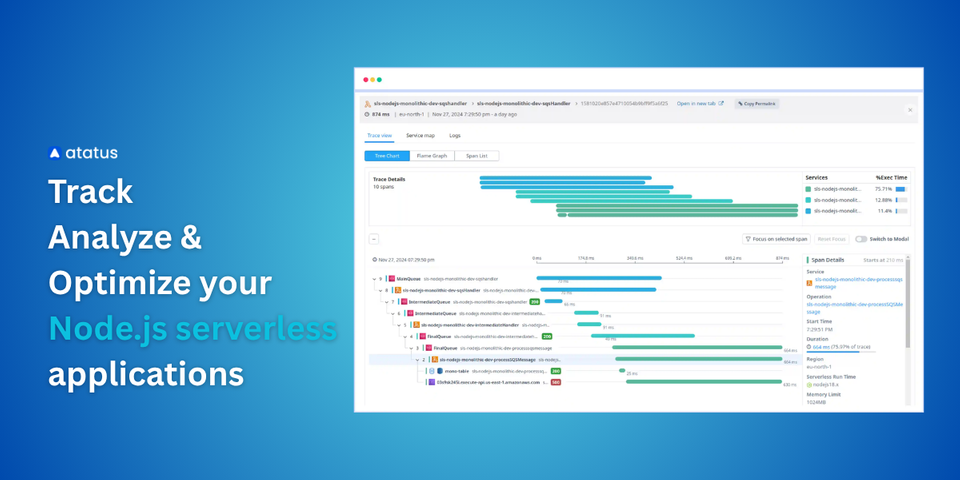
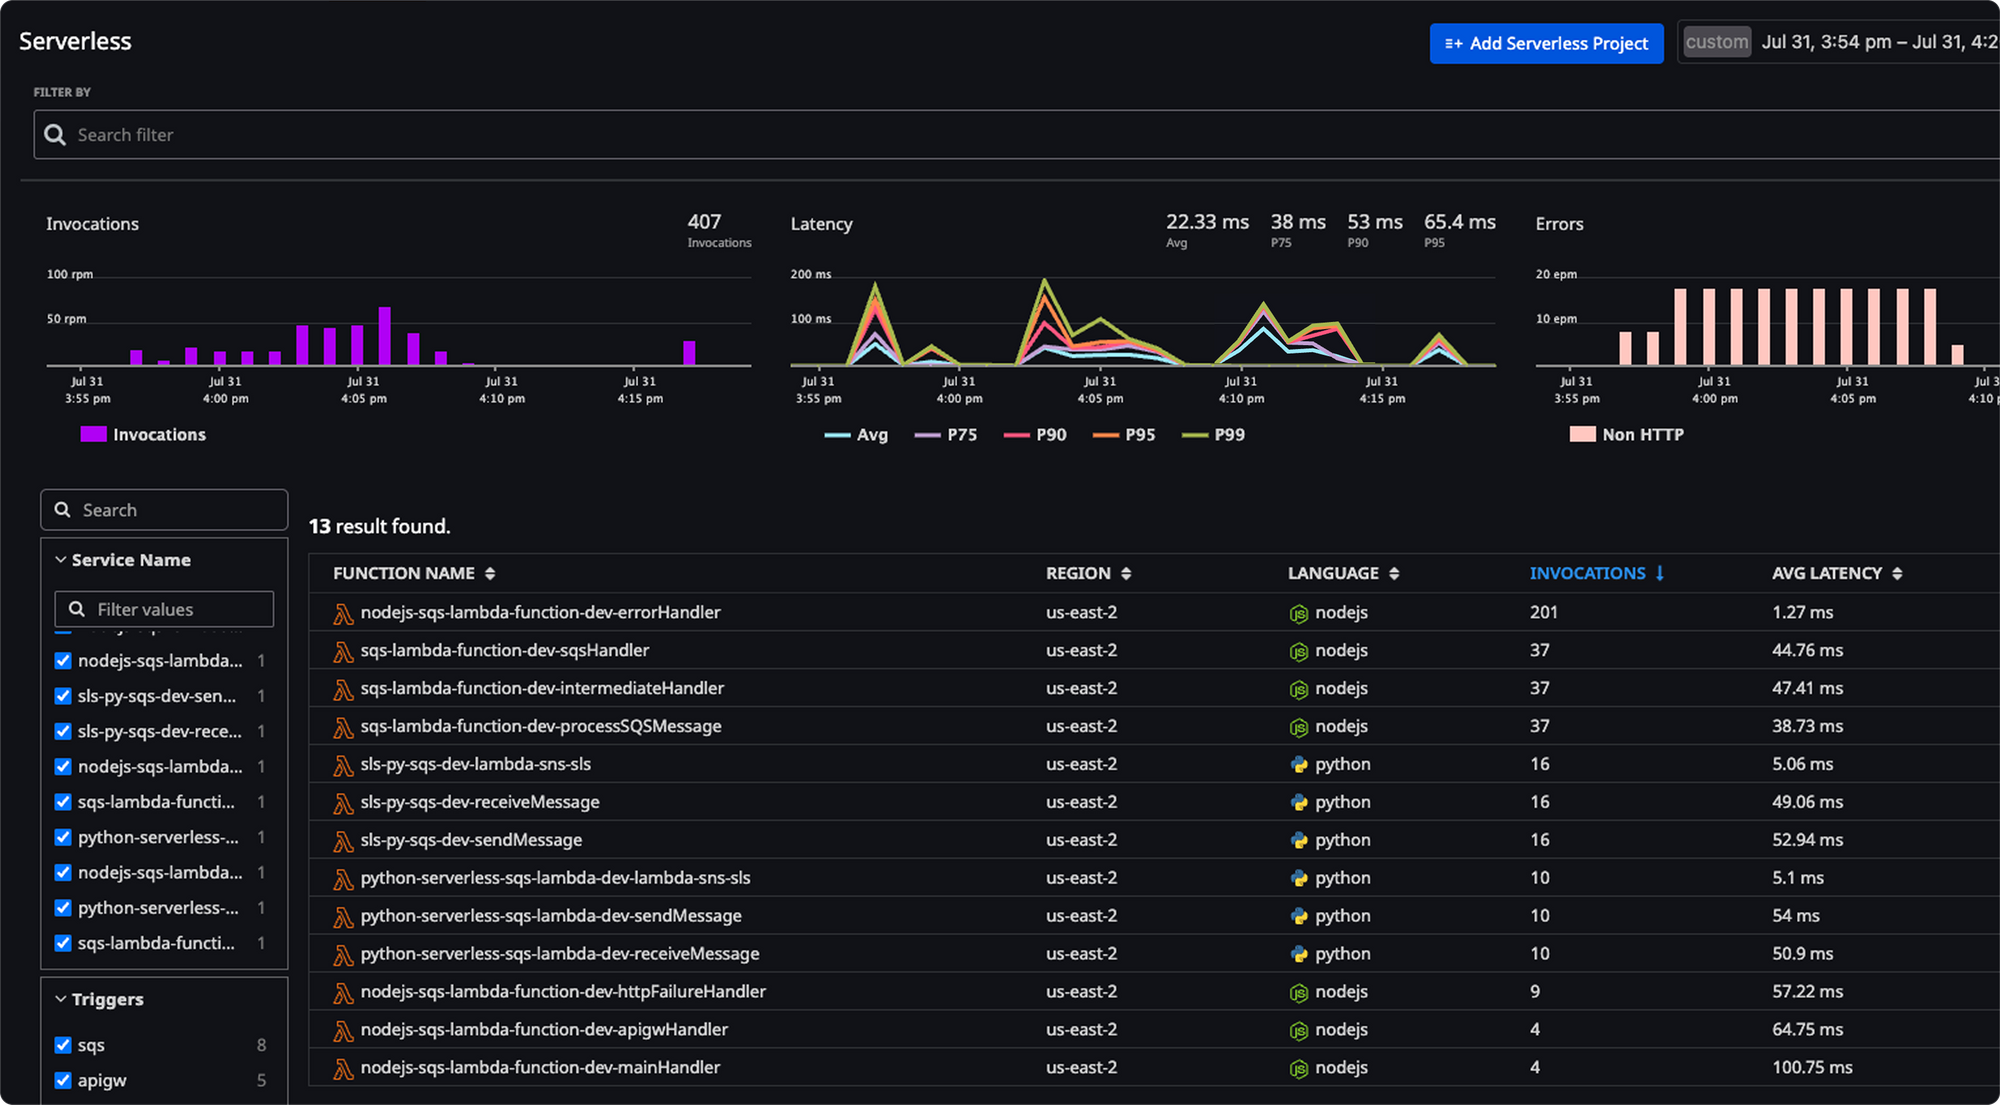
Atatus provides comprehensive serverless application monitoring for AWS Lambda, Azure Functions, and Google Cloud Functions. It delivers real-time insights into errors, latency, cold starts, and end-to-end traces. With easy integration, developers and DevOps teams can gain full observability without heavy setup. Atatus is designed for both cloud-native and hybrid serverless architectures.
Key Features:
- Real-time serverless error tracking and alerts
- Serverless dashboards and alerts for quick insights
- Cold start monitoring and function-level performance metrics
- Distributed tracing across multiple services
Pros:
- Easy setup with minimal configuration
- Full-stack serverless performance monitoring
- Supports multiple cloud platforms
Cons:
- Advanced analytics require a paid plan
- Limited on-premise monitoring
Migration Complexity:
Low, supports plug-and-play integration with serverless applications
Best Use Cases:
- Real-time monitoring of AWS Lambda, Azure Functions, and Google Cloud Functions
- Applications requiring end-to-end serverless monitoring and tracing
Monitor Serverless Applications in Real Time
Get instant visibility into errors, latency, cold starts, and end-to-end traces—without heavy setup.
Start Free Trial2. AWS CloudWatch
AWS CloudWatch is a native monitoring service for AWS Lambda and other serverless workloads. It tracks invocations, errors, execution duration, and resource usage. CloudWatch integrates seamlessly with AWS Logs, Alarms, and dashboards, making it essential for cloud-native serverless environments.

Key Features:
- Serverless logs monitoring and metrics collection
- Custom alarms and dashboards
- Integration with AWS X-Ray for distributed tracing
- Performance metrics and resource utilization tracking
Pros:
- Fully native and deeply integrated with AWS services
- No additional installation needed
- Highly scalable for large serverless deployments
Cons:
- Can be complex to configure advanced metrics
- Limited support for non-AWS serverless platforms
Migration Complexity:
Low for AWS users; native integration makes adoption straightforward
Best Use Cases:
- Monitoring AWS Lambda serverless functions in production
- Tracking serverless function performance metrics at scale
3. Google Cloud Monitoring
Google Cloud Monitoring is a comprehensive observability solution within Google Cloud Platform (GCP) designed to provide insights into the performance, uptime, and overall health of cloud-powered applications and infrastructure. It offers a unified platform for collecting, analyzing, and visualizing metrics, events, and metadata from various sources.
Key Features:
- Tracks cloud function monitoring and performance metrics
- Real-time alerts for errors and latency
- Integrated dashboards and logs visualization
- Distributed tracing with Cloud Trace
Pros:
- Seamless integration with Google Cloud services
- Supports multiple monitoring views (logs, metrics, traces)
- Scales automatically with serverless workloads
Cons:
- Limited to Google Cloud ecosystem
- Steeper learning curve for non-GCP users
Migration Complexity:
Moderate; best suited for GCP-native applications
Best Use Cases:
- Monitoring Google Cloud Functions serverless applications
- Real-time alerting and serverless error tracking in GCP
4. Azure Monitor
Azure Monitor is the core platform for serverless application monitoring in Azure, providing unified observability of your serverless resources like Azure Functions and Logic Apps through metrics, logs, and traces collected via OpenTelemetry. Key tools include Log Analytics for querying and analyzing log data, Azure Monitor Workspace for time-series metrics, and dashboards and workbooks for visualization.
Key Features:
- Tracks serverless performance metrics and cold starts
- Serverless dashboards and alerts via Application Insights
- Real-time serverless error tracking
- Distributed tracing and telemetry for Azure Functions
Pros:
- Fully integrated with Azure ecosystem
- Strong analytics with Application Insights
- Automatic scaling of monitoring data
Cons:
- Limited outside Azure environment
- May require additional configuration for complex architectures
Migration Complexity:
Low to moderate for Azure-native serverless applications
Best Use Cases:
- Monitoring Azure Functions serverless workloads
- Tracking performance and errors in enterprise Azure apps
Ready to simplify serverless monitoring? Atatus provides real-time insights, error tracking, and full visibility so your apps stay fast and reliable. Request a Demo
5. Datadog
Datadog provides comprehensive monitoring for serverless architectures across AWS, Azure, and Google Cloud. It combines logs, metrics, and traces to deliver full observability. It offers detailed insights into function performance, cold starts, and resource usage. With automated alerts and customizable dashboards, teams can ensure reliability and optimize costs.
Key Features:
- Cross-cloud serverless monitoring
- Real-time serverless dashboards and alerts
- Cold start and execution duration tracking
- Distributed tracing and error reporting
Pros:
- Multi-cloud support
- Easy integration with CI/CD pipelines
- Rich visualization for serverless application monitoring
Cons:
- Pricing can be high for large workloads
- Some features require advanced configuration
Migration Complexity:
Moderate; requires agent integration or API setup
Best Use Cases:
- Monitoring complex multi-cloud serverless functions
- Tracking serverless function performance metrics in distributed apps
6. New Relic
New Relic offers observability for serverless applications, providing deep insights into execution times, cold starts, and errors. Distributed tracing allows tracking across microservices. It integrates seamlessly with AWS Lambda and other major cloud providers for end-to-end visibility. With real-time alerts and dashboards, teams can proactively detect issues and optimize performance.
Key Features:
- Function-level serverless performance monitoring
- Cold start tracking and error alerts
- Distributed tracing across microservices
- Integrated dashboards and analytics
Pros:
- Strong analytics and alerting
- Multi-cloud support
- Easy integration with popular serverless frameworks
Cons:
- Paid plans required for full functionality
- Can be overwhelming for small teams
Migration Complexity:
Moderate, installation of agents or SDKs required
Best Use Cases:
- End-to-end monitoring of serverless functions
- Applications requiring distributed tracing and performance insights
7. Dynatrace
Dynatrace provides AI-powered monitoring for serverless workloads, tracking performance, dependencies, and root-cause analysis automatically. It supports AWS Lambda, Azure Functions, and Google Cloud Functions with full-stack observability. Dynatrace helps DevOps teams resolve issues faster by correlating metrics, logs, and traces in real time.
Key Features:
- AI-assisted serverless observability
- Distributed tracing and serverless error tracking
- Performance metrics and resource monitoring
- Automated root-cause analysis
Pros:
- AI-powered insights reduce manual troubleshooting
- Multi-cloud support
- Automated anomaly detection
Cons:
- High learning curve
- Premium pricing
Migration Complexity:
Moderate, integration with cloud provider needed
Best Use Cases:
- Enterprise-level serverless application monitoring
- Applications requiring automated root-cause detection
8. Thundra
Thundra is designed specifically for serverless monitoring and debugging across multiple cloud providers. It provides insights into performance, errors, and cold starts. It offers deep visibility into AWS Lambda, Azure Functions, and Google Cloud Functions with end-to-end tracing. Developers and DevOps teams can quickly identify bottlenecks, optimize execution time, and improve overall reliability.
Key Features:
- Serverless dashboards and alerts
- Cold start monitoring and serverless performance metrics
- Distributed tracing and function profiling
- Supports AWS Lambda, Azure Functions, and GCP
Pros:
- Serverless-first approach
- Supports multi-cloud architectures
- Easy error detection and debugging
Cons:
- Smaller ecosystem compared to Datadog or New Relic
- Limited third-party integrations
Migration Complexity:
Low, plug-and-play integration with serverless apps
Best Use Cases:
- Debugging and monitoring serverless functions
- Applications requiring detailed function-level metrics
9. Epsagon
Epsagon focuses on serverless observability and automatic distributed tracing for cloud-native applications. It provides real-time monitoring of AWS Lambda, containers, and microservices with minimal setup. Epsagon helps teams troubleshoot faster by visualizing dependencies, errors, and performance bottlenecks.
Key Features:
- Serverless error tracking and alerts
- Distributed tracing and visualization
- Metrics and logs monitoring
- Multi-cloud support
Pros:
- Automatic tracing reduces manual setup
- Supports AWS Lambda, Kubernetes, and microservices
- Intuitive dashboards
Cons:
- Limited advanced analytics
- Pricing scales with usage
Migration Complexity:
Moderate, requires SDK integration
Best Use Cases:
- Observability for multi-cloud serverless applications
- Detecting bottlenecks in serverless workflows
10. Lumigo
Lumigo offers end-to-end serverless monitoring and debugging with real-time tracing of serverless workflows. It automatically detects errors, timeouts, and cold starts to help teams resolve issues quickly. Lumigo also provides visual service maps, making it easier to track dependencies across microservices.
Key Features:
- Distributed tracing across functions
- Cold start and error monitoring
- Real-time alerts and dashboards
- Performance metrics tracking
Pros:
- Detailed serverless function performance monitoring
- Easy visualization of function workflows
- Multi-cloud support
Cons:
- May require time to learn full platform
- Premium features require paid plans
Migration Complexity:
Moderate, SDK and cloud account integration required
Best Use Cases:
- Tracking complex serverless workflows
- Debugging and monitoring multi-function applications
Conclusion
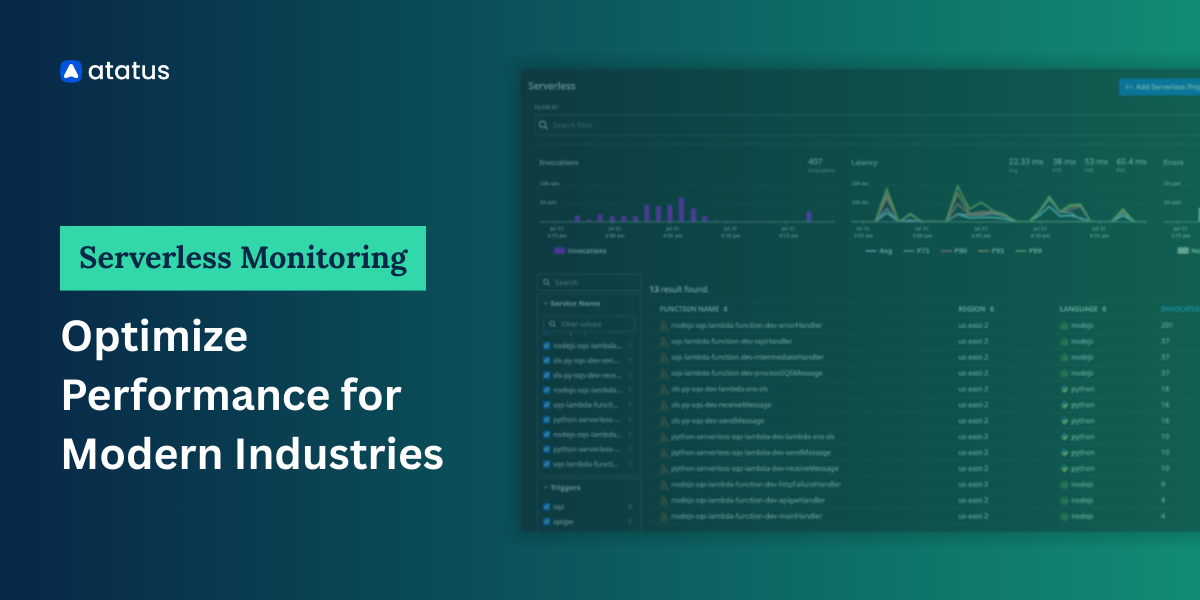
Serverless monitoring tools provide cross-cloud visibility, automated tracing, and in-depth insights into serverless workloads. These tools are ideal for teams running modern, event-driven applications and needing proactive performance, error, and dependency monitoring across multiple cloud environments.
Use serverless monitoring tools when:
- Your applications run on AWS Lambda, Azure Functions, or Google Cloud Functions.
- You need visibility into cold starts, execution times, and errors beyond what cloud-native tools provide.
- You want distributed tracing and end-to-end insights across multiple cloud providers and microservices.
Take the Next Step!
Serverless apps face latency, cold starts, and hidden errors—monitoring isn’t optional, it’s essential. Experience Atatus in action and start optimizing your serverless performance now.
Start Free Trial#1 Solution for Logs, Traces & Metrics
![]() APM
APM
![]() Kubernetes
Kubernetes
![]() Logs
Logs
![]() Synthetics
Synthetics
![]() RUM
RUM
![]() Serverless
Serverless
![]() Security
Security
![]() More
More