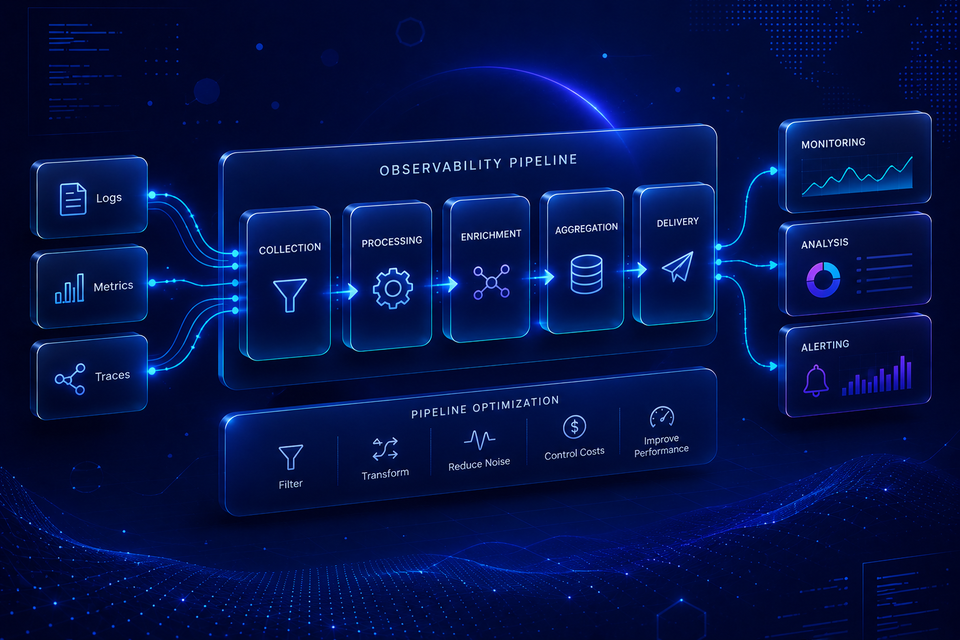
Learn how observability pipelines work, how to reduce telemetry costs, and how to build scalable pipelines for logs, metrics, and traces. Start optimizing with Atatus.
Sensitive data is hiding in your logs right now, including PII, API keys, JWT tokens, credit cards. Atatus Sensitive Data Classifier detects and redacts it automatically at ingestion, before it ever hits storage. Start your free trial today.
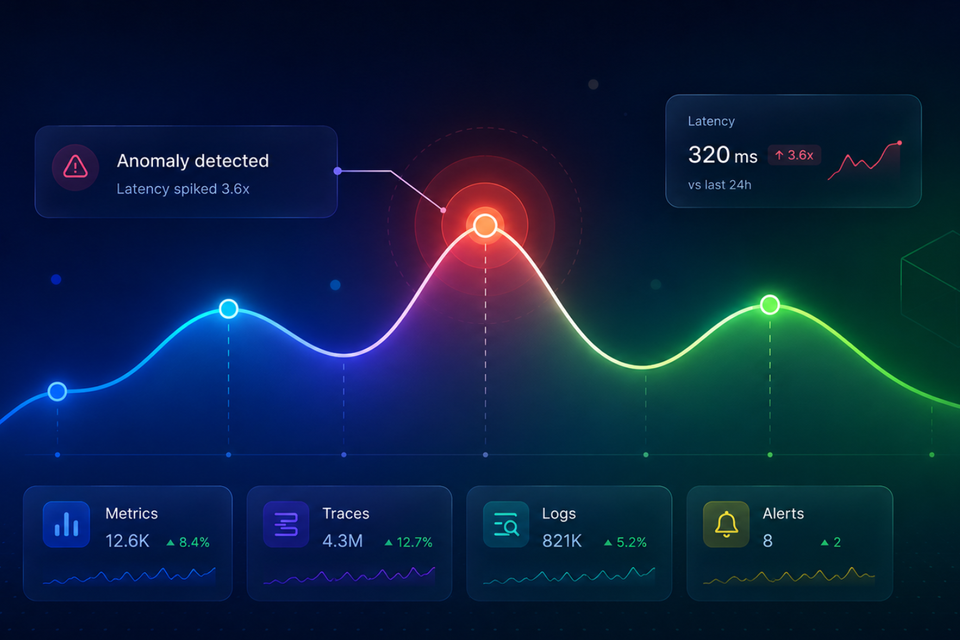
Static thresholds miss what matters. Learn how anomaly detection in observability automatically surfaces real issues across logs, metrics, and traces before your users notice anything is wrong.
Learn how to monitor, secure, and optimize your CI/CD pipeline with observability. Deliver faster, reliable software while detecting issues early with Atatus.
Top observability tools for monitoring web applications - Atatus, Datadog, ManageEngine, Site24x7, Splunk, AppDynamics, Dynatrace, LogicMonitor, New Relic, Grafana.
New Relic and AppDynamics are leading observability tools. New Relic offers APM, log, and infrastructure monitoring, while AppDynamics specializes in deep application and business transaction monitoring. Check out the comparison to choose the right tool.
Explore a hands-on review of New Relic vs. Splunk, comparing key aspects such as APM, log management, machine learning capabilities, pricing, and more.
Discover the top 15 observability tools for 2026. Get in-depth insights, key features, and pricing and see how Atatus stands out with unified, next-gen observability built for scale.
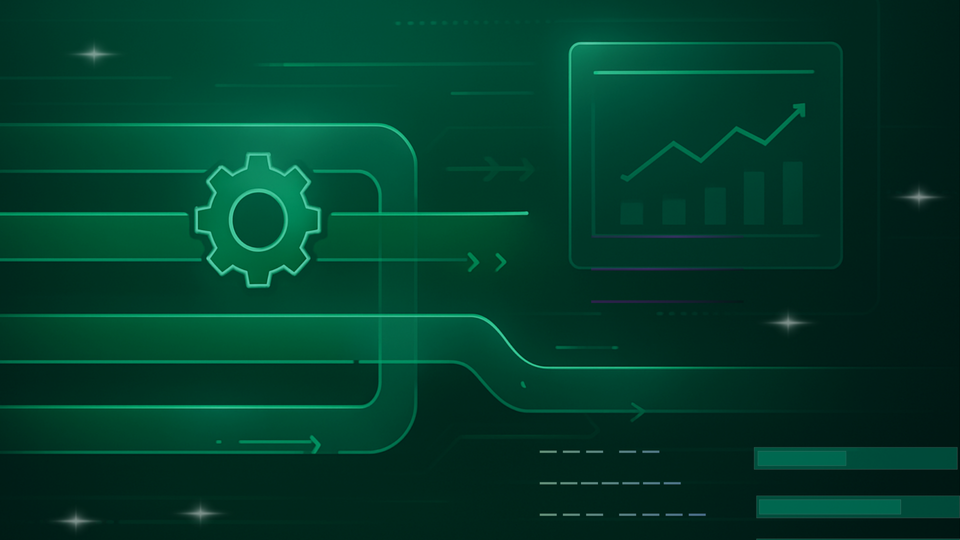
Unlock the power of observability to reduce IT costs and downtime. Discover how Atatus can streamline troubleshooting and optimize resource allocation.
Monitor your entire software stack
Gain end-to-end visibility of every business transaction and see how each layer of your software stack affects your customer experience.

![30+ Top Observability Tools to Monitor Websites and Applications [2026 Updated]](/blog/content/images/size/w960/2023/01/observability-tools.png)
![New Relic vs Splunk - In-depth Comparison [2026]](/blog/content/images/size/w960/2024/10/Datadog-vs-sentry--19-.png)
![How Observability Cuts IT Costs? [7 Proven Ways to Reduce Infra, Storage and Operational Spend for 2026]](/blog/content/images/size/w960/2025/11/How-Observability-Cuts-IT-Costs.png)