30+ Top Observability Tools to Monitor Websites and Applications [2026 Updated]
![30+ Top Observability Tools to Monitor Websites and Applications [2026 Updated]](/blog/content/images/size/w960/2023/01/observability-tools.png)
By incorporating observability tools into your stack, you can better understand how your complex infrastructure operates, reduce downtime, and empower developers to identify and fix problems quickly.
However, it now takes considerably more work, time, and money to build the best observability tools for your infrastructure and applications. According to a Splunk survey, over half of the firms polled employ eight or more observability tools.
Emerging solutions can meet your demands regardless of whether you are utilizing a microservices-based architecture, Kubernetes, a public cloud, hardware, networking, or a traditional IT stack. In this article, we'll learn about a few of them.
We will go over the following:
- Atatus
- AppOptics
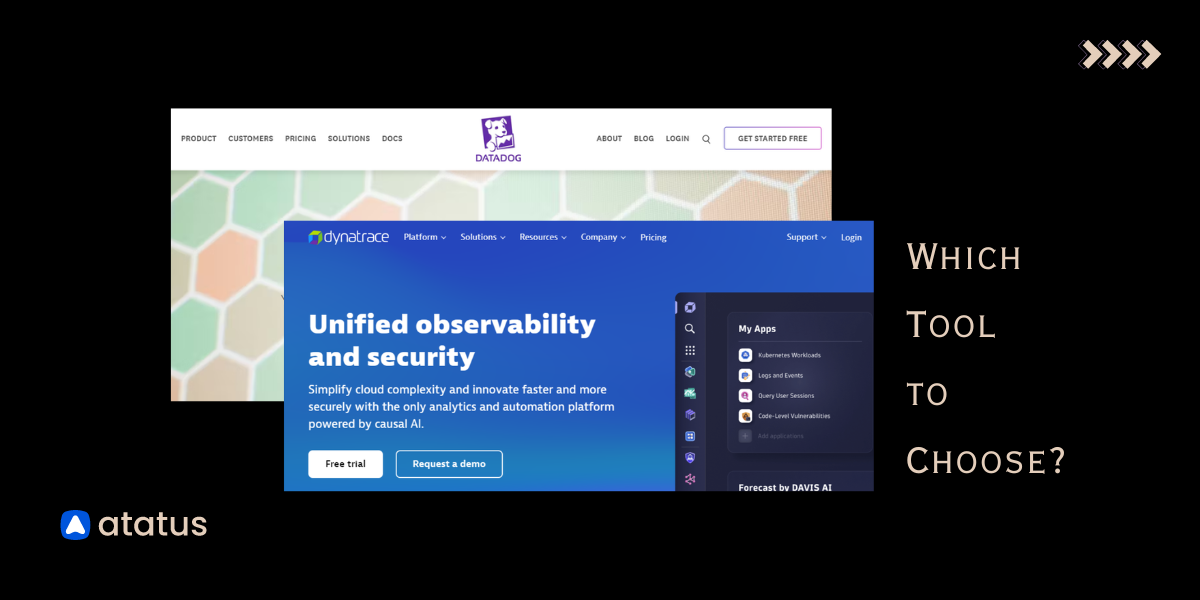
- Datadog
- ManageEngine
- Site24x7
- Splunk
- AppDynamics
- Dynatrace
- LogicMonitor
- Monitis
- Nagios
- New Relic
- Pingdom
- Sumo Logic
- UptimeRobot
- Airbrake
- Better Uptime
- Rollbar
- Logmatic
- Sentry
- Grafana
- Instana
- AppNeta
- Epsagon
- Prometheus
- Honeycomb
- Sematext
- Icinga
- Zabbix
- Checkmk
- Netdata
- Observium
- PRTG Network Monitor
#1 Atatus
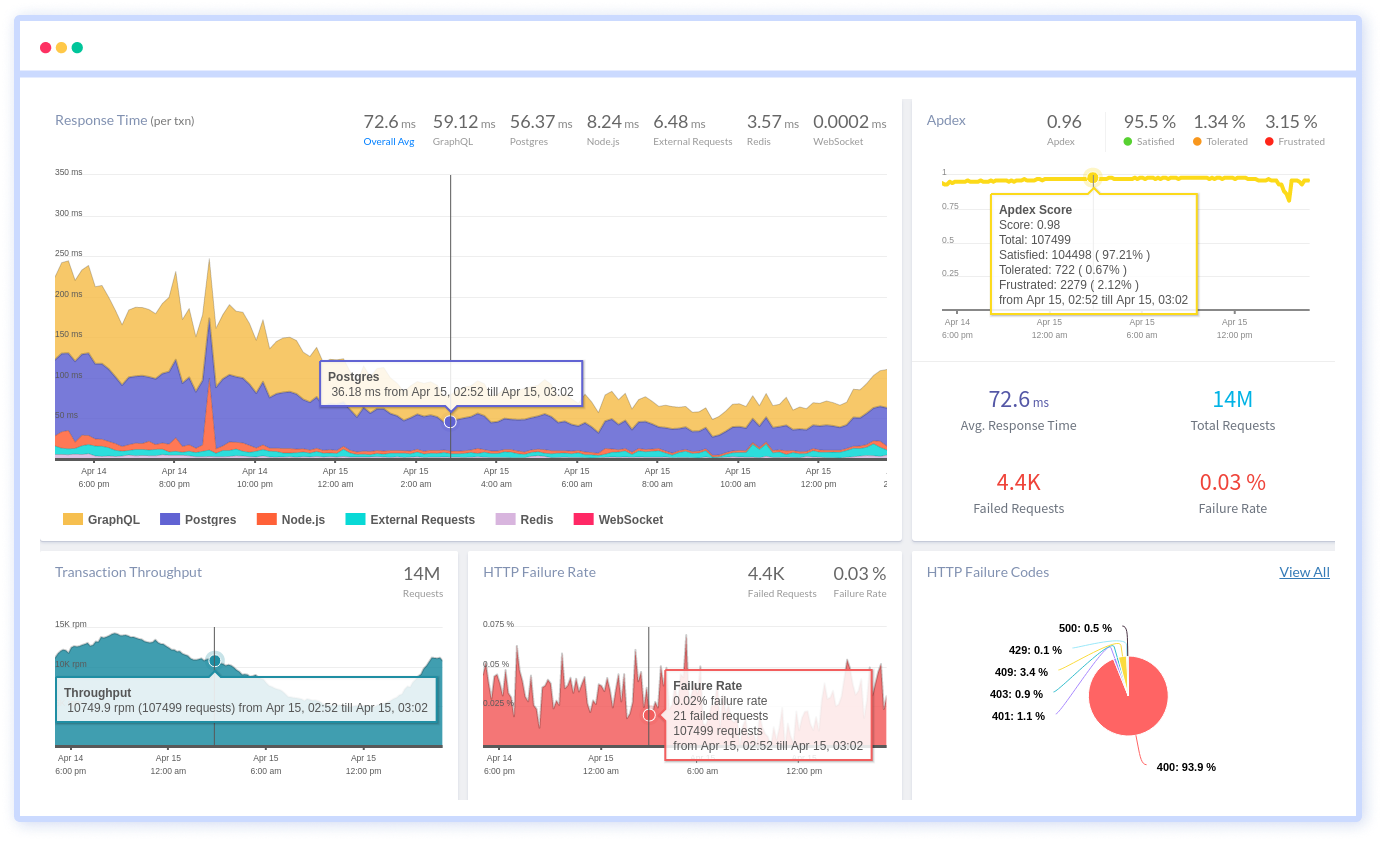
Atatus is a SaaS-delivered application performance and error-tracking observability tool that offers full-stack visibility for all of your applications.
The platform can dynamically collect millions of performance data points from across your applications, enabling you to resolve issues more rapidly and enhance the digital user experience. With the flexibility of cloud or on-premise deployment, everything takes place in the field in real time.
Atatus ensures that your teams thoroughly understand all the performance metrics required to produce high-quality and dependable software. As soon as a problem arises, you can find out who, when, and what caused the performance bottleneck.
Atatus offers you various features to track the functionality of your apps and send you notifications when there are problems with the user experience. It's among the top choices in observability tools and microservices monitoring tools, providing invaluable insights into your system's health and performance.
#2 AppOptics
AppOptics is a SaaS-based, next-generation application performance management (APM) observability tool from SolarWinds. With distributed tracing, over 150 integrations, and custom metrics that all feed into the same dashboarding, analytics, and alerting pipelines, AppOptics is a seamless application and infrastructure microservices monitoring solution that was created to address the issues associated with separate monitoring and observability tools.
#3 Datadog
DataDog is a SaaS-based infrastructure monitoring and observability tool with many integrations. It enables DevOps teams to monitor evolving cloud native observability environments. This makes it simple to see the overall condition of your infrastructure by location, application, or service.
The DataDog agent is ideal for users with cloud or hybrid infrastructures since it can run on cloud platforms, bare metal servers, virtual machines, containers, and more.
#4 ManageEngine
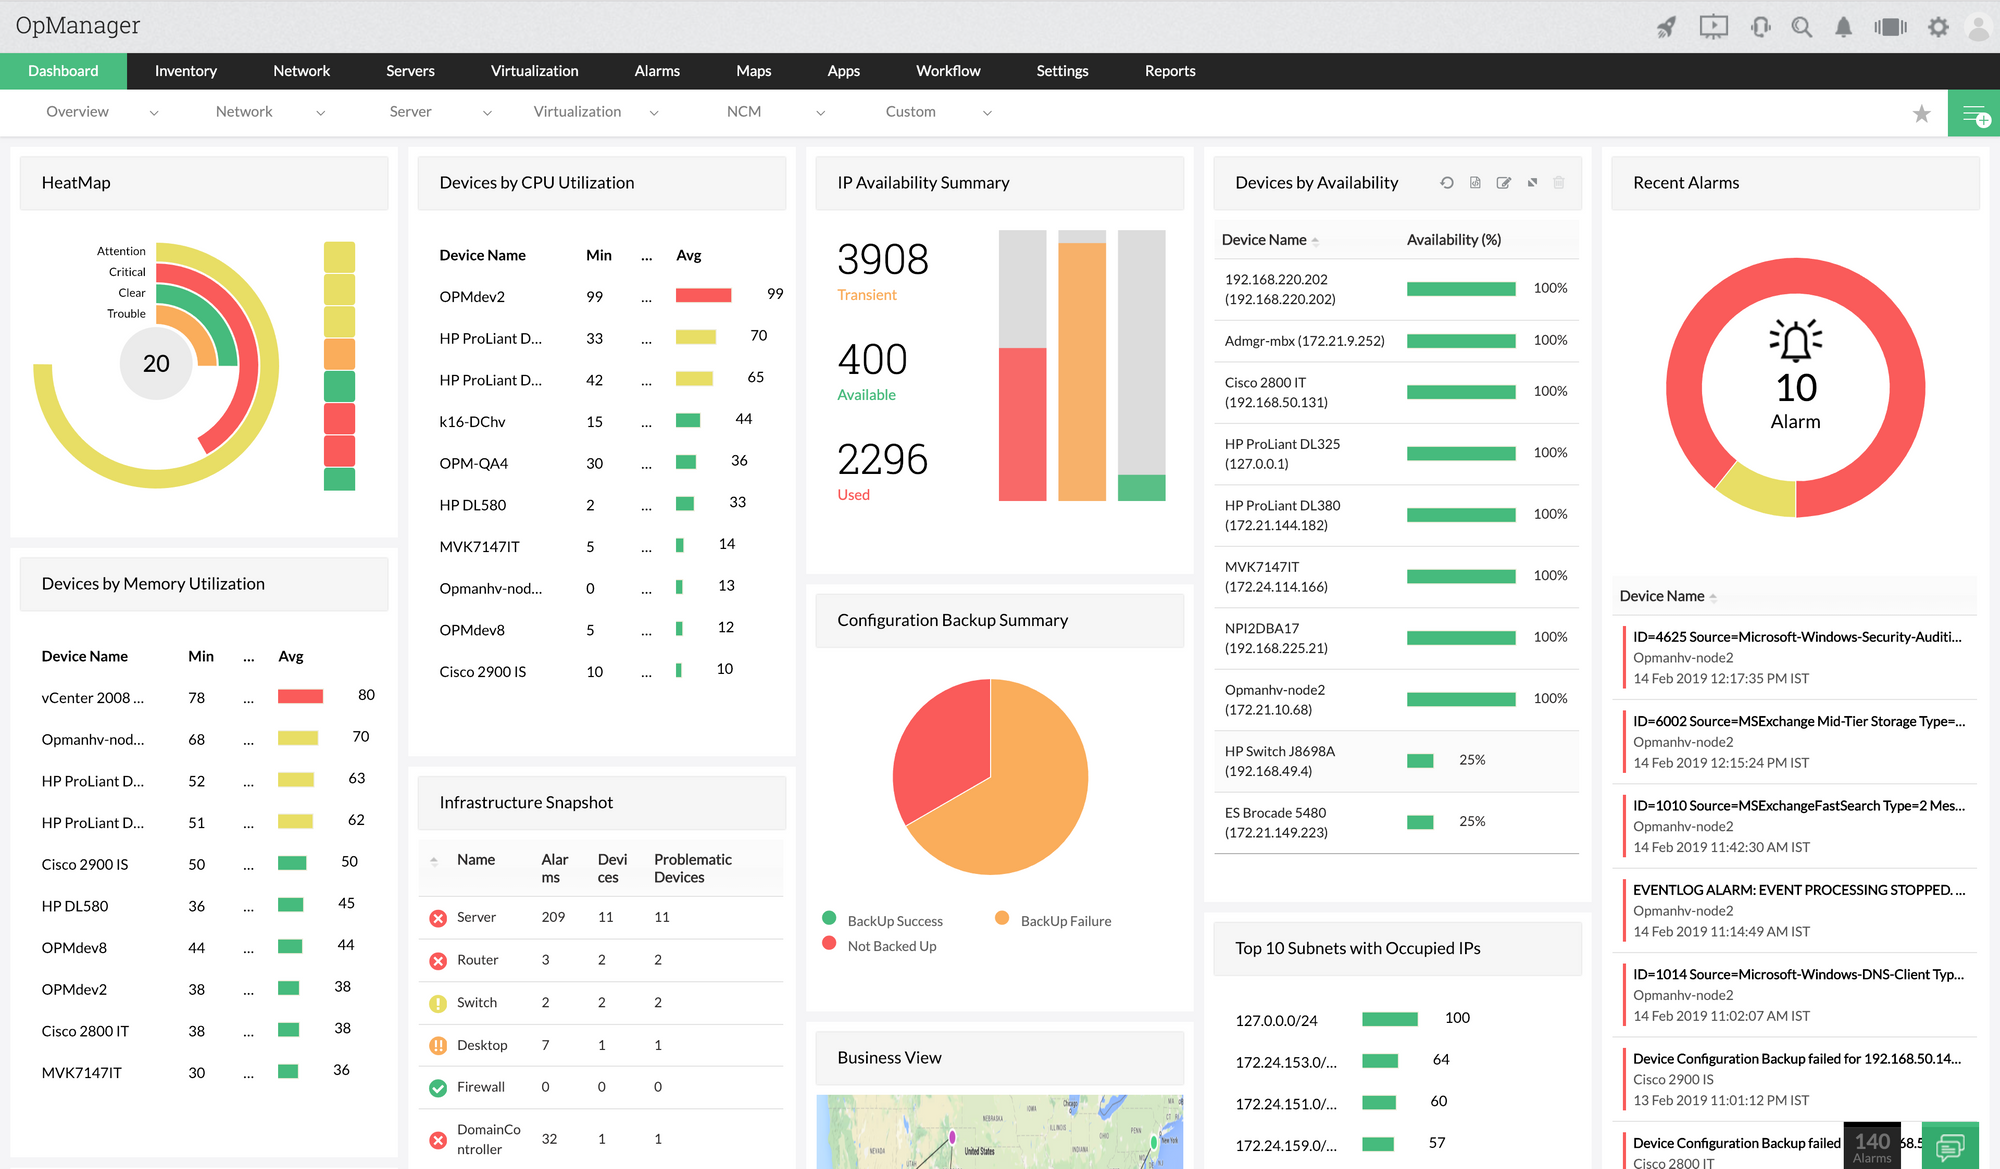
ManageEngine Applications Manager is a server and application performance monitoring and observability tool offering complete insight down the line of code. For all server and application monitoring tool requirements, from server and infrastructure components that support a business to business-critical applications responsible for service delivery, the package offers integrated application performance monitoring.
In terms of cloud applications, application servers, web services, and other areas, ManageEngine Applications Manager supports over 100 major technologies.
#5 Site24x7
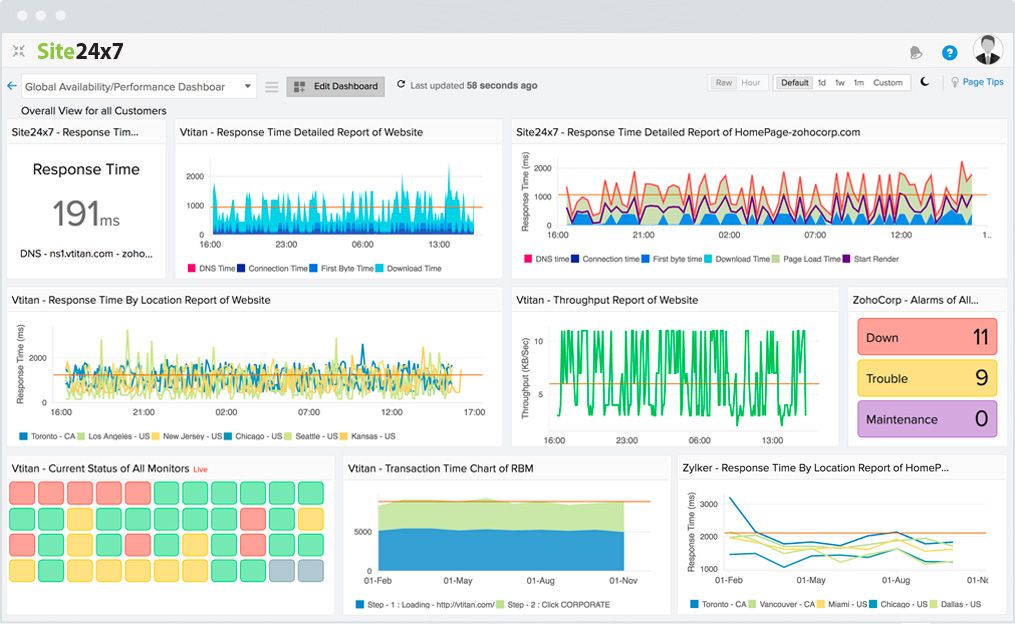
Site24x7 is a complete stack provider of performance monitoring and observability tools. Its microservices monitoring tool features extend to assessing the user experience of actual people visiting websites and applications from desktop and mobile devices.
It provides cloud monitoring for DevOps and IT operations. The business supports DevOps teams in monitoring and troubleshooting network observability tools infrastructure, including private cloud and public cloud, as well as servers, applications, and servers.
#6 Splunk
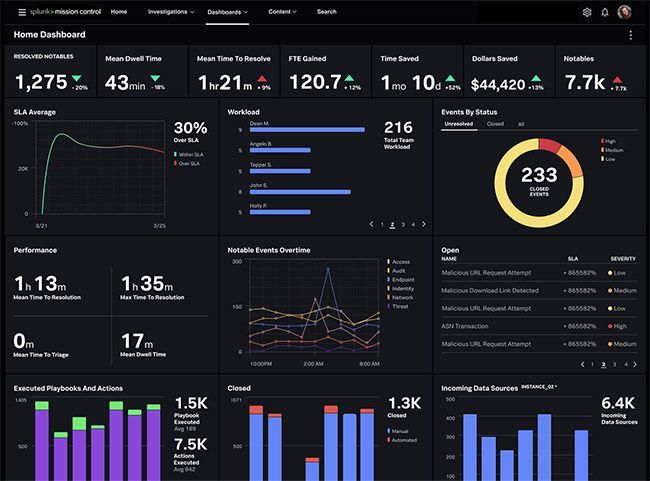
Splunk is the only full-stack, analytics-powered, and OpenTelemetry-native observability tool for looking up, tracking, and analyzing machine-produced data. Whether you use packaged, on-premises applications or cloud-native observability web applications, Splunk provides end-to-end insight across your stack.
The platform offers a high-level view of the functionality and efficiency of applications and services. Additionally, it enables users to conduct more thorough investigations to aid outage prediction and quickly identify a problem's main cause.
#7 AppDynamics
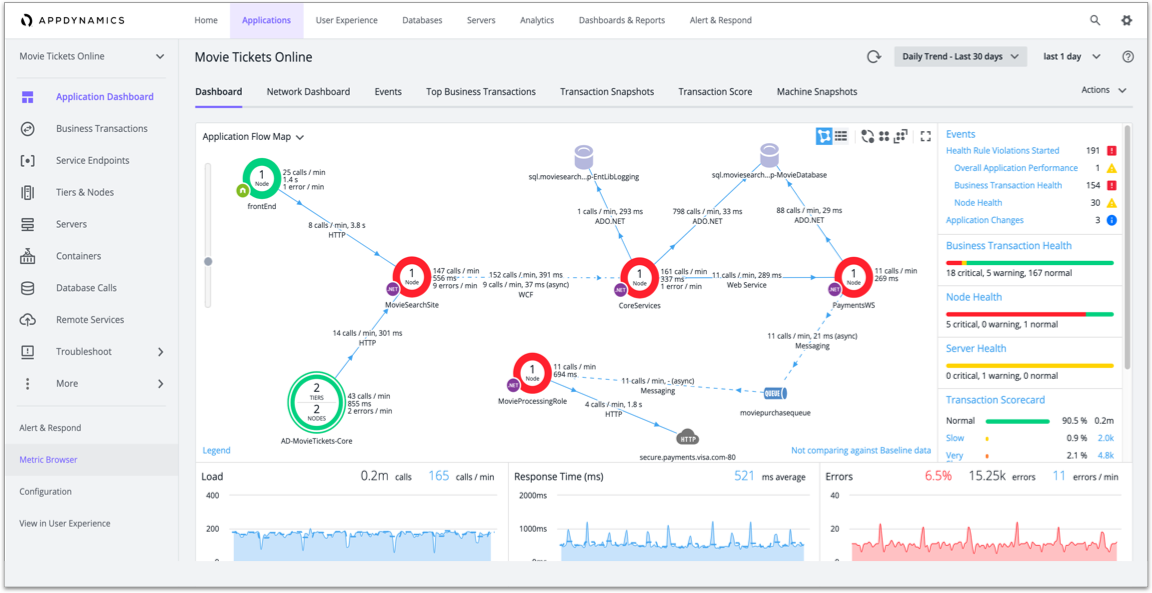
AppDynamics is a set of application performance monitoring and observability tools that enables users to improve employee and consumer digital experiences. The applications, which are developed on an enterprise-grade platform, boost digital transformations to increase customer engagement and operational effectiveness.
The APM features of AppDynamics offer visibility into each line of code and crucial transactions within multi-cloud setups. Other capabilities include business performance monitoring, infrastructure visibility, and end-user monitoring.
#8 Dynatrace
Dynatrace Software Intelligence Platform is a network, application, and infrastructure monitoring platform that includes AIOps, digital experience management, and digital business analytics.
Users can observe how they are performing and instantly identify microservices that are performing poorly since the platform automatically detects and monitors microservices running within containers.
With the help of PurePath Technology from Dynatrace, timing, and code-level context are automatically recorded for all transactions at every tier. This makes Dynatrace a top choice among observability tools for complete monitoring and analysis
#9 LogicMonitor
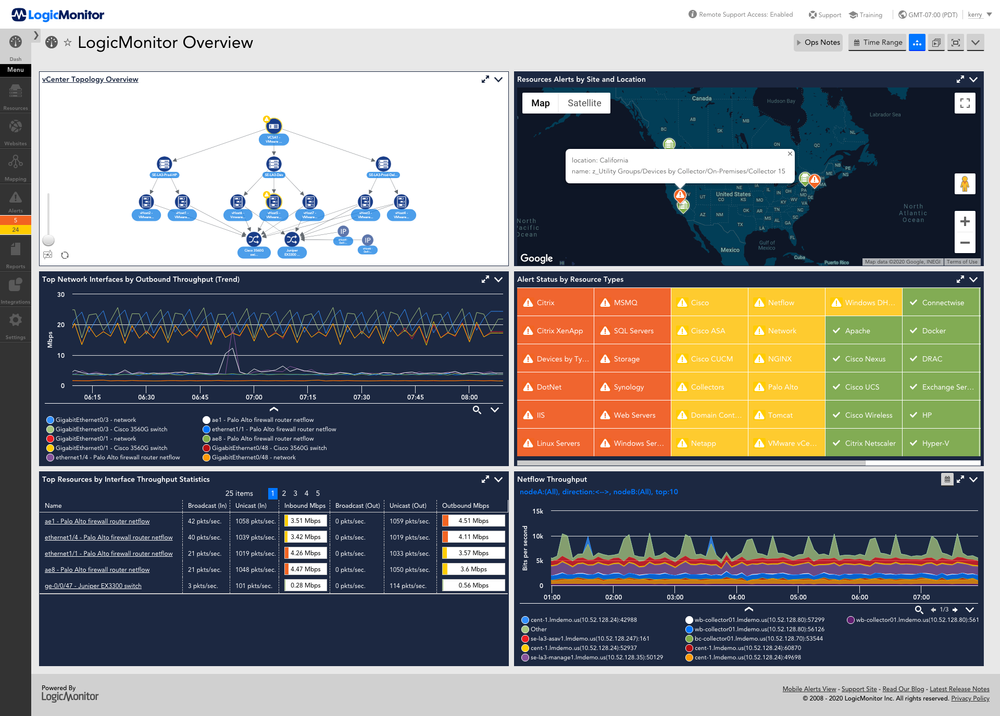
LogicMonitor offers SaaS-based data center monitoring of physical, virtual, and cloud-based IT infrastructures. Performance monitoring, historical trending, reporting, and email/SMS alerting are all features of the software that help IT employees be forewarned of potential problems before they can disrupt operations.
From a single web-based panel, LogicMonitor offers a pre-configured, out-of-the-box monitoring tool for most suppliers of switches, routers, firewalls, load balancers, servers, applications, databases, VoIP systems, and storage.
#10 Monitis
Monitis was established in 2006 to offer a comprehensive cloud-based observability monitoring solution to company executives, IT professionals, and service providers.
Since Monitis is a cloud-based solution, very little software needs to be downloaded to use most of its features. Although some services necessitate the installation of an agent or the integration of certain code into the website, etc., they normally involve little work and can be finished quickly.
#11 Nagios
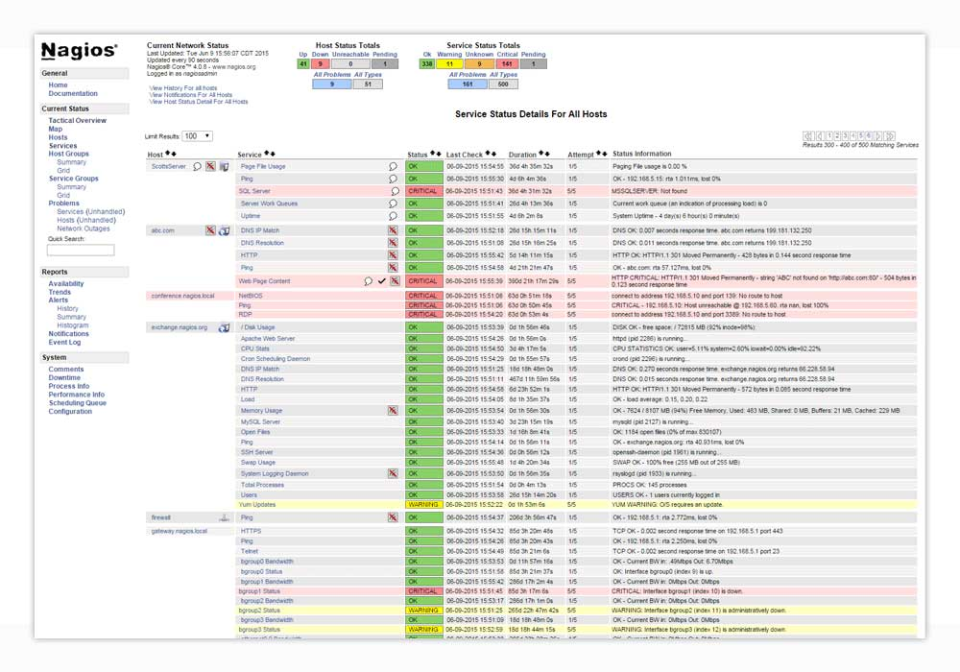
ccan support system, application, service, and business process monitoring observability tools in DevOps environment. It offers capabilities for tracking all types of applications, including Windows, Linux, UNIX, and Web apps, and their current states.
This tool runs tests quickly and can be set up easily on both the client and server sides. It monitors the network's switches, routers, and other hardware to look for network overload and other issues. Nagios enables flexibility to monitor your servers using agent-based and agentless monitoring, with over 5000 different add-ons readily available.
#12 New Relic
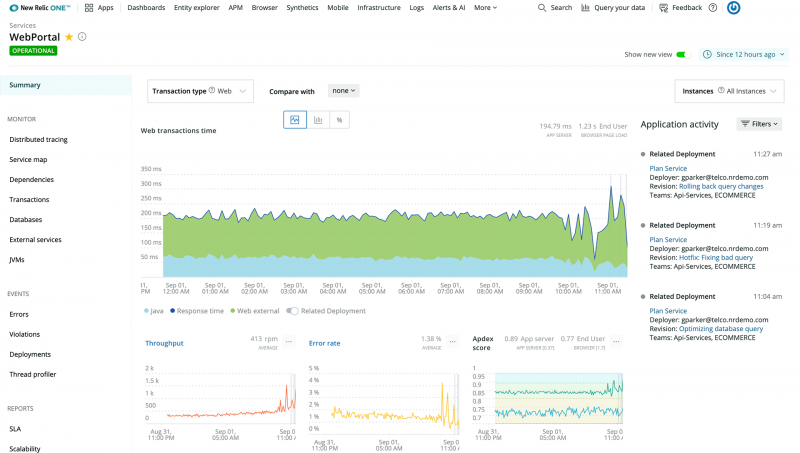
New Relic is a cloud-based monitoring tool that offers full-stack observability in a single secure cloud. It supports applications created in Ruby, Java, .Net, PHP, and Python.
Due to its pay-as-you-go Mechanism, teams can correlate a complete stack to visualize and debug issues more quickly, and they only pay for the resources they really utilize.
A live and detailed view of your network, infrastructure, applications, end-user experience, machine-learning models, and more is provided via full-stack monitoring. When a model gets less accurate, warnings and alarms from New Relic Applied Intelligence help to increase trust.
#13 Pingdom

Pingdom is a service that tracks a website's uptime, downtime, and performance. It monitors websites from various locations worldwide to distinguish between true downtime and access and routing issues.Pingdom uses servers spread across several nations to gauge the websites it monitors' response times. It can indicate whether a website is down due to network breaks or DNS server failure.
Pingdom works by often visiting websites to determine whether they are user-accessible. Once the software deems that the website is once again operational, it will continue to monitor it more frequently. Pingdom is widely recognized as one of the top observability tools for ensuring website reliability and performance.
#14 Sumo Logic
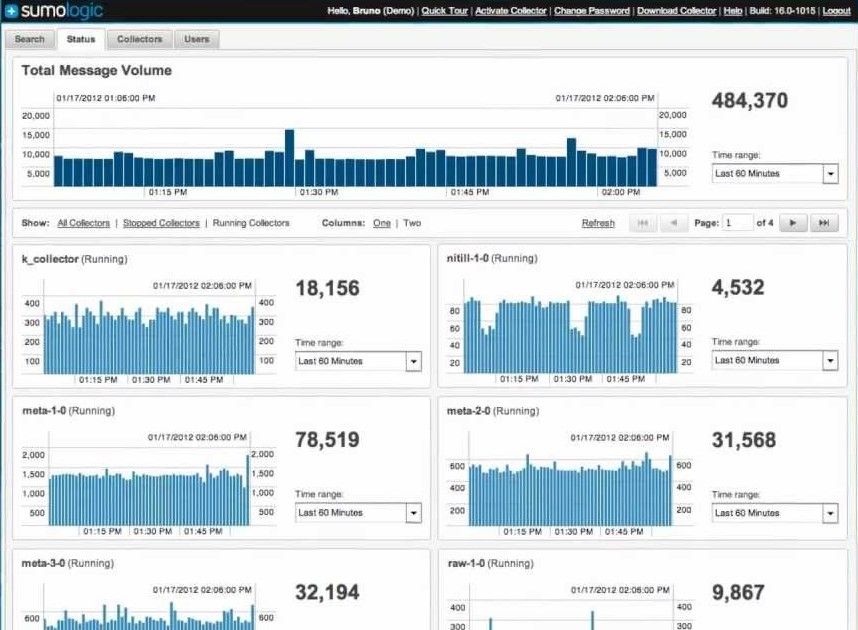
Sumo Logic's Application Observability tool offers visibility into performance metrics, logs, and events, as well as distributed tracing, and is a highly scalable, secure, and economical analytics platform. It provides automated finding of new infrastructure and services in pre-made dashboards.
Application issues can be diagnosed more quickly by displaying the service dependencies in service maps. Real user monitoring records every click made within the application and rapidly identifies underperforming pages. Use the Root Cause Explorer, which is powered by ML, to automate anomaly detection.
#15 UptimeRobot
UptimeRobot is an online uptime monitoring service that monitors website uptime. You can ping your server, examine the content of a website, check up on up to 50 URLs, and check your ports every five minutes. To demonstrate your uptime, you can develop a status page.
You can use the Heartbeat monitor to keep an eye on your cron processes or monitor SSL certificates. You can adjust and control your monitoring with maintenance windows or advanced notifications to avoid receiving alerts during maintenance or to start receiving notifications after a specific amount of downtime. UptimeRobot serves as a reliable observability tool for ensuring the continuous availability and performance of your online services.
#16 Airbrake
Airbrake is a lightweight APM for error and performance monitoring tool. It enables developers to track the performance and availability of their applications.
It is used by thousands of engineering teams around the globe to record, group, and notify software exceptions, which enables them to identify and address defects more quickly. Every month, Airbrake processes over 600 million errors for organizations including Zendesk, Groupon, TED, Soundcloud, and countless others.
#17 Better Uptime
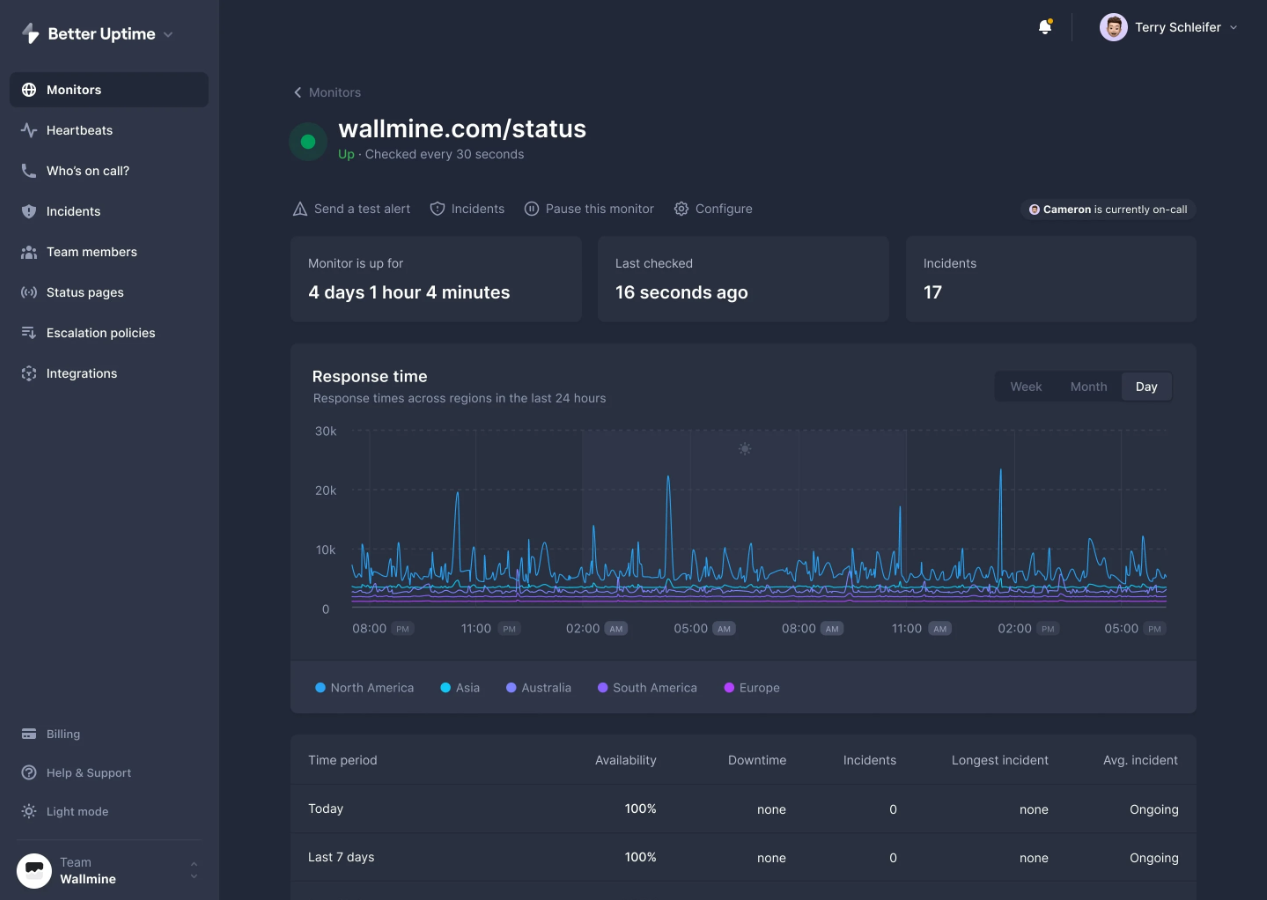
Better Uptime is a vastly improved infrastructure monitoring and observability tool that notifies the appropriate team member when something goes wrong. Schedule on-call responsibilities, get useful notifications, and work together more quickly than ever to resolve incidents.
Get a lovely branded status page for your domain so you can educate your users. It is made with more than 100 integrations to fit into your workflow.
#18 Rollbar
Rollbar is a bug-tracking and monitoring tool available in the cloud for businesses of all sizes. It supports numerous programming languages and frameworks, including JavaScript, Python, .NET, Drupal, WordPress, and Pyramid.
Rollbar offers customers the flexibility to modify these grouping rules and provides automated error grouping depending on an issue's primary cause. Users can set and order notifications using notification filters according to the type of error. Additionally, the system has workflow control features that let users mark concerns as active, resolved, or muted.
#19 Logmatic.io
Logmatic.io is a SaaS log management tool that enables customers to monitor and debug applications more effectively and quickly. It is also a platform for operations data, including machine and log events. By utilizing machine data, we assist businesses in enhancing the effectiveness of their software and operations.
You can get a clear overview of what's happening throughout your distributed environments, and you'll quickly find the proverbial needle in the haystack. Logmatic.io serves as a powerful observability tool for gaining insights into distributed environments and optimizing software performance and user experience.
Create dynamic assessments and pinpoint improvements for your business, your software, and the user experience.
#20 Sentry
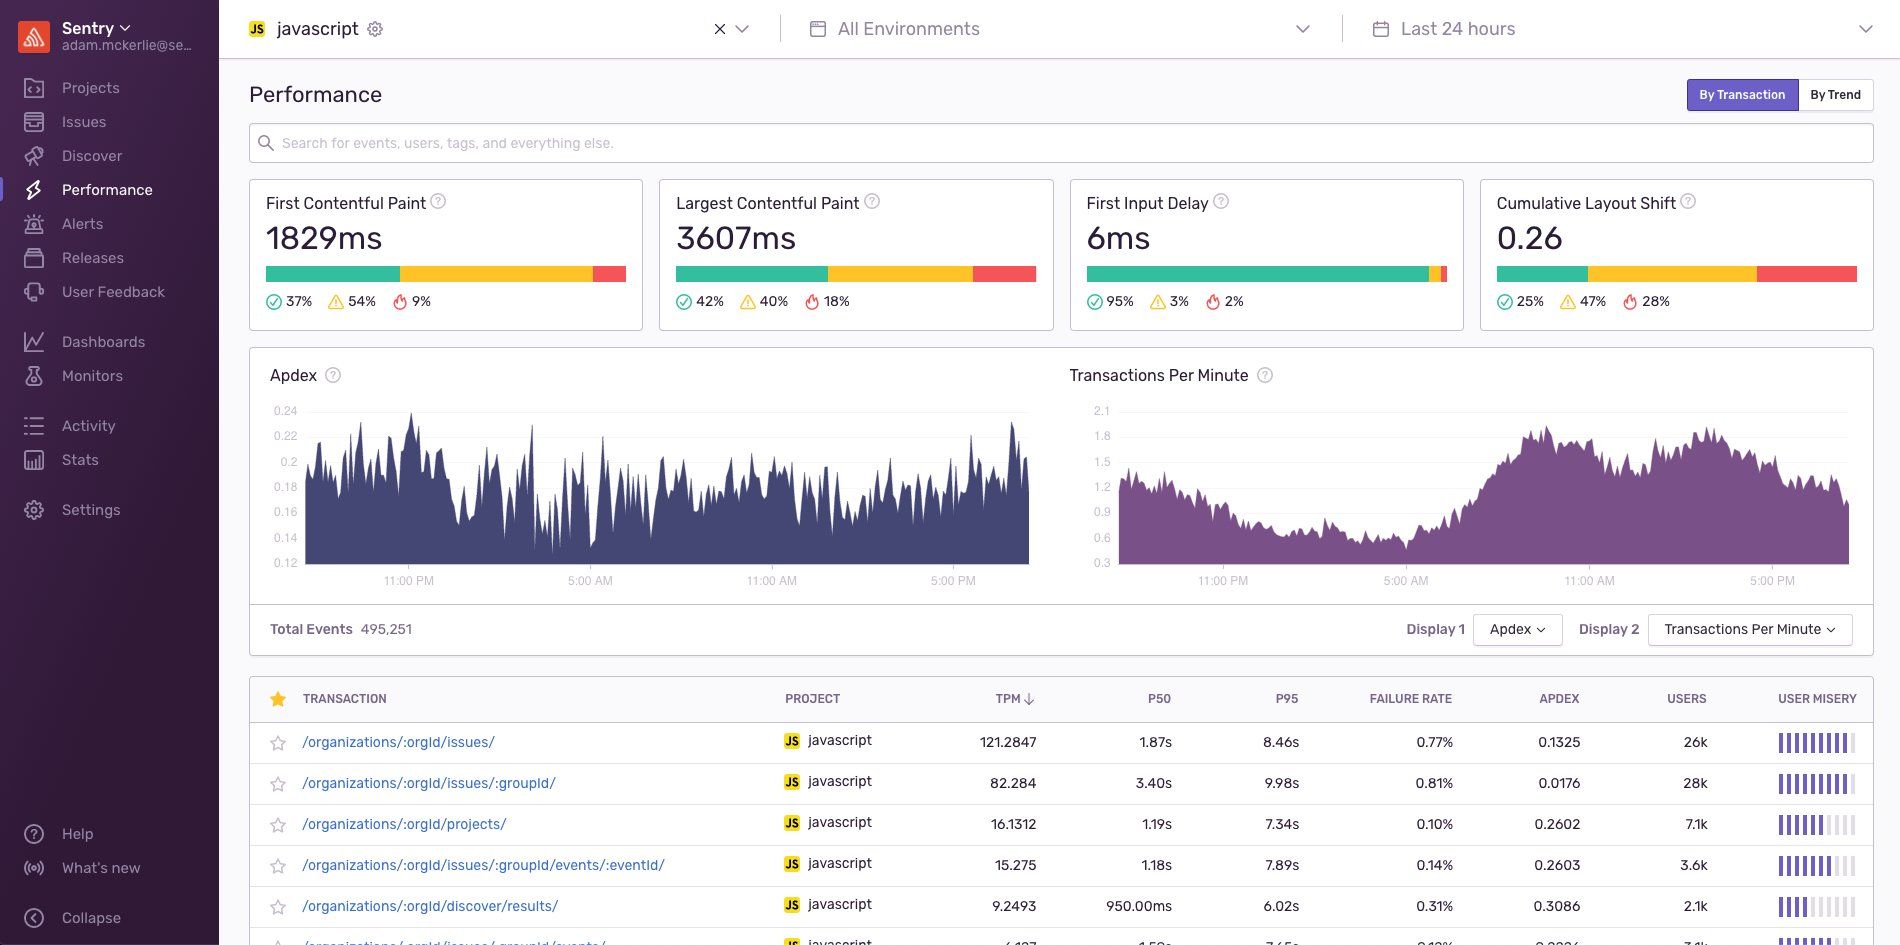
Sentry offers real-time error tracking for your web, mobile, and gaming applications, giving developers the knowledge they need to identify and fix errors. Sentry was developed at DISQUS as an open-source observability platform project to address the issue of exception logging in a Django application.
Since then, it has expanded to support a wide range of well-known programming languages and operating systems, including Python, PHP, Java, Ruby, Node.js, and JavaScript.
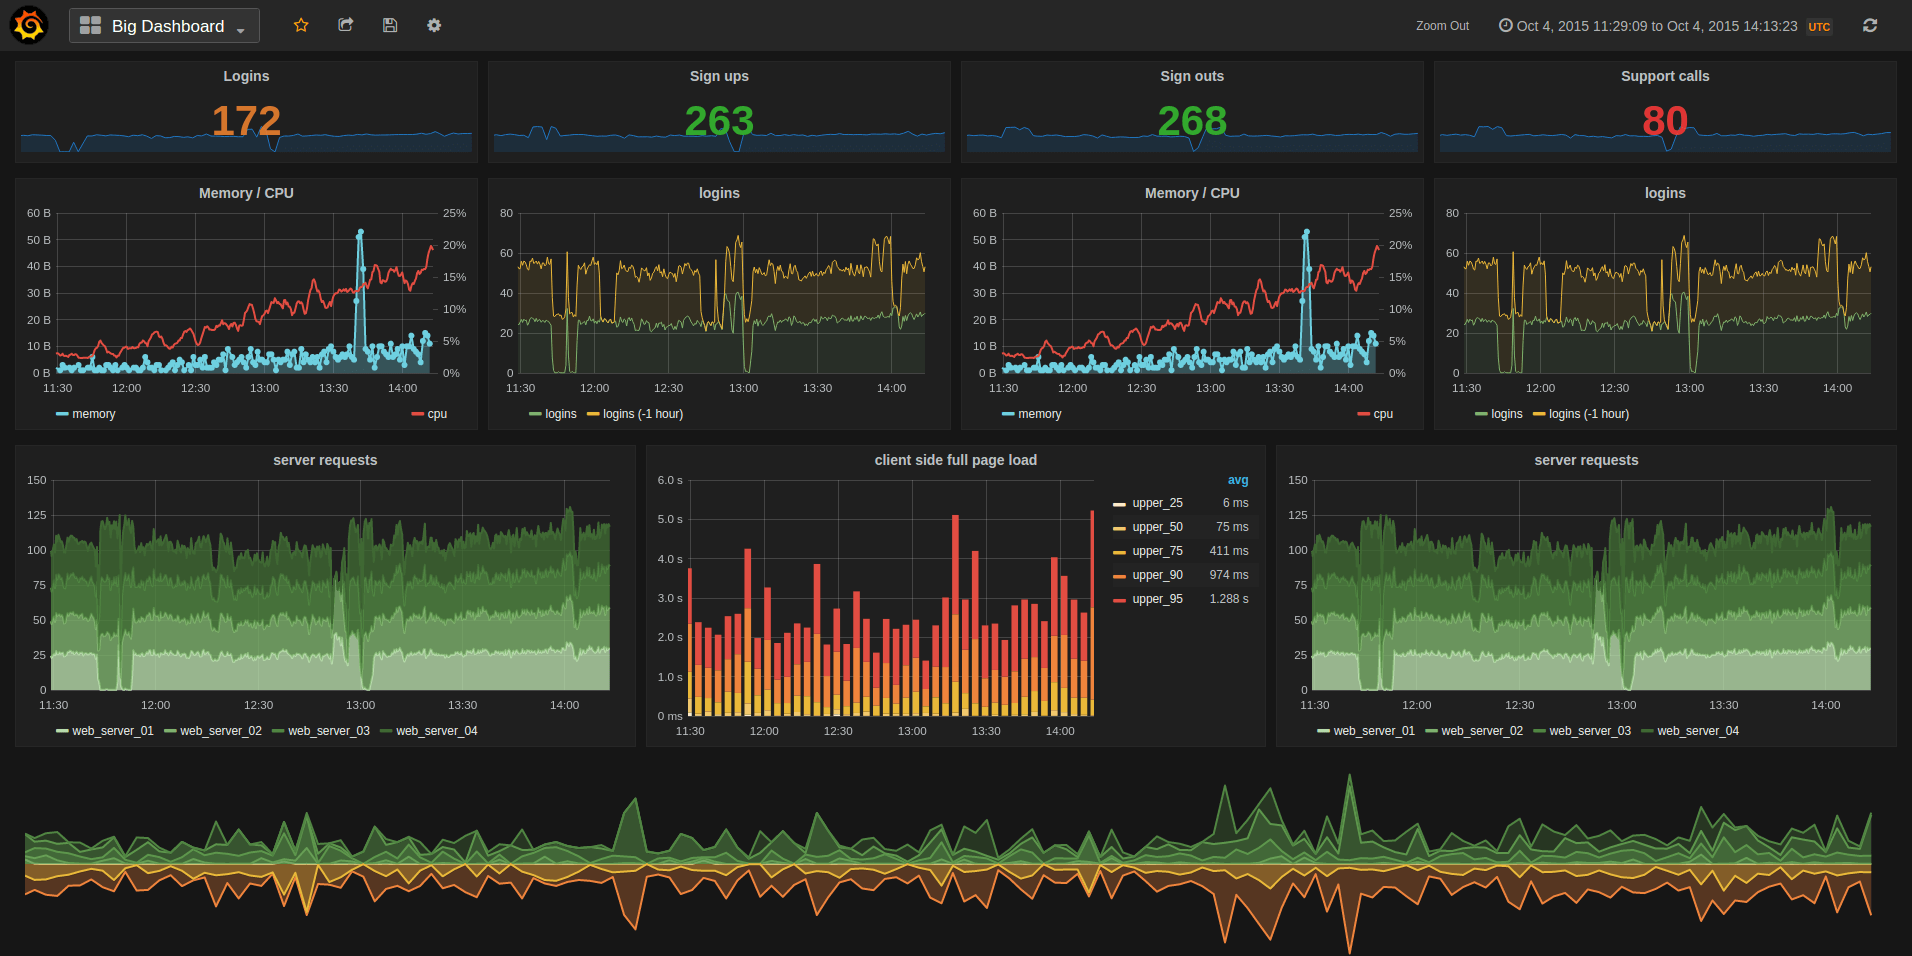
#21 Grafana
Grafana, a well-known open-source observability platform for analytical and visualization web layers, now offers a comprehensive observability stack with Grafana Cloud. Their tools, including Tempo for tracing, Prometheus for metrics, and Loki for logs, make the offering an exceptional value for someone just getting started with observability.
Additionally, they provide self-managed versions of their technologies, which has become the norm. This is quite advantageous due to the extensive ecosystem support and accessibility of ready-made dashboards for a range of tools and use cases.
#22 Instana
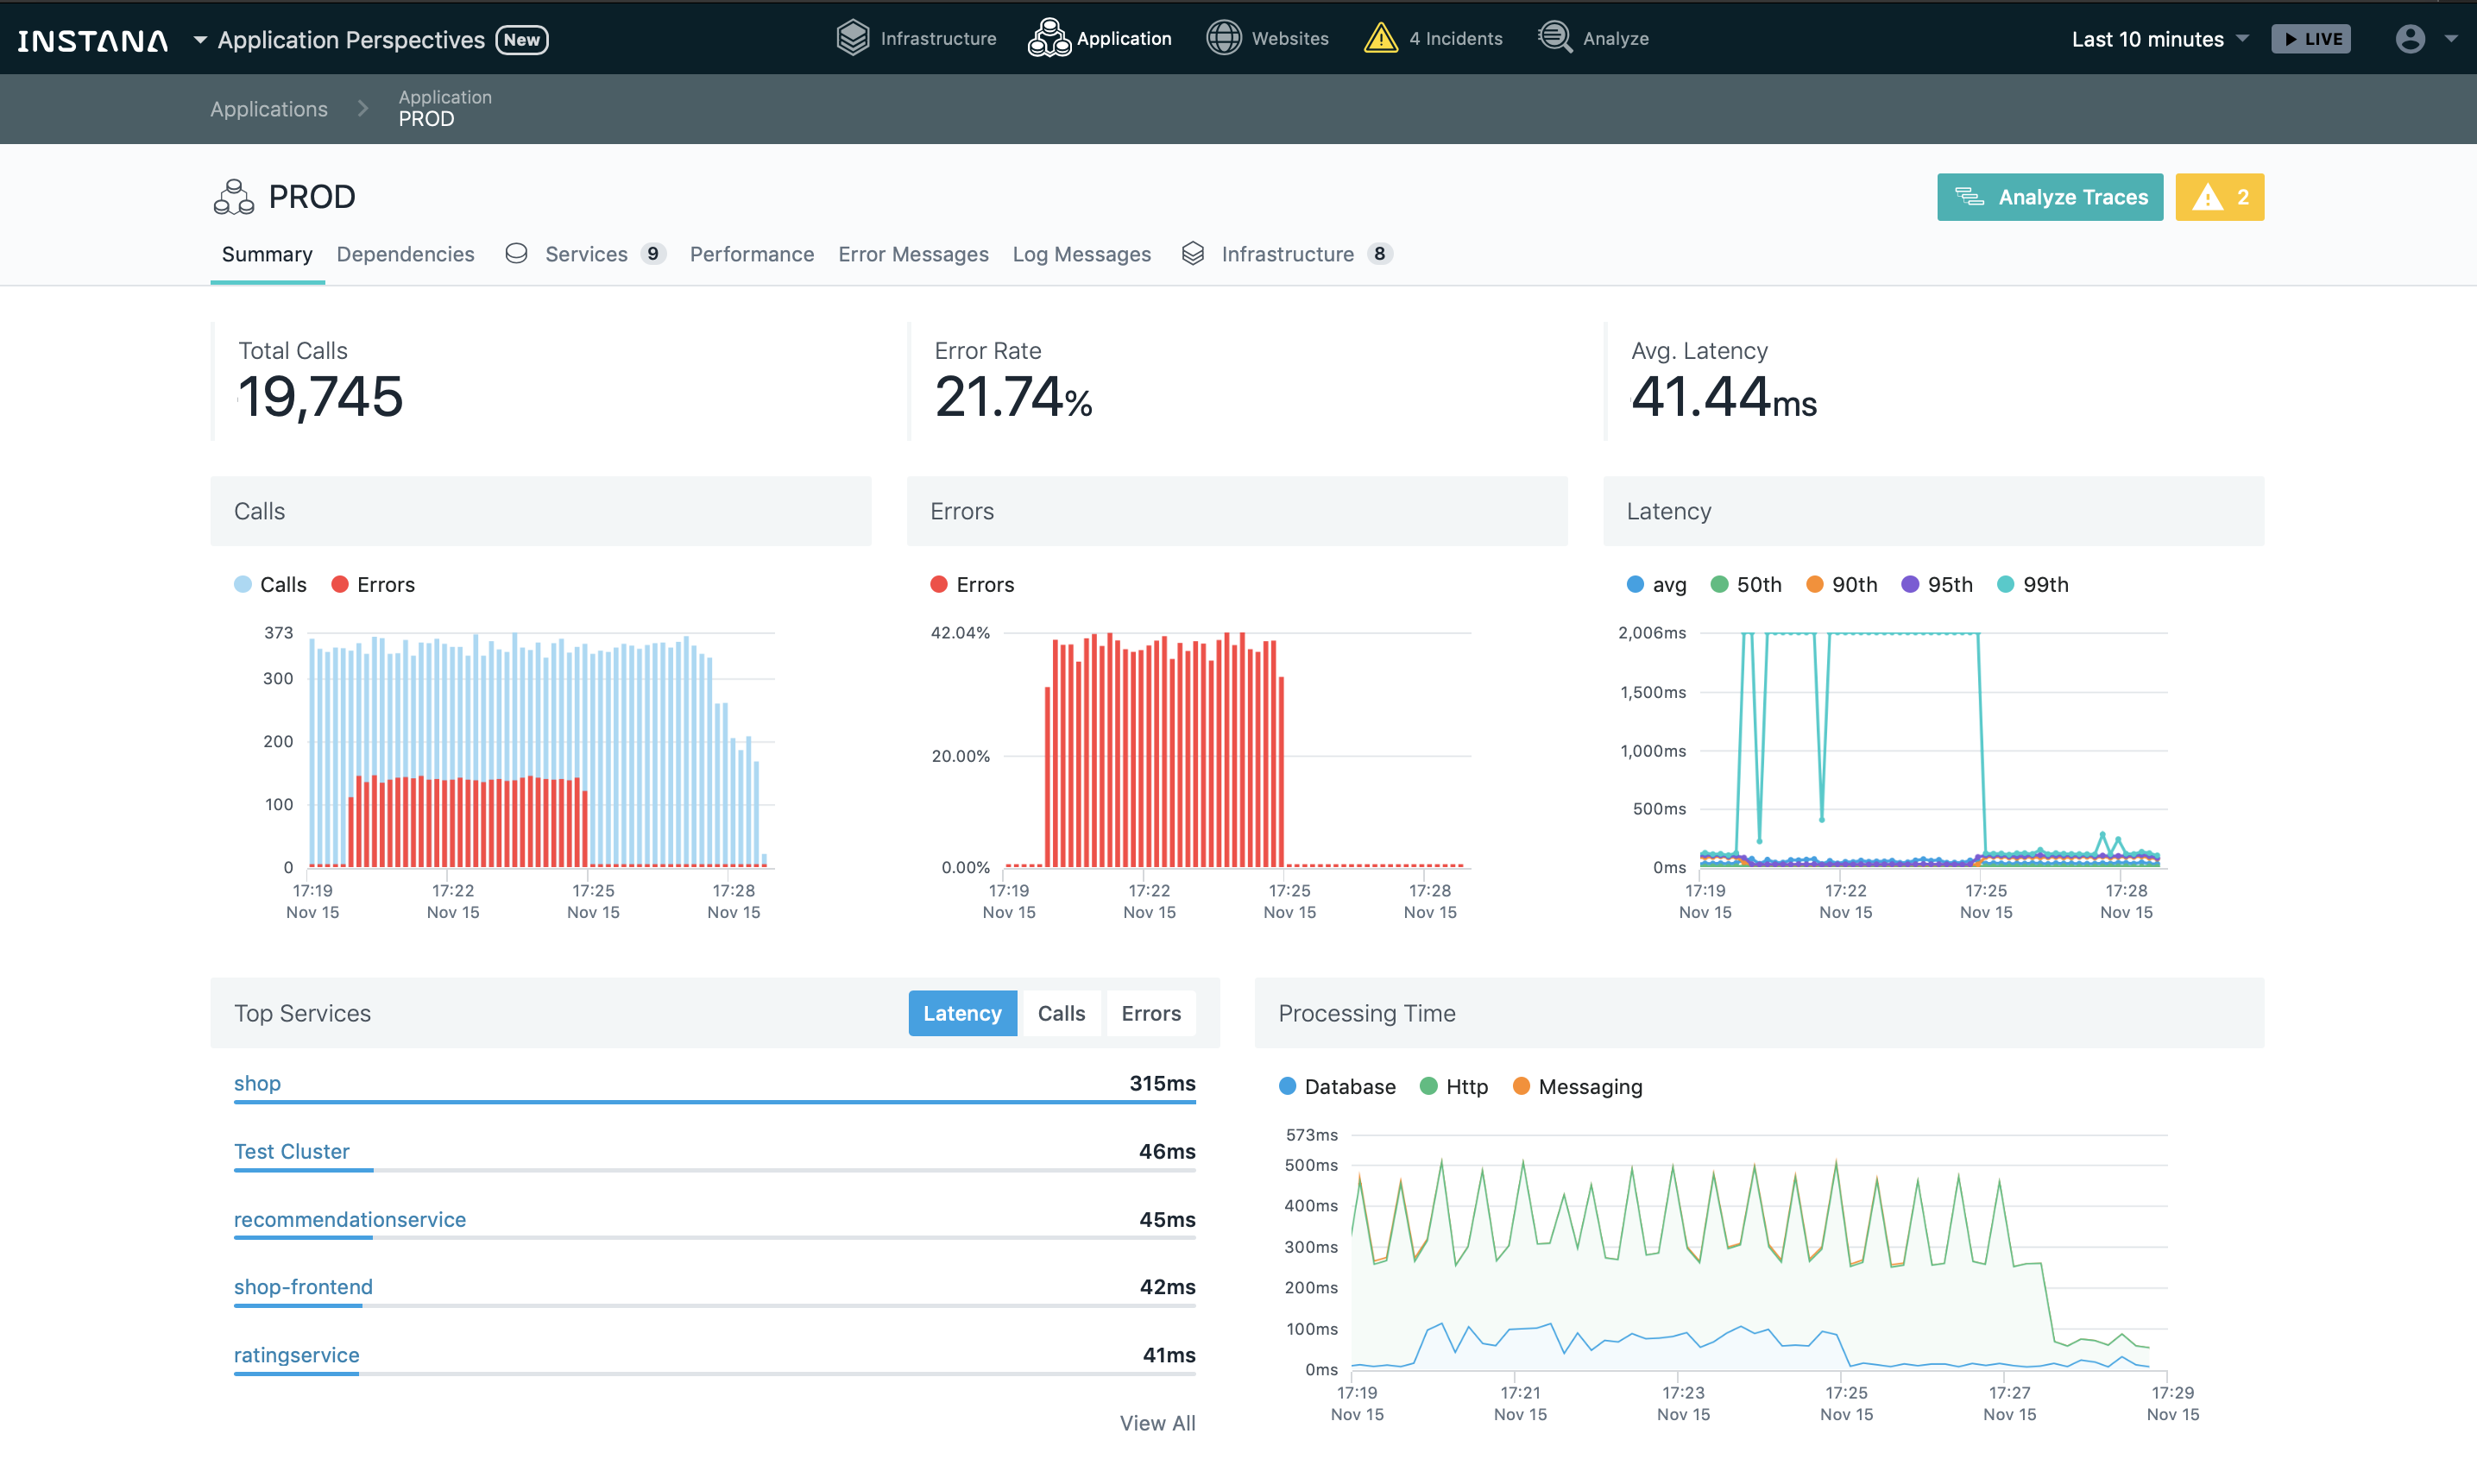
Instana is an application performance monitoring tool that manages services, infrastructure, containers, websites, and fully automated APM. The tool offers automatic distributed tracking for full visibility as well as a continuous full-stack observability tool of all server and application components.
For analysis, visualization, and alerting via UI customizations, Instana offers application perspectives that logically group app components, services, and transaction requests together.
#23 AppNeta
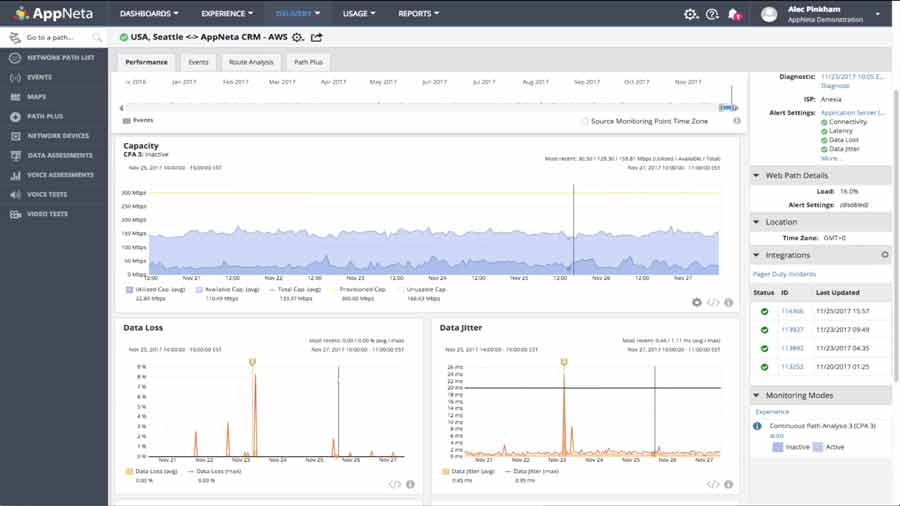
AppNeta Performance Manager is a network and application performance monitoring tool that provides visibility into business-critical networks and apps as experienced from remote locations. The platform utilizes a four-dimensional monitoring system that looks at web applications, network flows, network packets, and network pathways.
As part of its monitoring solution, AppNeta's APM technology includes 2,000 built-in applications and gives users the option to create their own custom application definitions as necessary.
#24 Epsagon
Epsagon is a SaaS platform that gives Dev and Ops teams automated data correlation, payloads, and end-to-end observability tooling in microservice settings. This reduces the amount of time spent on troubleshooting and allows issues to be resolved more quickly.
Epsagon offers automated instrumentation and tracing without coverage gaps with our small-footprint agent SDK, providing you complete visibility for containers, VMs, serverless, and more with no need for manual coding, tagging, or maintenance.
Epsagon assists businesses and teams of all sizes in reducing expenses with unlimited free monitoring and scalable pricing, as well as in boosting engineering effectiveness through decreased application downtime, quicker feature shipping, and time saved in issue identification and resolution.
#25 Prometheus
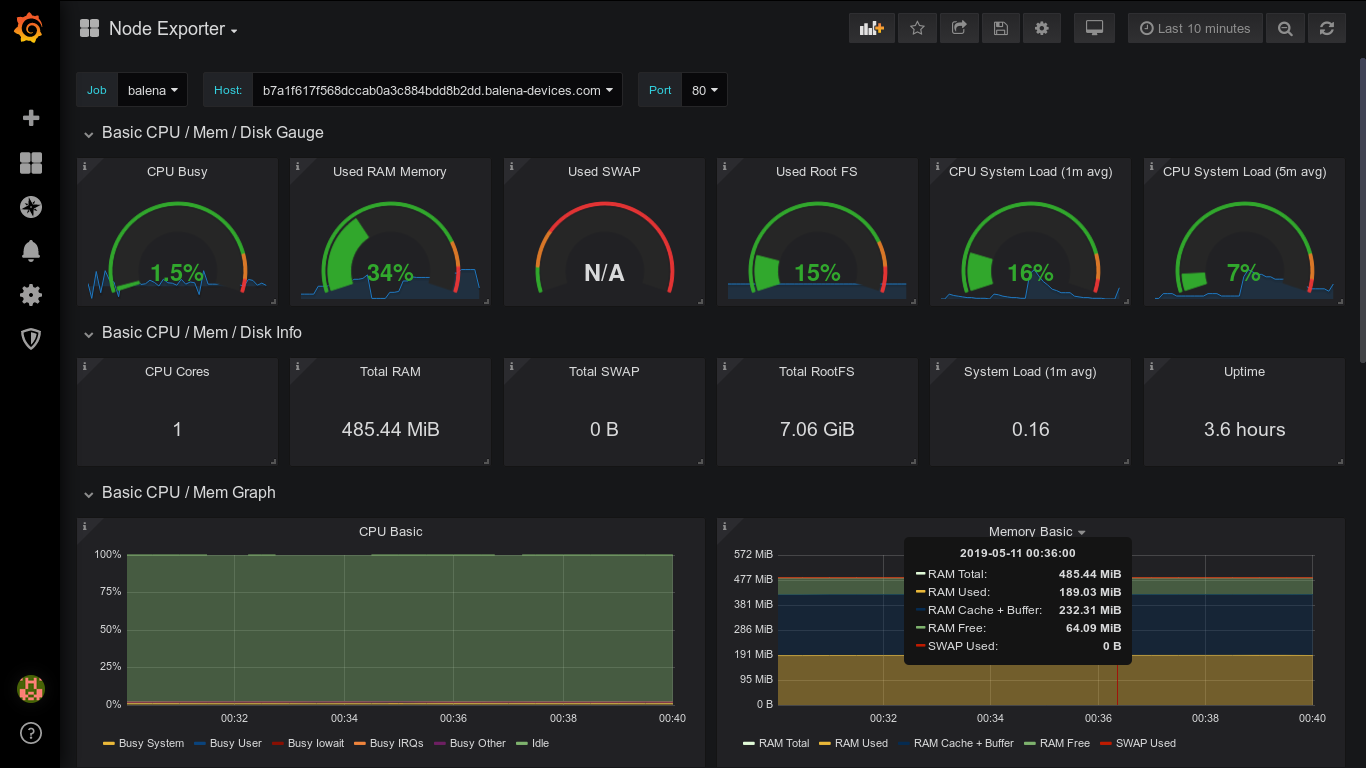
Prometheus is a well-liked open-source toolkit for system monitoring and alerting. It was created especially to monitor contemporary applications. It allows for monitoring Linux servers and Kubernetes, and it records metrics as time series data.
Additionally, we can enable short-lived jobs by using push gateway and specialized exporters like HAProxy, StatsD, Graphite, etc. Prometheus is designed to operate on a single server node and does not rely on distributed storage.
#26 Honeycomb
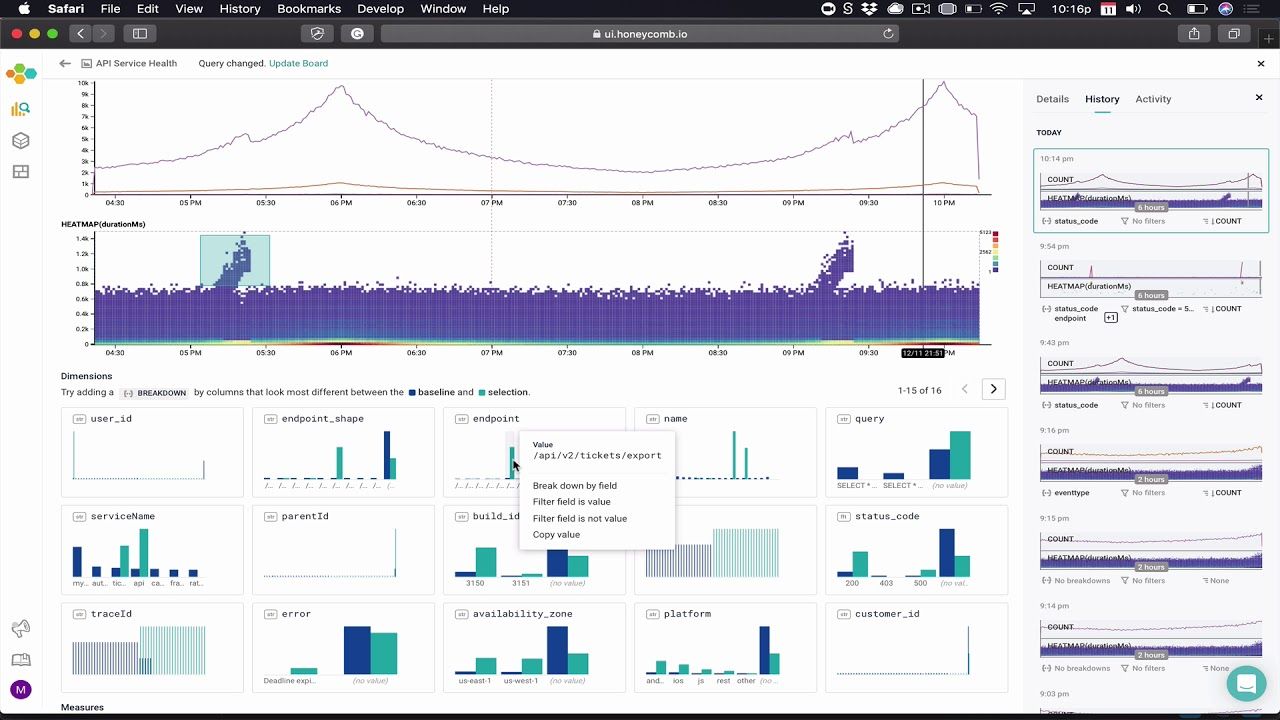
Honeycomb is an observability tool created for DevOps teams to monitor, troubleshoot, and enhance live production software. Users can see codes being issued proactively due to its user-friendly UI/UX.
It offers quick feedback loops for the dependable distribution of effective features. It establishes, evaluates, and modifies engineering priorities by Service Level Objectives (SLOs). Distributed tracing can easily be used to delve into traces, queries, or visualizations.
#27 Sematext
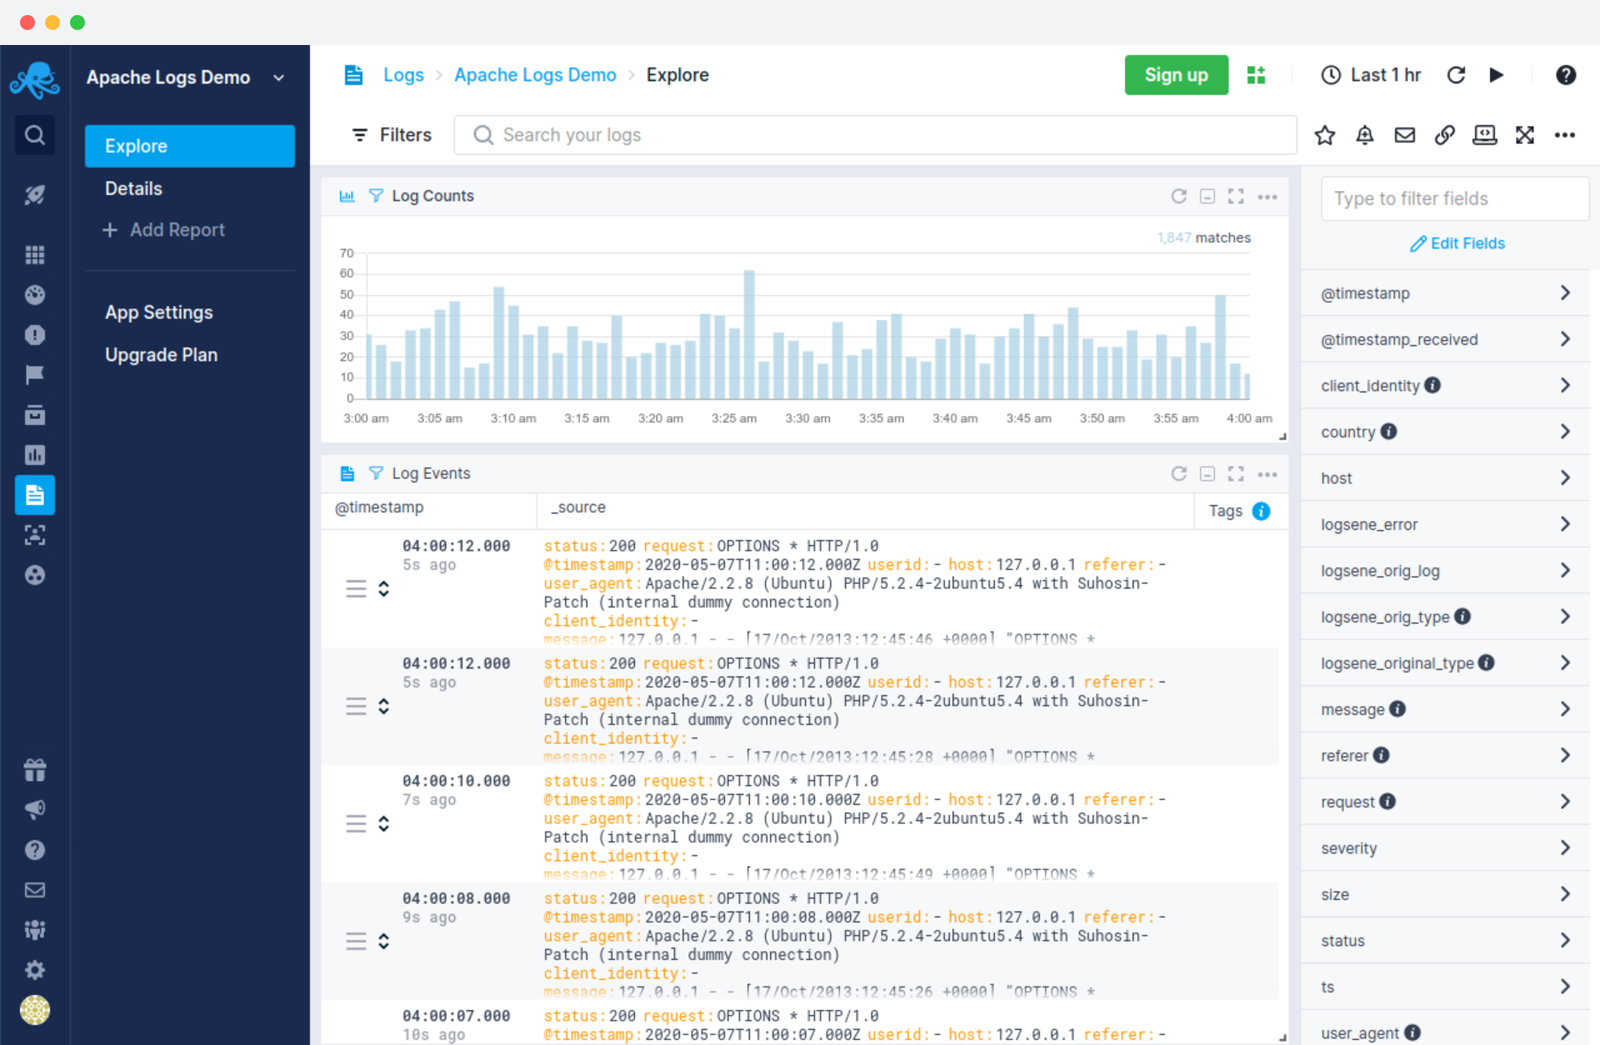
Sematext provides Site Search Analytics, Logsene Log Management & Analytics, SPM Performance Monitoring, and other search-related products. It integrates them all into a single observability tool to aid businesses in quicker problem-solving.
To investigate and notify companies, it employs pre-defined or personalized dashboards. Monitoring infrastructure, database, application, and site response times offers quicker root cause analysis. Both metrics and logs can have anomaly detection and alarms set up. You can quickly set up your account due to integrations with lightweight data shippers like Sematext, Kubernetes, and Docker.
#28 Icinga
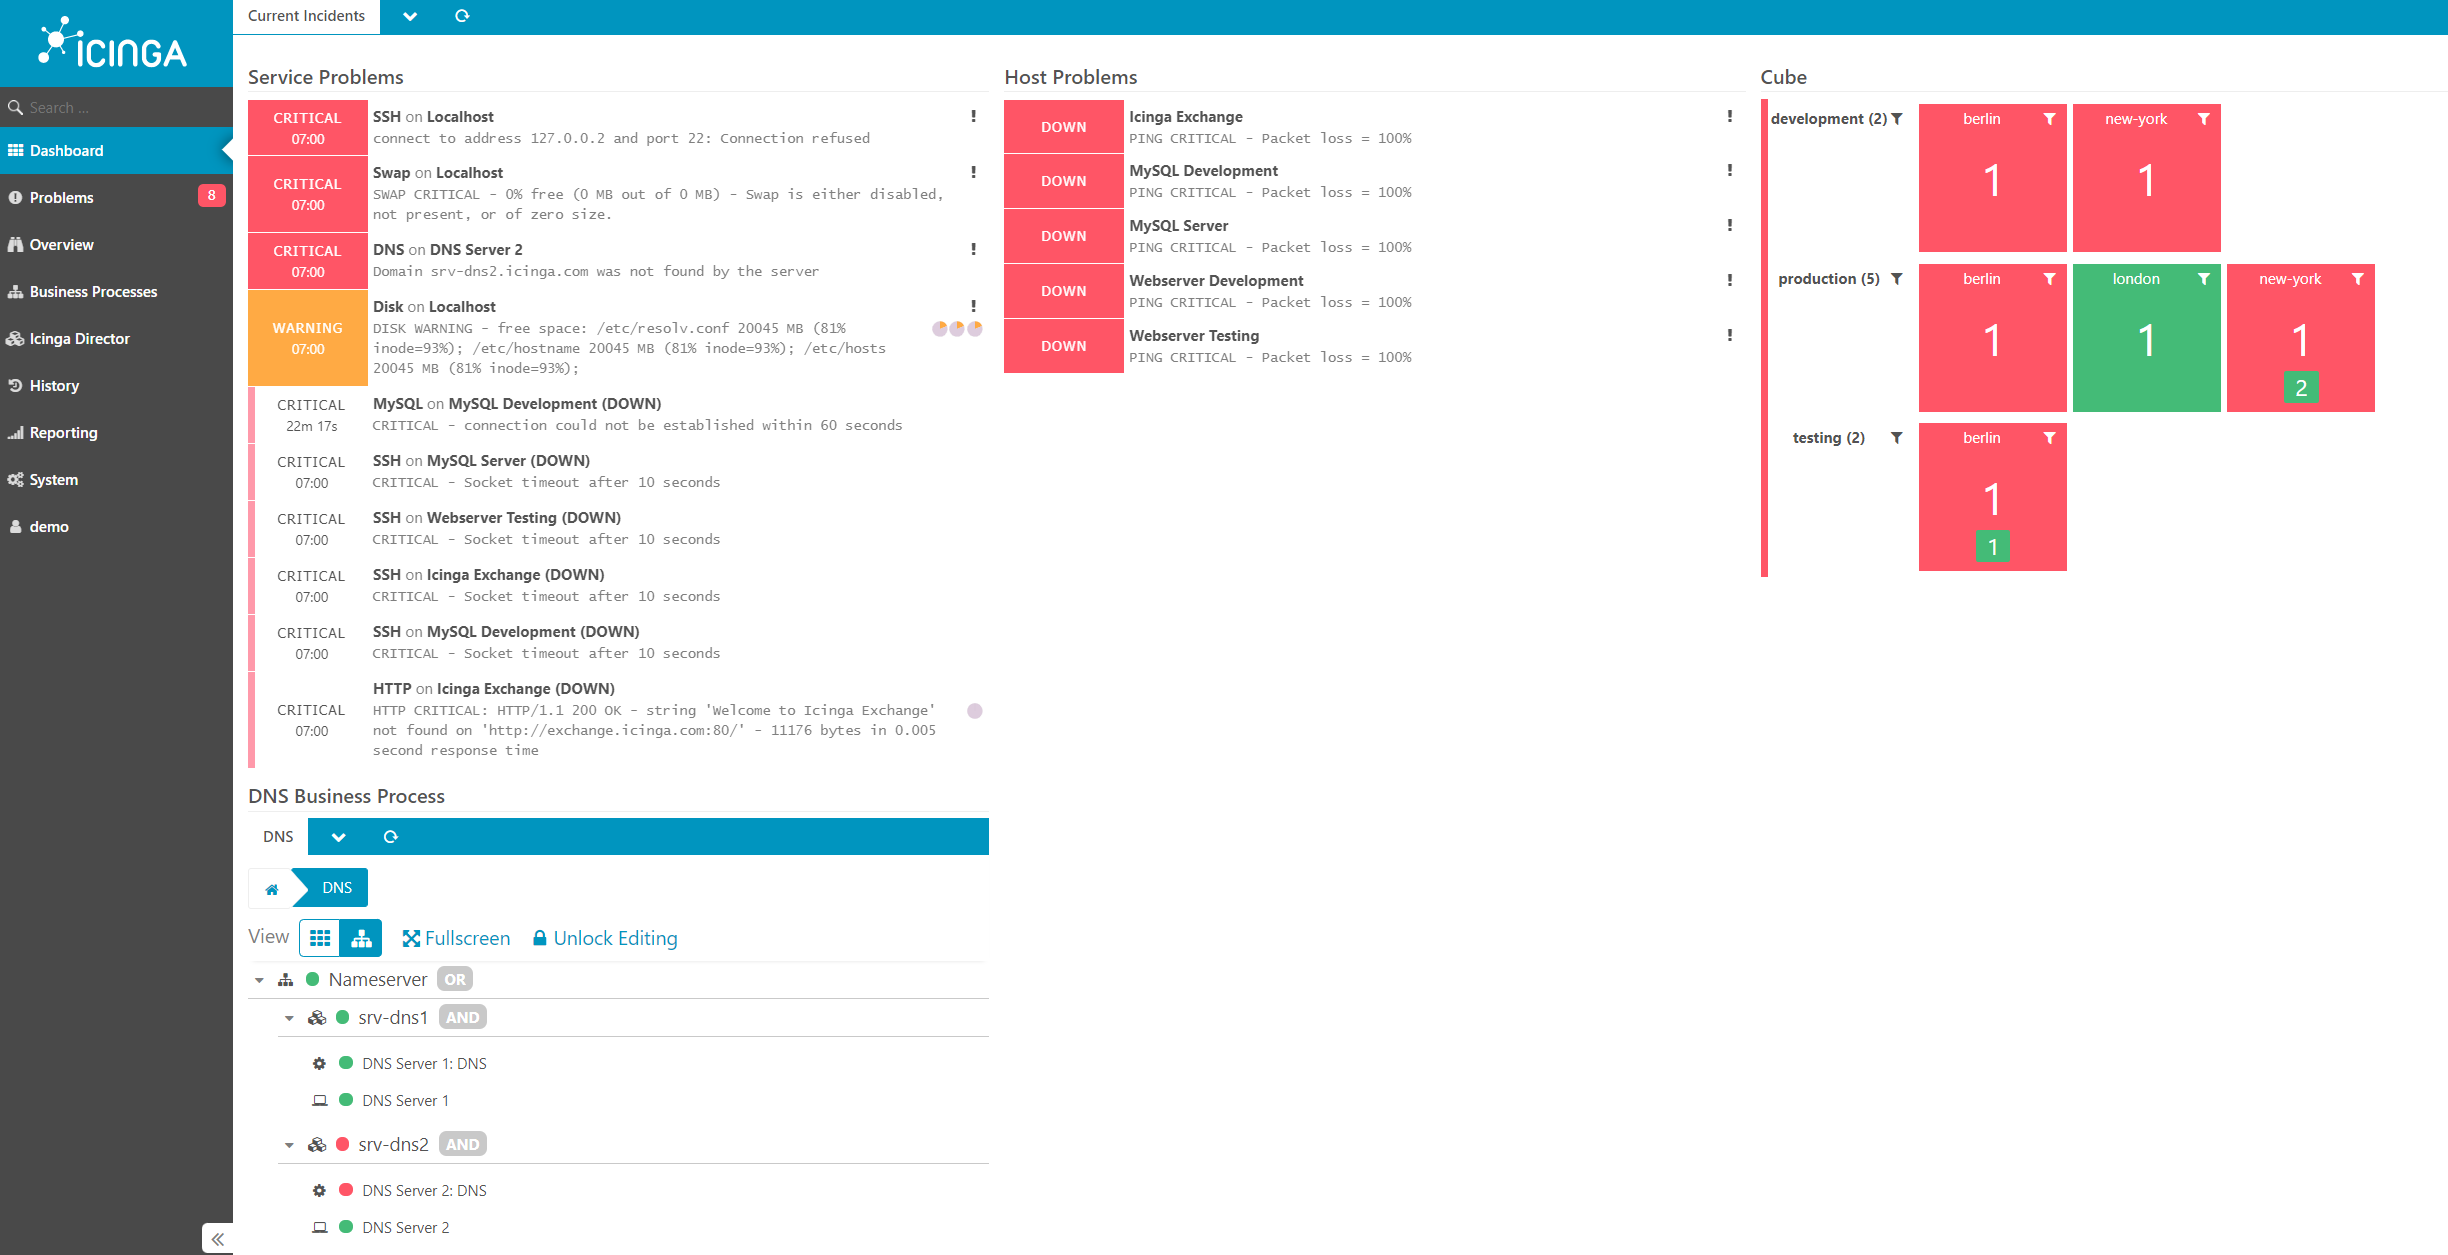
Icinga is an open-source network observability tool resource monitoring tool that checks for network resource availability, alerts users to outages, and produces useful data for performance reporting. With its quick and well-organized web interface and five Icinga status colors, issues can be quickly identified.
By grouping and filtering components, you can create unique views. Keep them in the dashboards. Icinga offers visualization options for a wide variety of use scenarios and provides detailed views, operational procedures, and certificate surveillance. Its built-in clustering mechanism provides scalability, automation, and extensive configuration options.
#29 Zabbix
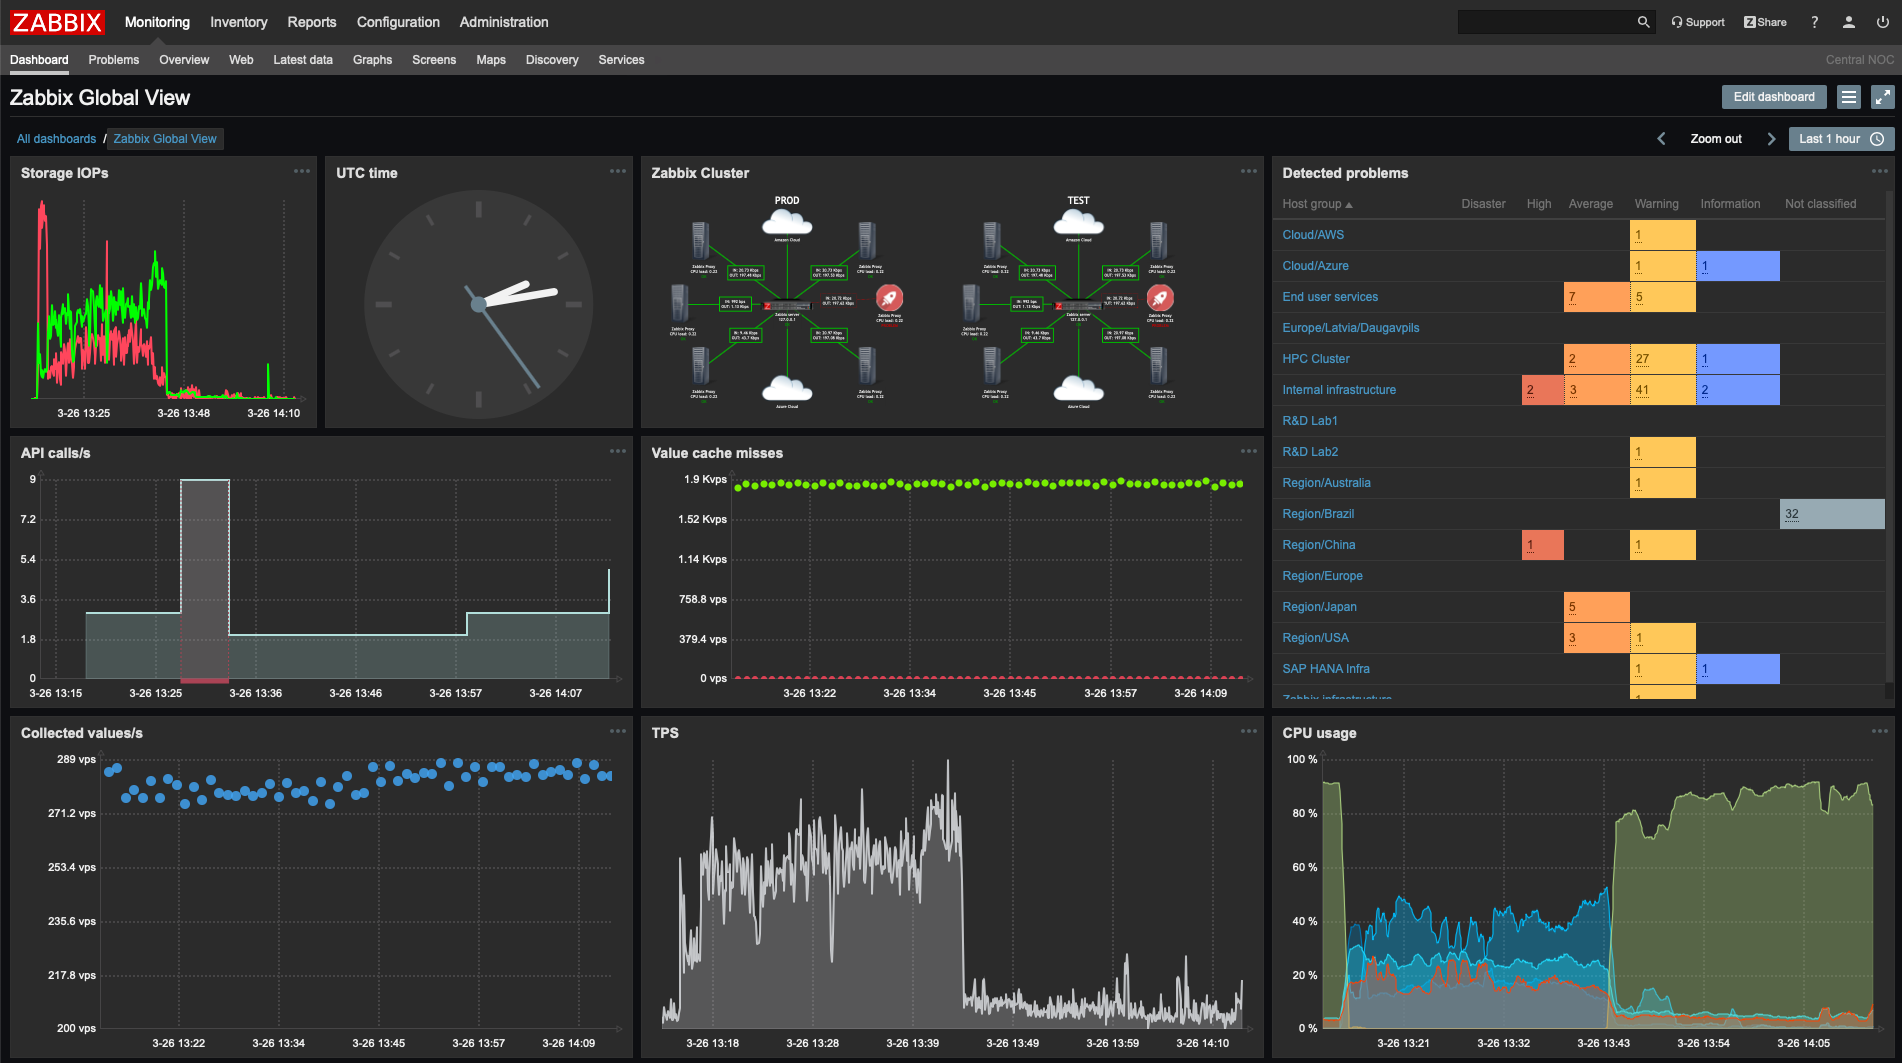
Zabbix is an open-source solution observability platform that monitors networks, servers, virtual machines, and cloud services may all be monitored using. You can use Zabbix for much more than just monitoring, and no additional fees are involved. You can also offer monitoring services to different customers in multi-tenant environments.
It collects desired data from any source at chosen intervals. It uses values from a backend database to build triggers, which are configurable problem thresholds. According to the receiver, media type, and escalation timetable, it customizes sending notifications.
#30 Checkmk
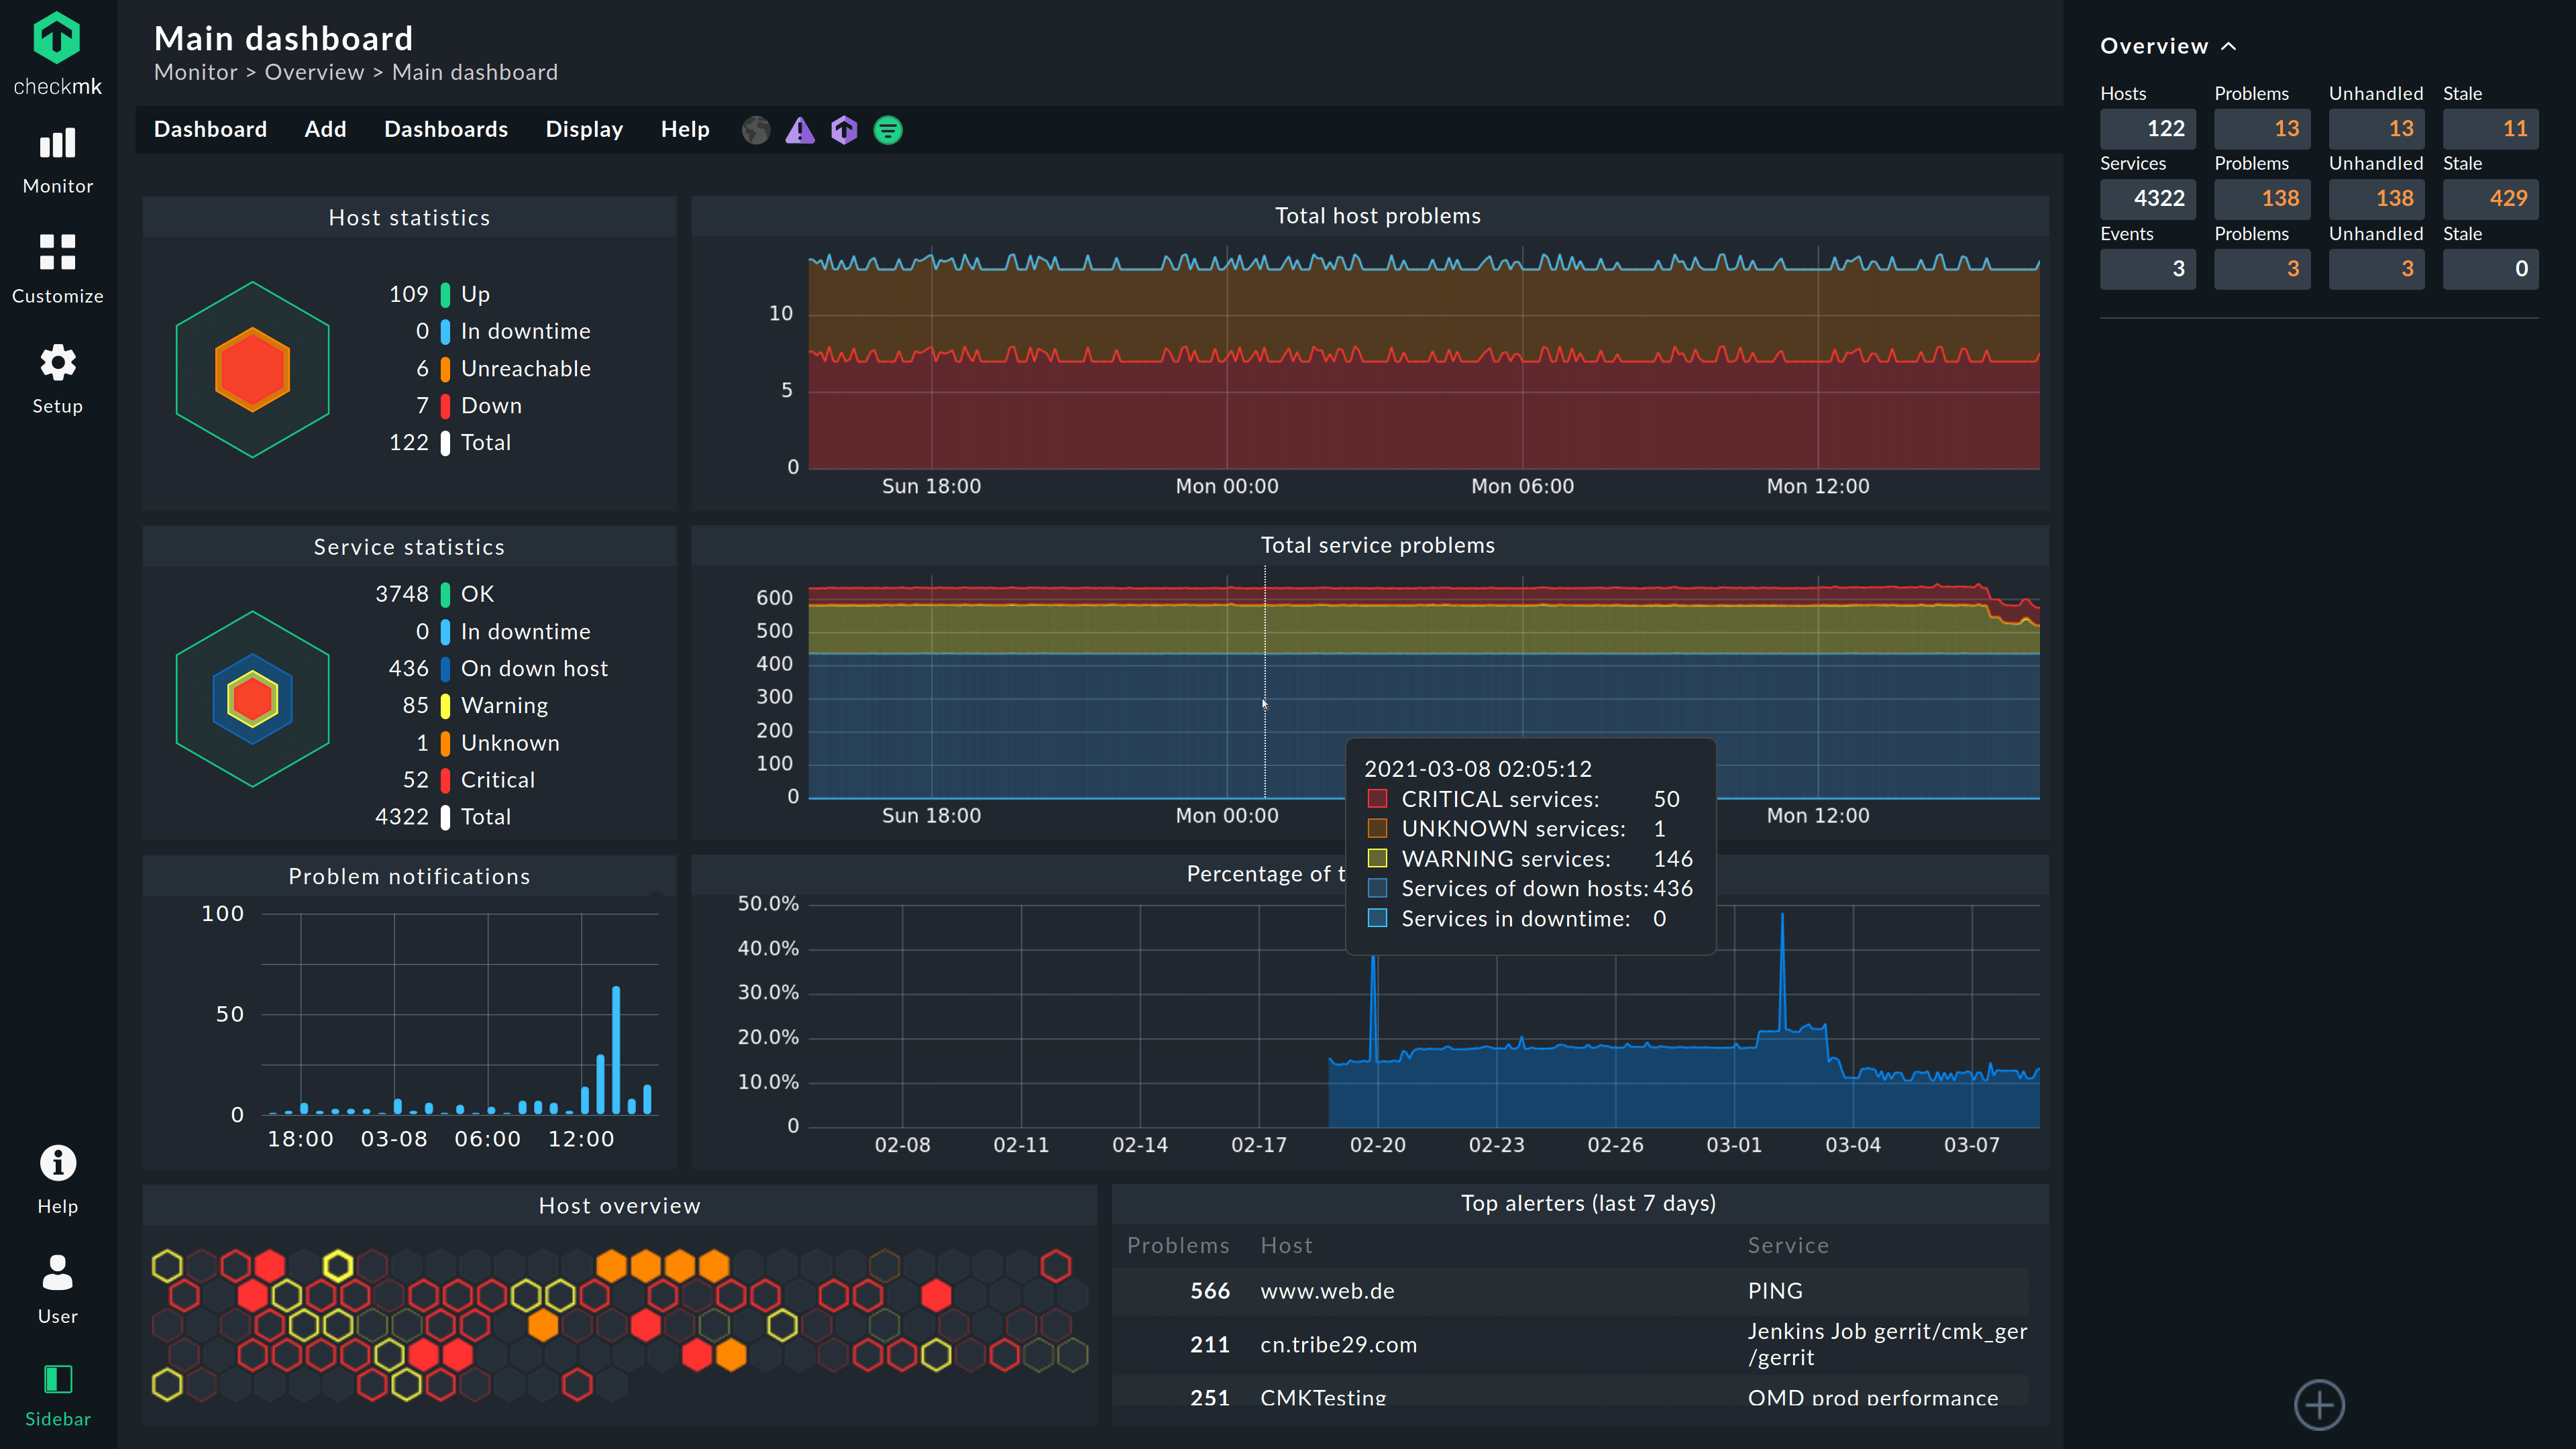
Checkmk is another open-source monitoring and observability tool with many capabilities for businesses of all sizes. It makes it simple to get started and pool monitoring data from your stack because it supports a large number of packages and plugins. It provides monitoring for both traditional IT infrastructure and IT assets built for the cloud.
This is the tool of choice if you need to monitor IoT devices or network requests. They have packages for Docker, Virtual Appliance, and all popular Linux systems.
#31 Netdata
Netdata is an open-source observability tool for gathering real-time metrics on CPU usage, disk activity, bandwidth usage, website visits, etc., and then showing them in simple-to-understand real-time charts.
The tool is made to show activity in as much detail as possible, giving the user a clear picture of what is occurring and what has just occurred in their system or application.
It automatically gathers more than 5,000 metrics, requires no configuration, dependencies, or upkeep, and includes more than 100 pre-configured alarms to find common failures, performance, and availability problems.
#32 Observium
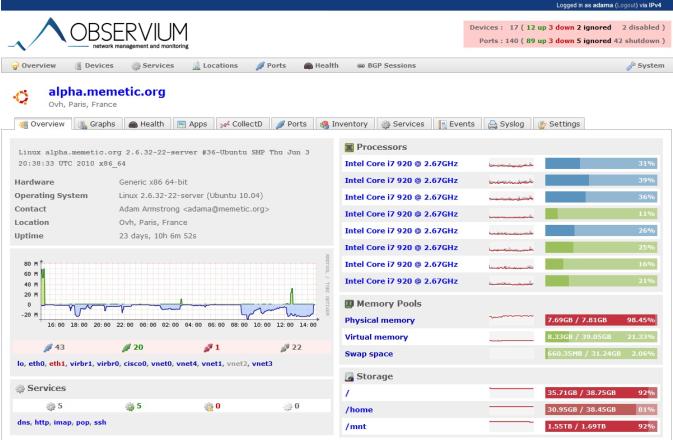
Observium is a Network Observation and Monitoring System (NOMS) that gathers data from devices using SNMP and displays it via a web interface. It is heavily reliant on the RRDtool package and is built on the PHP programming language and MySQL database. Minimum involvement, maximum automation, and maximum information accessibility are among Observium's simple basic design objectives.
#33 PRTG Network Monitor
Paessler Router Traffic Grapher is a server uptime and utilization tool, network observability tool, and bandwidth usage software package for server infrastructure by Paessler AG. Using SNMP, Packet Sniffing, and Netflow, it can track and categorize bandwidth utilization within a network. It supports both Linux and Microsoft Windows.
Finally!!!
Using the correct observability tools would directly benefit key business metrics and lessen downtime inconvenience. Many of the above tools have free plans and offer fantastic value right out of the box.
Although there is a continuing trend to add more observability tools to the stack, your decision and requirement for those tools would depend on an analysis of your current stack, issues, and technologies used. The number of providers you select will depend on your scale and budget.
We hope this article gave you knowledge of fresh tools and suggestions to help you select your tool.
Monitor Your Entire Application with Atatus
Atatus is a Full Stack Observability Platform that lets you review problems as if they happened in your application. Instead of guessing why errors happen or asking users for screenshots and log dumps, Atatus lets you replay the session to quickly understand what went wrong.
We offer Application Performance Monitoring, Real User Monitoring, Serverless Monitoring, Logs Monitoring, Synthetic Monitoring, Uptime Monitoring, and API Analytics. It works perfectly with any application, regardless of framework, and has plugins.

Atatus can benefit your business, providing comprehensive view of your application, including how it works, where performance bottlenecks exist, which users are most impacted, and which errors break your code for your frontend, backend, and infrastructure.
If you are not yet an Atatus customer, you can sign up for a 14-day free trial.
#1 Solution for Logs, Traces & Metrics
![]() APM
APM
![]() Kubernetes
Kubernetes
![]() Logs
Logs
![]() Synthetics
Synthetics
![]() RUM
RUM
![]() Serverless
Serverless
![]() Security
Security
![]() More
More

![New Relic vs Splunk - In-depth Comparison [2026]](/blog/content/images/size/w960/2024/10/Datadog-vs-sentry--19-.png)
![New Relic vs Sentry - Which Monitoring Tool to Choose? [2026]](/blog/content/images/size/w960/2024/10/VS--1-.png)