The Complete Guide to Observability Pipelines
Modern engineering teams are drowning in telemetry data.
A mid-sized Kubernetes cluster running 50 microservices can generate millions of log lines per minute. Add distributed traces, Prometheus metrics, cloud provider events, and application-level instrumentation and you're looking at terabytes of observability data every day.
The problem isn't just volume. It's what you do with it.
Traditional monitoring architectures - agent → monitoring tool → dashboard weren't built for this scale. They push everything to a central backend, store it indefinitely, and hope the query engine keeps up. The result: ballooning infrastructure costs, overloaded pipelines, alert fatigue, and engineering teams spending more time managing observability tooling than actually improving system reliability.
Observability pipelines change the equation.
Instead of forwarding raw, unfiltered telemetry to storage, you process it in transit including filtering noise, enriching context, sampling traces, routing data to the right destinations, and controlling costs before they spiral. Think of it as a data engineering layer specifically designed for telemetry.
What's in the guide?
- What Is an Observability Pipeline?
- How Observability Pipelines Work: Core Architecture
- Telemetry Types: What Flows Through an Observability Pipeline
- Observability Pipeline Capabilities
- Why Observability Pipelines Matter in Cloud-Native Environments
- Observability Cost Optimization Through Pipelines
- OpenTelemetry and Modern Observability Pipelines
- Observability Pipeline Best Practices
- Common Challenges in Observability Pipelines
- Implementation Checklist: Building Your Observability Pipeline
- How Atatus Fits Into Your Observability Pipeline
- Frequently Asked Questions
- Conclusion: Telemetry Control Is a Competitive Advantage
What Is an Observability Pipeline?
An observability pipeline is a data processing layer that sits between your telemetry sources and your storage or analytics backends. It collects raw telemetry such as logs, metrics, traces, and events which applies transformations, filters, and routing rules, and delivers processed data to one or more destinations.
In simpler terms: it's the intelligence layer between your systems generating data and your tools consuming it.
Unlike a simple log shipper or metrics forwarder, a modern observability data pipeline supports:
- Filtering low-value or redundant telemetry before storage
- Enriching data with contextual metadata (Kubernetes labels, region, environment)
- Sampling traces to reduce volume without losing signal
- Transforming log formats for downstream compatibility
- Routing telemetry to multiple backends based on rules (e.g., security logs → SIEM, debug logs → cheap object storage)
- Redacting sensitive fields for compliance
Observability Pipeline vs. Traditional Monitoring Pipeline
| Dimension | Traditional Monitoring Pipeline | Observability Pipeline |
|---|---|---|
| Data flow | Agent → Single backend | Agent → Processing layer → Multiple backends |
| Filtering | Minimal or post-storage | Pre-storage, in-flight |
| Cost control | Reactive (storage costs) | Proactive (data reduction) |
| Routing | Fixed destination | Rule-based, multi-destination |
| Enrichment | Limited | Dynamic metadata injection |
| Vendor flexibility | Often locked in | Vendor-neutral (OpenTelemetry) |
| Scalability | Vertical | Horizontal, distributed |
The difference isn't cosmetic. A traditional pipeline treats all telemetry equally. An observability pipeline makes intelligent decisions about what to keep, what to drop, and where to send it at ingestion time.
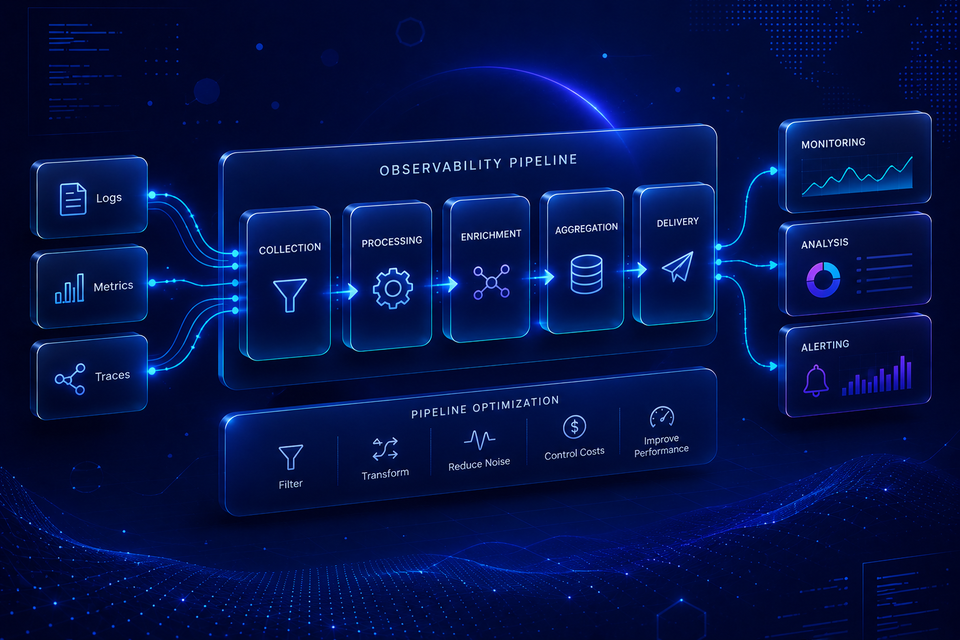
How Observability Pipelines Work: Core Architecture
A production-grade observability pipeline architecture follows a layered model. Each layer has a distinct role.
#1 Data Sources
Everything that emits telemetry:
- Application services (instrumented with OpenTelemetry SDKs)
- Kubernetes nodes, pods, and containers
- Cloud provider APIs (AWS CloudWatch, GCP Logging, Azure Monitor)
- Infrastructure agents (system metrics, network telemetry)
- Third-party SaaS tools and databases
#2 Collection Layer
The collection layer receives raw telemetry from sources. Common tools here include the OpenTelemetry Collector, Fluent Bit, and cloud-native agents. This layer runs close to the source, typically as a DaemonSet in Kubernetes or a sidecar container to minimize data loss and reduce network overhead.
#3 Processing Layer
This is where the pipeline earns its value. The processing layer applies:
- Filtering: Drop debug logs in production, remove health-check endpoints from traces
- Sampling: Keep 100% of error traces, 1% of successful ones
- Transformation: Parse unstructured log fields, rename metrics for schema consistency
- Aggregation: Pre-aggregate high-cardinality metrics to reduce time series count
#4 Enrichment Layer
Raw telemetry often lacks context. The enrichment layer injects metadata that makes debugging and analysis faster:
- Kubernetes pod labels, namespace, and node name
- Deployment environment (production, staging, dev)
- Service version, team ownership, SLA tier
- Geographic region or availability zone
This turns a generic error log into a precisely attributed event: which service, which version, which environment, which team owns it.
#5 Routing Layer
The routing layer applies business rules to send processed telemetry to the right destinations:
- High-severity errors → Atatus or primary observability platform
- Security-relevant events → SIEM
- Debug and verbose logs → low-cost object storage (S3, GCS)
- Audit logs → compliance-grade cold storage
- Real-time metrics → Prometheus or streaming pipeline
#6 Storage Destinations
Where telemetry lands for querying and long-term retention. This includes hot storage (recent, fast-query), warm storage (medium-term), and cold storage (archival compliance). A good observability pipeline architecture sends data to the right tier automatically.
#7 Analytics Layer
The final layer - dashboards, alerting, trace analysis, anomaly detection. Atatus sit here, consuming enriched, pre-processed telemetry rather than raw, noisy data.
Telemetry Types: What Flows Through an Observability Pipeline
- Logs: Structured or unstructured text records of discrete events. Logs are the highest-volume telemetry type and the most expensive to store. Observability pipelines address this with log filtering, structured parsing, and tiered routing.
- Metrics: Numeric measurements over time such as CPU usage, request latency, error rates. Pipelines manage metric cardinality by pre-aggregating or dropping low-value dimensions before storage.
- Traces: Distributed traces capture the end-to-end journey of a request across services. Full trace collection is expensive; head-based and tail-based sampling strategies in the pipeline keep costs manageable while preserving signal.
- Events: Discrete business or system events such as deployments, config changes, autoscaling events. Pipelines route events to the relevant consumers: change management systems, alerting rules, audit trails.
- Infrastructure Telemetry: Node-level metrics, network flows, disk I/O, and container stats. Often high-frequency; pipelines aggregate these before storage.
Observability Pipeline Capabilities
- Telemetry Aggregation: Instead of storing every raw data point, aggregate in transit. Pre-compute percentiles, rates, and rollups before sending to your metrics backend. This dramatically reduces time series cardinality, one of the primary drivers of cost in metric-heavy environments.
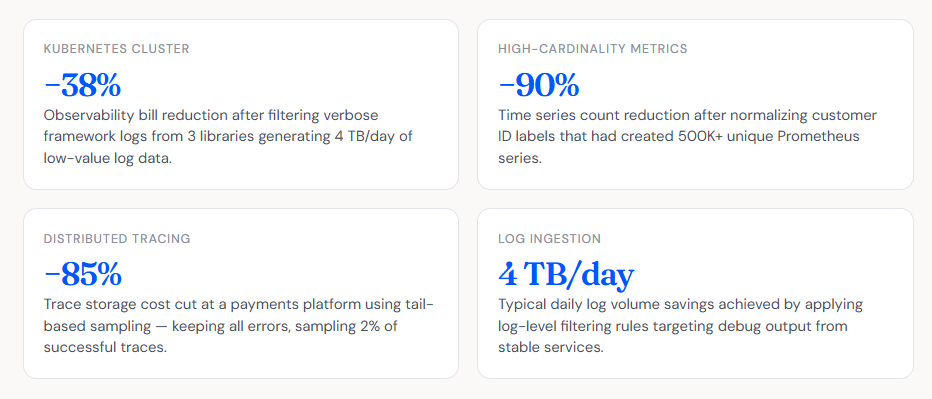
- Filtering: Drop what you don't need. Health-check endpoints, liveness probes, synthetic monitoring traffic, and debug-level logs from stable services generate enormous volume but provide little operational value. Filtering these at the pipeline level reduces storage costs by 30-60% in many environments.
- Sampling: For distributed traces, sampling is essential. Head-based sampling makes decisions at the start of a request. Tail-based sampling, enabled by pipeline tools like the OpenTelemetry Collector evaluates the full trace before deciding whether to keep it. This lets you keep 100% of error traces and drop 99% of successful ones, preserving signal without the cost.
- Enrichment: Attach Kubernetes metadata, business context, or SLA tags to telemetry at ingestion time. Downstream consumers get pre-enriched data instead of running expensive join operations at query time.
- Transformation: Convert log formats, rename fields, mask PII, parse JSON from string fields, normalize timestamp formats. Transformation at the pipeline layer means your storage and analytics tools receive clean, consistent data.
- Redaction: Automatically remove or mask sensitive fields such as credit card numbers, API keys, user PII before telemetry leaves your infrastructure. Critical for GDPR, HIPAA, SOC 2, and PCI-DSS compliance.
- Compression: Reduce data volume before transmission. Gzip or Zstandard compression in the pipeline reduces egress costs significantly in multi-region or multi-cloud environments.
- Intelligent Routing: Dynamic routing rules send telemetry to different backends based on content, severity, service ownership, or compliance requirements without changing application code.
Why Observability Pipelines Matter in Cloud-Native Environments?
Cloud-native systems including Kubernetes, microservices, serverless, fundamentally change the telemetry problem. In a monolithic application, you might instrument 10 services. In a modern microservices architecture, you might have 200. Each generates logs, metrics, and traces. Each pod restart produces new telemetry. Each autoscaling event multiplies the data volume.
Kubernetes Observability Pipelines
Kubernetes generates telemetry from multiple planes simultaneously: the control plane, worker nodes, pods, containers, and the applications running inside them. Without a pipeline, this data floods your observability backend with noise, kube-system namespace logs, readiness probe traffic, scheduler events that consumes storage and degrades query performance.
A Kubernetes observability pipeline runs as a DaemonSet, collecting telemetry from every node, applying namespace-level filtering rules, injecting pod and deployment metadata, and routing workload telemetry to the appropriate backends.
Microservices and Distributed Tracing Pipelines
Microservices produce distributed traces that can span dozens of services. Without pipeline-level sampling, storing every trace becomes economically unsustainable at scale. Tail-based sampling in the pipeline evaluates completed traces, keeping the ones that reveal errors, latency anomalies, or SLA violations and drops the routine ones.
Hybrid and Multi-Cloud Telemetry Management
Organizations running workloads across AWS, GCP, Azure, and on-premises environments face a federated telemetry problem. A centralized observability pipeline normalizes telemetry from all sources into a unified schema and routes it to a single observability platform like Atatus, giving you a single pane of glass regardless of where workloads run.
💡Control Costs Without Losing Visibility - Atatus unifies logs, metrics, and traces from multi-cloud environments into a single, scalable observability platform. No data silos. No context switching.
Observability Cost Optimization Through Pipelines
Telemetry cost is one of the fastest-growing infrastructure line items for scaling engineering teams. Observability pipelines are the primary lever for controlling it.
Reducing Telemetry Noise
Not all telemetry carries equal value. Routine health checks, successful cache hits, and verbose framework logs consume storage without contributing to incident detection or debugging. Pipeline-level filtering removes these before they reach paid storage, reducing ingestion volume by 40-70% in many production environments.
Dropping Low-Value Logs
Define log-level policies at the pipeline: in production, drop DEBUG and TRACE logs from stable services. Route INFO to warm storage. Send ERROR and CRITICAL to hot storage with fast query access. This tiered approach dramatically reduces per-GB storage costs.
Managing Cardinality Explosion
High-cardinality labels such as user IDs, session tokens, request IDs, embedded in metrics create an exponential growth in time series. Pipelines can strip or normalize high-cardinality dimensions before metrics reach storage, preventing cardinality explosions that can make metric backends unusable and extremely expensive.
Real-World Cost Reduction Examples
OpenTelemetry and Modern Observability Pipelines
OpenTelemetry has become the definitive standard for vendor-neutral telemetry instrumentation and collection. It removes the vendor lock-in that plagued previous generations of monitoring tools.
The OpenTelemetry Collector
The OpenTelemetry Collector is the central component of most modern observability pipeline architectures. It operates in three modes:
- Agent mode: Runs alongside your application (sidecar or DaemonSet) to collect telemetry locally
- Gateway mode: Runs as a centralized pipeline processor for aggregation, filtering, and routing
- Standalone mode: For simple single-destination setups
The Collector uses a receivers → processors → exporters pipeline model:
- Receivers accept telemetry in various formats (OTLP, Prometheus, Jaeger, Fluent Forward, etc.)
- Processors apply filtering, sampling, enrichment, and transformation
- Exporters send processed data to backends (Atatus, Elasticsearch, Prometheus, S3, etc.)
This architecture makes the OpenTelemetry pipeline composable and extensible without modifying application code.
Fluent Bit in the Observability Pipeline
Fluent Bit is a lightweight, high-performance log processor widely used in Kubernetes observability pipelines. It runs as a DaemonSet, collects container logs from every node, parses and enriches them with Kubernetes metadata, and forwards them to one or more backends. Its low memory footprint (~450 KB) makes it ideal for edge and constrained environments.
Kafka for High-Throughput Telemetry Pipelines
For organizations processing millions of events per second, Apache Kafka serves as a high-throughput telemetry buffer between collection agents and downstream processors. It decouples ingestion from processing, provides durability during backend outages, and enables stream processing of telemetry data at scale.
✅Vendor-Neutral with Atatus - Atatus supports OpenTelemetry natively - accepting OTLP for logs, metrics, and traces. Migrating from any OTel-compatible setup requires zero application code changes.
Observability Pipeline Best Practices
- Start With a Clear Telemetry Inventory. Before building your pipeline, catalog what you're generating: which services, which telemetry types, estimated volume per source. You can't filter what you haven't measured.
- Apply Filtering as Early as Possible. The closer to the source you filter, the less data travels across your network. Implement filtering at the agent level (Fluent Bit, OTel Agent) rather than waiting for a centralized gateway.
- Use Tail-Based Sampling for Traces. Head-based sampling is simpler but blindly drops traces before you know if they're interesting. Tail-based sampling, evaluating the complete trace keeps anomalies and errors while aggressively dropping routine traffic.
- Enrich Once, Use Everywhere. Inject Kubernetes metadata, environment tags, and service ownership information once at the pipeline layer. Downstream tools don't need to re-derive context from raw log fields.
- Design for Multi-Destination Routing. Assume you'll need to send telemetry to multiple backends. Build routing rules from day one rather than retrofitting them later.
- Monitor Your Pipeline Health. Your observability pipeline is itself critical infrastructure. Monitor pipeline throughput, processing latency, drop rates, and export errors.
- Implement Backpressure Handling. Use queuing, backpressure mechanisms, and retry logic to prevent data loss when downstream backends are slow or unavailable.
- Apply Data Governance Policies. Define retention policies per telemetry type. Error logs → 30 days hot, audit logs → 7 years cold, debug logs → 7 days then delete.
Reduce Telemetry Noise Before It Impacts Performance
Atatus helps engineering teams filter, route, and control telemetry at scale without rebuilding their entire observability stack.
Start Free Trial →Common Challenges in Observability Pipelines
- Telemetry Overload: More services → more telemetry. Without deliberate filtering and sampling, data volume scales faster than your budget. The answer is proactive pipeline controls, not reactive storage capacity increases.
- Alert Fatigue: High-volume, unfiltered telemetry creates noisy alert conditions. Engineers tune out alerts when too many are false positives. Pipelines that normalize, deduplicate, and intelligently route telemetry reduce alert noise at the source.
- Pipeline Bottlenecks: A misconfigured or under-resourced pipeline can become the single point of failure in your observability architecture. Over-complex processor chains, insufficient buffer capacity, and synchronous export calls are common culprits.
- Data Duplication: Multiple collection agents targeting the same source create duplicate telemetry. This wastes storage and skews metrics. Establish clear ownership of collection per source and use deduplication processors where overlap is unavoidable.
- Observability Silos: Teams using different tools, some on ELK, some on Datadog, some on Prometheus create fragmented visibility. A centralized observability pipeline feeds a unified platform like Atatus, breaking down silos without forcing tool standardization.
- Vendor Lock-In: Proprietary agents and collection formats create switching costs. OpenTelemetry-based pipelines keep your options open. Adopt vendor-neutral instrumentation from the start.
- Compliance and Security Risks: Sensitive data in telemetry such as PII, credentials, payment card data, creates compliance liability if not handled correctly. Redaction processors in the pipeline ensure sensitive fields never reach observability backends or log archives.
⚠️Don't Skip Redaction - GDPR, HIPAA, SOC 2, and PCI-DSS all require that sensitive personal and financial data be handled appropriately. PII in telemetry is a compliance risk that redaction processors prevent before data leaves your infrastructure.
Implementation Checklist: Building Your Observability Pipeline
Phase #1 - Inventory & Planning
- Catalog all telemetry sources and estimated volumes
- Identify high-cardinality metric labels
- Map current data flows and destinations
- Define retention policies per telemetry type
- Identify compliance requirements (PII, audit, data residency)
Phase #2 - Collection Layer
- Deploy OpenTelemetry Collector agents (DaemonSet for Kubernetes)
- Configure Fluent Bit for log collection
- Validate telemetry is reaching collection agents
Phase #3 - Processing & Enrichment
- Implement log-level filtering rules
- Configure tail-based sampling for traces
- Add Kubernetes metadata enrichment
- Set up PII redaction processors
- Normalize metric label schemas
Phase #4 - Routing & Storage
- Define routing rules per telemetry type and severity
- Configure multi-destination exports
- Set up tiered storage (hot / warm / cold)
- Validate data lands correctly at each destination
Phase #5 - Operations
- Instrument the pipeline itself (throughput, drop rate, latency)
- Set up alerts on pipeline health metrics
- Establish runbooks for pipeline failures
- Review and tune filtering rules quarterly
How Atatus Fits Into Your Observability Pipeline?
Atatus is a unified observability platform purpose-built for modern infrastructure. It accepts telemetry from OpenTelemetry Collector, Fluent Bit, Prometheus, and direct SDK integrations, making it a natural destination in any observability data pipeline.
With Atatus, engineering teams get:
- Unified logs, metrics, and traces in a single platform - No context switching between tools
- Native OpenTelemetry support - connect your existing OTel pipeline without vendor-specific agents
- Real-time telemetry processing - apply filters, alerts, and anomaly detection on ingested data
- Scalable ingestion - designed to handle the telemetry volumes generated by Kubernetes and microservices environments
- Cost-conscious architecture - Atatus helps you control ingestion costs without sacrificing visibility
Build Scalable Observability Pipelines for Modern Infrastructure
Atatus gives you the unified telemetry management layer your team needs to ship faster, debug smarter, and scale confidently.
Start Free with Atatus →Frequently Asked Questions
What is an observability pipeline?
An observability pipeline is a data processing layer that collects telemetry data (logs, metrics, traces) from your systems, applies transformations and routing logic in transit, and delivers processed data to one or more storage or analytics backends. It sits between your telemetry sources and your observability tools, acting as an intelligent control plane for your telemetry data.
What is the difference between telemetry and observability?
Telemetry is the raw data emitted by your systems such as log lines, metric values, trace spans. Observability is the ability to understand the internal state of your system from that external telemetry. An observability pipeline makes telemetry useful by processing, enriching, and routing it so that observability tools can extract actionable insights.
Why are observability pipelines important?
Modern cloud-native systems generate telemetry volumes that traditional monitoring architectures can't handle cost-effectively. Observability pipelines reduce data volume before storage, route telemetry to the right backends, enrich data with context, and give engineering teams control over costs and compliance without changing application code.
How does OpenTelemetry fit into observability pipelines?
OpenTelemetry provides the vendor-neutral instrumentation standard and the OpenTelemetry Collector as the primary pipeline component. Applications instrumented with OpenTelemetry SDKs emit telemetry in the OTLP format, which the Collector receives, processes, and exports to any compatible backend including Atatus. This eliminates vendor lock-in at the instrumentation layer.
How do observability pipelines reduce costs?
Pipelines reduce costs through filtering (dropping low-value logs before storage), sampling (keeping only statistically representative traces), aggregation (pre-computing metrics to reduce cardinality), compression (reducing data transfer costs), and tiered routing (sending infrequently accessed data to cheap cold storage). Organizations typically see 40–80% reductions in observability spend after implementing pipeline-level controls.
Conclusion: Telemetry Control Is a Competitive Advantage
Observability pipelines aren't just a cost-saving measure, they're a strategic infrastructure decision.
Engineering teams that build intelligent telemetry pipelines gain something their peers without them don't have: control. Control over what data is stored, where it goes, how much it costs, and how quickly it surfaces actionable signal during incidents.
As systems grow more complex such ad more services, more clouds, more data where the teams that win are the ones that treat their telemetry as a managed resource, not an uncontrolled byproduct.
A well-designed observability pipeline architecture, grounded in OpenTelemetry, built with filtering and sampling from day one, and connected to a unified platform like Atatus, is how modern engineering teams build observability that scales without breaking the budget.
Unify Logs, Metrics, and Traces Across Distributed Systems
Start building a scalable observability pipeline with Atatus today. No vendor lock-in. Full OpenTelemetry support. One unified platform.
Get Started Free →#1 Solution for Logs, Traces & Metrics
![]() APM
APM
![]() Kubernetes
Kubernetes
![]() Logs
Logs
![]() Synthetics
Synthetics
![]() RUM
RUM
![]() Serverless
Serverless
![]() Security
Security
![]() More
More

![New Relic vs Splunk - In-depth Comparison [2026]](/blog/content/images/size/w960/2024/10/Datadog-vs-sentry--19-.png)
![New Relic vs Sentry - Which Monitoring Tool to Choose? [2026]](/blog/content/images/size/w960/2024/10/VS--1-.png)