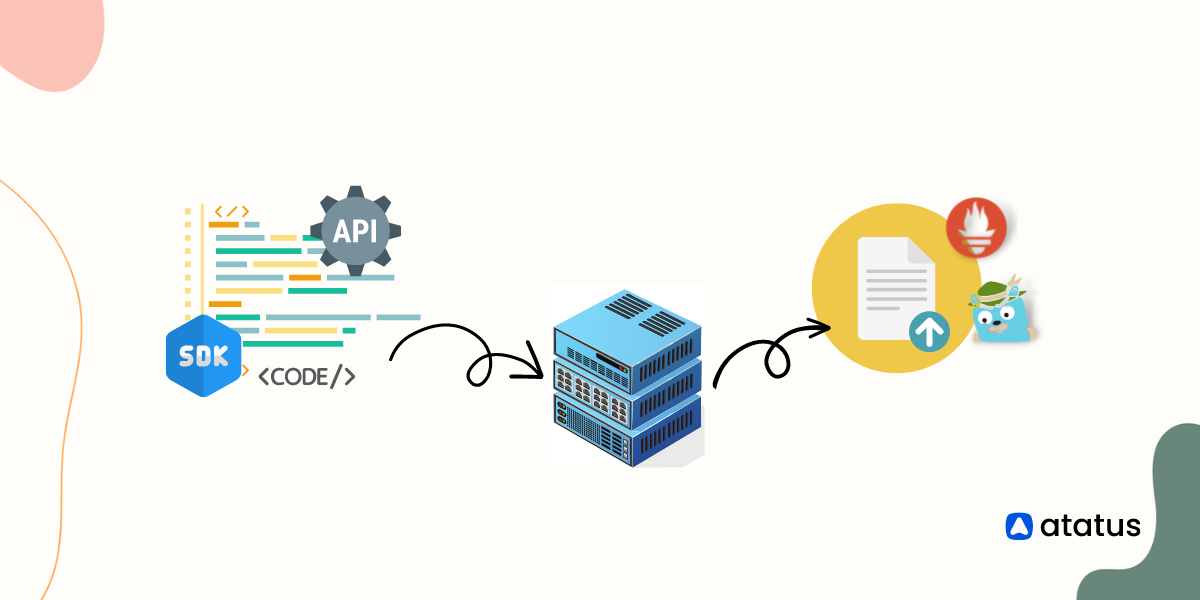
Compare OpenTelemetry and Fluent Bit, understand their strengths, and learn how to use them together for efficient log and metric collection in observability.
Compare OpenTelemetry vs APM tools to understand data collection, tracing, and performance monitoring. Choose the best solution for observability needs.
OpenTelemetry is a vendor-neutral platform for creating and collecting telemetry data, including logs, metrics, and traces. Jaeger targets distributed tracing in microservice.
Explore the journey of observability tools and standards, including StatsD, Prometheus, OpenTelemetry, and OpenMetrics. Learn how leading platforms like New Relic, Datadog, Atatus, and CloudWatch have evolved to meet modern monitoring demands.
Detect all performance inhibitors, including Pod failures, and excess CPU usage, bogging down your Kubernetes Architecture. Learn how to monitor Kubernetes with Opentelemetry.
OpenTelemetry and OpenTracing are open-source projects to enhance observability in distributed systems, but they serve distinct purposes. Take a look at their key differences and how to migrate from OpenTracing to OpenTelemetry.
In monitoring applications, both OpenTelemetry and DataDog are used. OpenTelemetry is a sort of tool, API, and SDKs for collecting and generating data, DataDog is cloud-scale monitoring.
With OpenTelemetry, you can collect and process standard data from disparate sources to gain insights into your system performance. Check out our guide to learn more!
Monitor your entire software stack
Gain end-to-end visibility of every business transaction and see how each layer of your software stack affects your customer experience.

![Comparing OpenTelemetry and Jaeger [2025 Guide]](/blog/content/images/size/w960/2024/02/opentelemetry-vs-jaeger-1.png)