Comparing OpenTelemetry and Jaeger [2025 Guide]
![Comparing OpenTelemetry and Jaeger [2025 Guide]](/blog/content/images/size/w960/2024/02/opentelemetry-vs-jaeger-1.png)
Jaeger and OpenTelemetry are essential technologies that greatly improve the observability of software applications. OpenTelemetry is a vendor-neutral platform that makes it easier to create and collect telemetry data, including logs, traces, and metrics.
Its extensive backend integration adaptabilities allow it to fit into a wide range of infrastructures. However, Jaeger is an expert in distributed tracing within microservice environments.
Even though Jaeger formerly had its own SDKs for OpenTracing API-based application instrumentation. With the combined powers of OpenTelemetry and Jaeger, developers and executors may optimize application reliability and performance while gaining a complete understanding of system behavior and performance.
Come on, let’s gain the key features and differences of OpenTelemetry and Jaeger.
- What is OpenTelemetry?
- What is Jaeger?
- Comparing OpenTelemetry and Jaeger
- Pros of OpenTelemetry and Jaeger
- Cons of OpenTelemetry and Jaeger
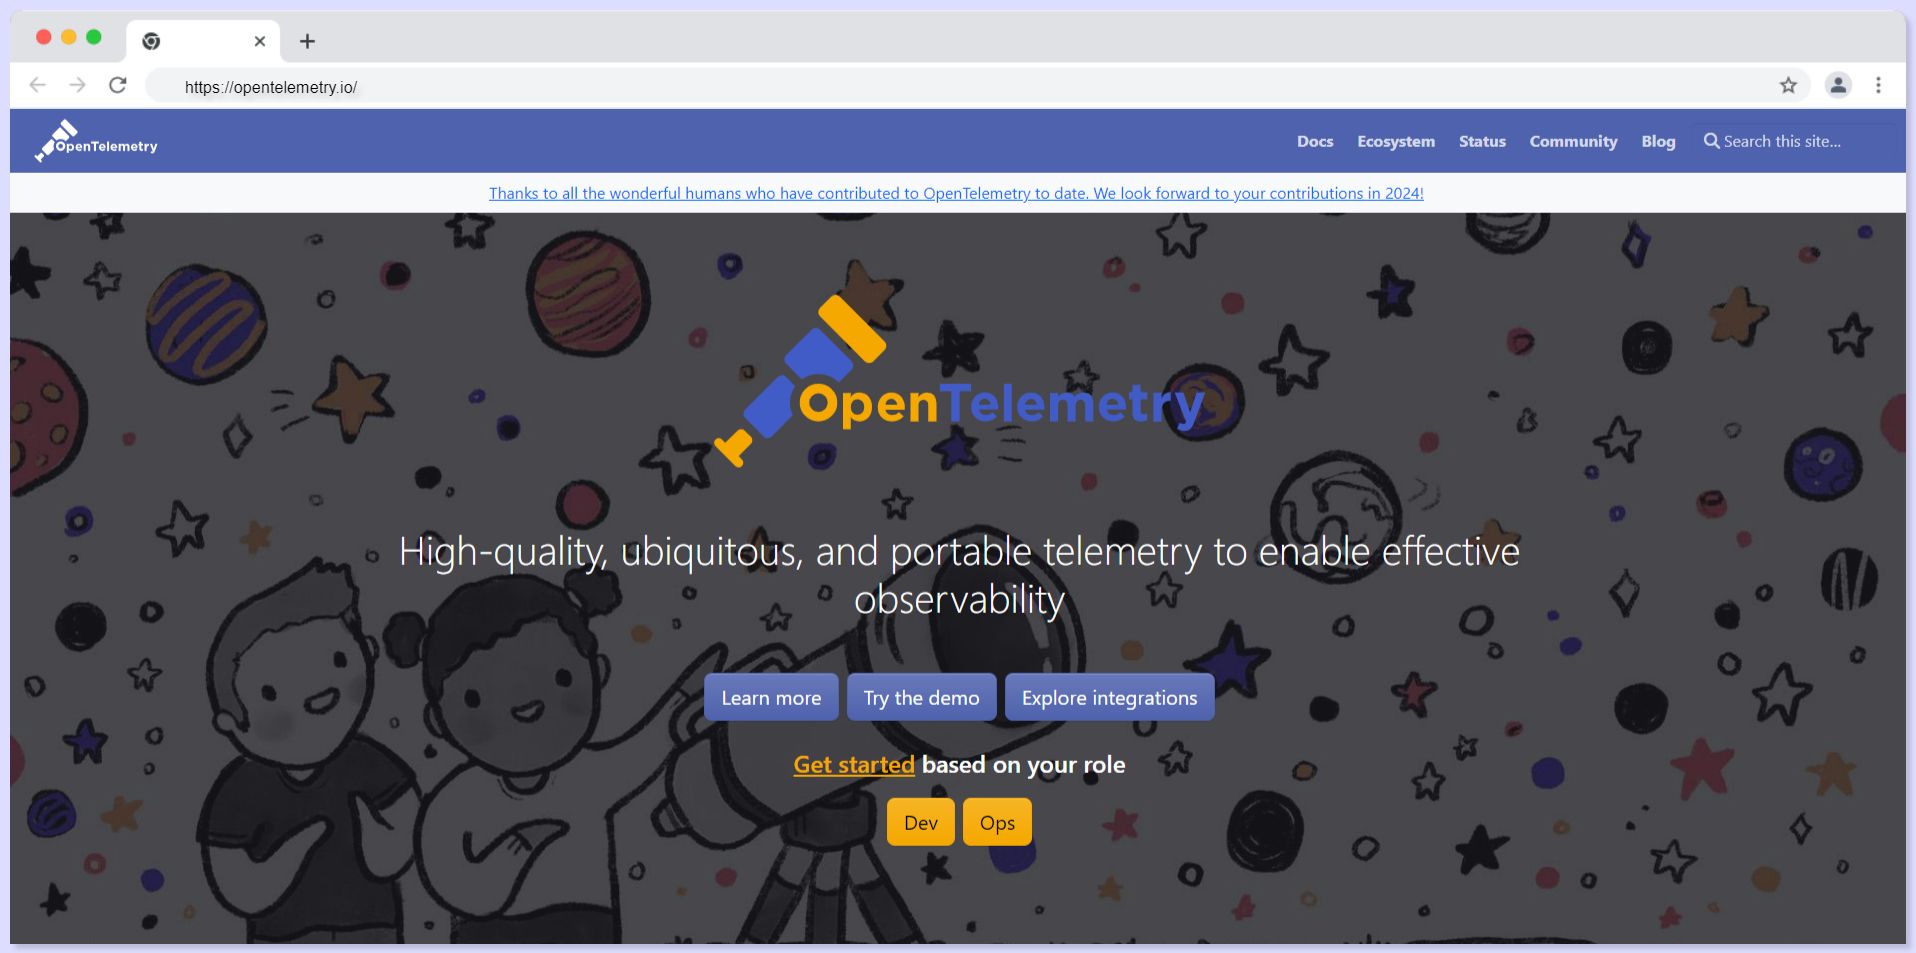
What is OpenTelemetry?
OpenTelemetry is an open-source framework that aims to standardize and simplify systems monitoring and troubleshooting. It provides a standardized set of APIs, SDKs, and exporters for effortless instrumentation across various programming languages and frameworks.
Key Features of OpenTelemetry
- Supporting Multiple Programming Languages: OpenTelemetry offers language support, but not limited to Java, Go, Python, and JavaScript. It is a flexible choice for organizations with microservices architectures.
- Compatibility with Existing Observability Tools: OpenTelemetry's compatibility with popular observability tools like Prometheus, Grafana, and Elasticsearch is the core competency. Organizations can combine OpenTelemetry with their existing monitoring and logging infrastructures, optimizing their investments while gaining the advantages of OpenTelemetry's standardized approach.
- Customization and Adaptability: OpenTelemetry allows developers and executors to customize and adapt instrumentation according to their specific needs. This flexibility helps teams to tune telemetry collection, reducing overhead or capturing additional context as required.
- Uniform Instrumentation Layer for Cross-Language and Observability: Implementing a single, consistent instrumentation layer that spans various programming languages and technologies for achieving observability in modern software applications. This approach provides monitoring and tracing abilities, allowing for an understanding of a system's behavior of the technology stack. By adopting such a strategy, organizations can understand their observability efforts, simplify troubleshooting, and gain a deeper understanding of the performance of their systems.
Components of OpenTelemetry
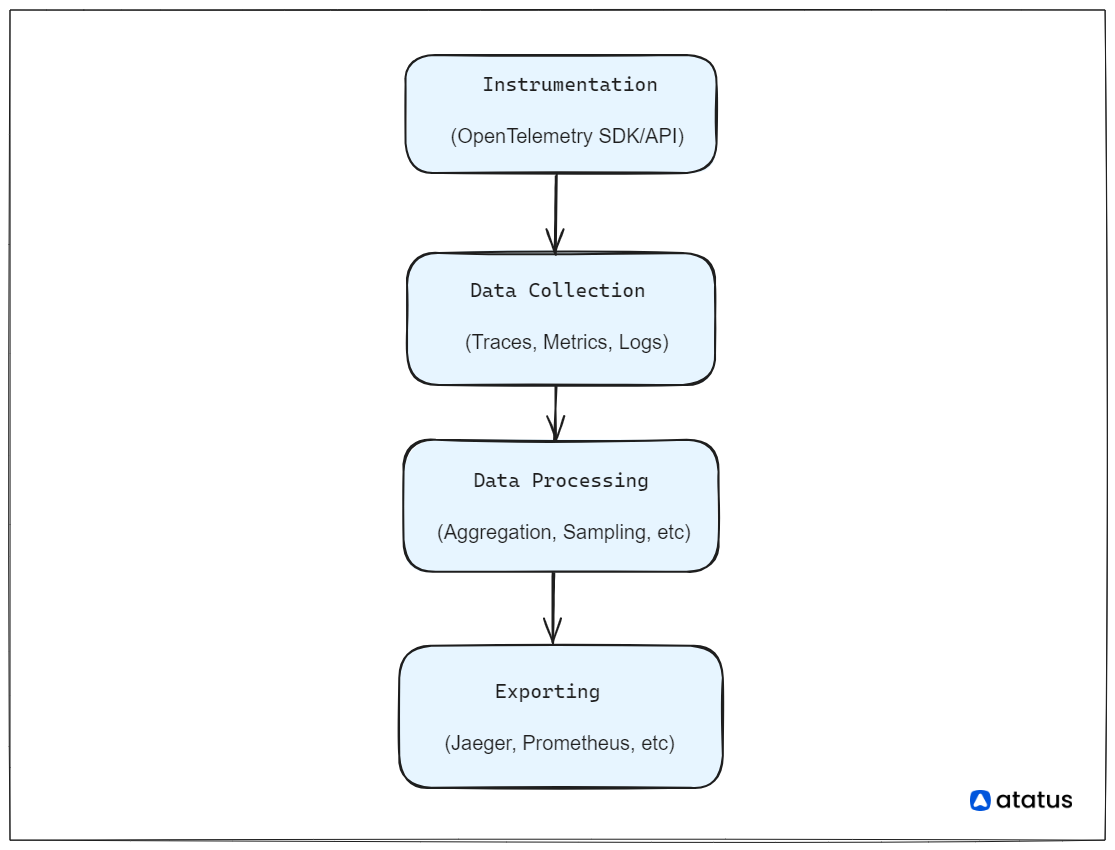
- Instrumentation Libraries: OpenTelemetry provides instrumentation libraries and SDKs for various programming languages and frameworks. To instrument developers applications these libraries were used and services to capture telemetry data without significant manual effort automatically.
- APIs and Standards: OpenTelemetry defines APIs and standards for consistently capturing and representing telemetry data across different systems and platforms. These standards provide interoperability and compatibility between OpenTelemetry components and third-party observability tools.
- Data Collection: OpenTelemetry collects telemetry data from instrumented applications and services, including traces (distributed request information), metrics (performance and resource usage), and logs (event information). This data is essential for understanding the behavior and performance of distributed systems.
- Data Processing: OpenTelemetry includes functionality for processing collected telemetry data, such as aggregation, sampling, and other processing tasks. Processing telemetry data helps transform raw data into actionable perceptions, enabling better understanding and analyzing system behavior.
- Exporters: OpenTelemetry supports exporting telemetry data to various backends and observability platforms, including Jaeger for tracing, Prometheus for metrics, and logging services for logs. Exporters enable telemetry data to be stored, analyzed, and visualized effectively in observability tools and platforms.
Limitations of OpenTelemetry
- Maturity: OpenTelemetry is still relatively new, and while it has seen rapid development, some features may still be evolving or not fully matured compared to more established observability solutions.
- Learning Period: Implementing OpenTelemetry instrumentation may have a learning curve for developers new to distributed tracing and observability concepts.
- Performance: Instrumenting applications with OpenTelemetry can introduce some performance overhead, although efforts are made to minimize this impact.
- Limited Language Support: While OpenTelemetry aims to support multiple programming languages, some languages may have more robust support than others and support for less commonly used languages may be limited.
- Resource Consumption: OpenTelemetry may consume additional resources (CPU, memory) on the instrumented applications and infrastructure due to data collection and transmission processes.
What is Jaeger?
Jaeger is an open-source, end-to-end distributed tracing system designed to monitor, analyze, and troubleshoot microservices-based architectures effectively. It provides a rich perception of service dependencies, latencies, and performance bottlenecks, helping identify and resolve issues efficiently.
Key Features of Jaeger
- Distributed Context: Jaeger offers the context for multiple services and components. It verifies that each span within a distributed trace carries essential information and allows end-to-end visibility.
- Superior Data Collection: Jaeger succeeds in collecting excellent quality telemetry data. It pictures necessary attributes for traces, in-depth analysis, and troubleshooting. Jaeger decreases the impact on the performance of the application.
- Analysis and Trace Visualization: Jaeger provides a web-based UI to trace visualization, allowing developers and operators to explore particular traces, understand service dependencies, and analyze performance bottlenecks.
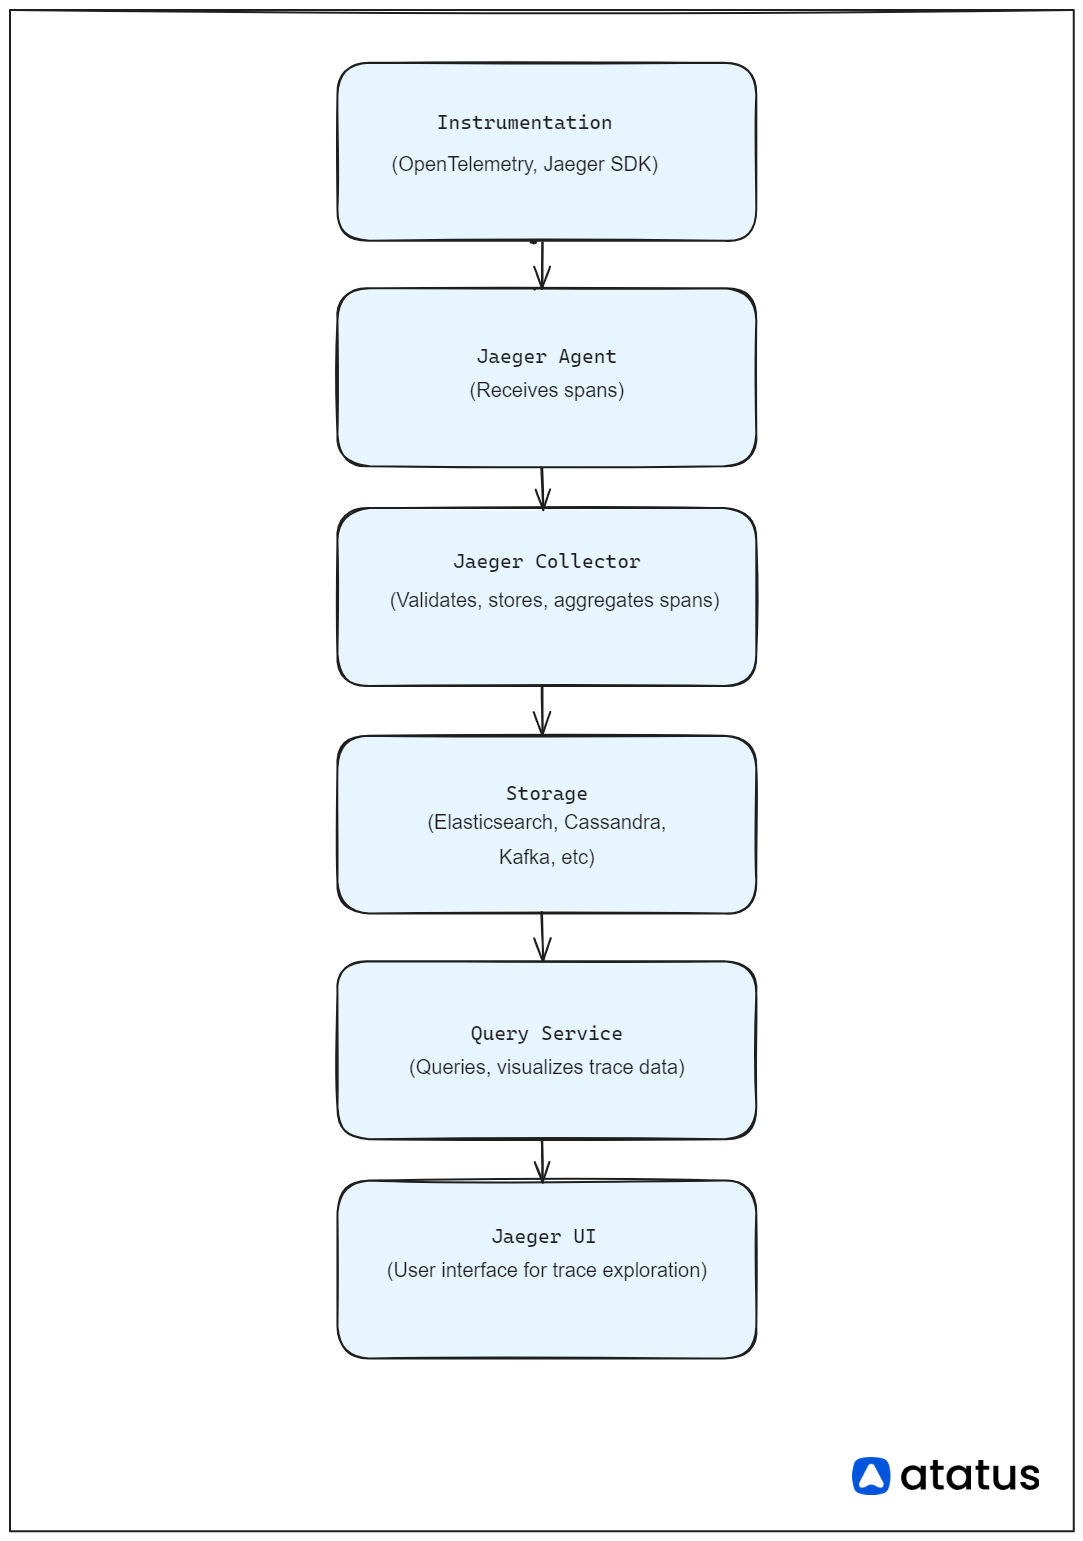
Components of Jaeger
- Agent: The Jaeger Agent is responsible for receiving spans (individual units of work) from instrumented applications and forwarding them to the Jaeger Collector. It supports multiple protocols, including Thrift, gRPC, and HTTP.
- Collector: The Jaeger Collector receives spans from multiple agents and performs several tasks, including validation, storage, and aggregation. It stores spans in a backend storage system, such as Elasticsearch or Cassandra, for later querying and visualization.
- Storage: Jaeger requires a backend storage system to store spans efficiently. It supports various storage options, including Elasticsearch, Cassandra, and Kafka. These storage systems enable long-term retention and querying of trace data for analysis and troubleshooting.
- Query: The Jaeger Query service provides a user-friendly interface for querying and visualizing trace data. It allows users to search for traces based on various criteria, visualize trace timelines, and identify performance bottlenecks and issues.
- UI: The Jaeger UI is a web-based interface that interacts with the Jaeger Query service to display trace data in a user-friendly format. It provides features for exploring traces, analyzing performance metrics, and identifying exceptions.
Limitations of Jaeger
- Scalability: While Jaeger is designed to be scalable, setting up and managing a highly scalable Jaeger deployment may require significant expertise and resources.
- Storage Requirements: Storing trace data in Jaeger can require significant storage resources, especially in high-traffic or large-scale environments, leading to potential storage costs and management challenges.
- Complexity: Configuring and managing Jaeger for complex microservices architectures or hybrid cloud environments can be complex and may require dedicated resources and expertise.
- Integration Limitations: Jaeger may have limitations in integrating with certain legacy systems or proprietary protocols, which can impact its ability to trace requests across diverse environments.
- Maintenance Overhead: Like any distributed tracing system, Jaeger requires ongoing maintenance, monitoring, and management to enable its continued reliability and performance.
Comparing OpenTelemetry and Jaeger
a.) Common Features of OpenTelemetry and Jaeger
- Context Distribution: Both OpenTelemetry and Jaeger provide robust support for context distribution, allowing end-to-end visibility for request flows across multiple services and various components.
- End-to-End Trace Visibalization: OpenTelemetry and Jaeger are masters in providing trace visibility, enabling developers to analyze application performance across distributed systems.
- Integrating with Popular Frameworks: OpenTelemetry and Jaeger provide integrations with frameworks and libraries, making it flexible for developers to instrument their applications in their preferred language and framework.
b.) Key Distinctions: OpenTelemetry vs. Jaeger
- Scope and Focus: OpenTelemetry contributes observability instrumentation across various systems and frameworks, providing a uniform approach. But, Jaeger focuses primarily on distributed tracing and in-depth analysis of trace data.
- Implementation and Architecture: OpenTelemetry operates a system of SDKs, APIs, and collectors, offering flexibility and extensibility. Jaeger, as a tracing system, offers a distributed tracing use case with a structured architecture.
- Community and Support: Community support is the key benefit of OpenTelemetry, supported by leading observability vendors. Jaeger, with its active open-source community, focuses extensively on magnifying distributed tracing capabilities.
Pros of OpenTelemetry and Jaeger
| Feature | OpenTelemetry | Jaegar |
|---|---|---|
| Ease of Adoption | Provides standardized APIs and SDKs for multiple languages | Easy to set up and integrate with various frameworks |
| Flexibility | Modular design allows for customization and extensibility | Simplified architecture with focused tracing capabilities |
| Ecosystem | Cloud Native Computing Foundation (CNCF) - part of it | Widely used and supported within the observability community |
| Extensibility | Supports integration with various observability tools | Provides APIs for building custom extensions and plugins |
Cons of OpenTelemetry and Jaeger
| Feature | OpenTelemetry | Jaegar |
|---|---|---|
| Complexity | Initial setup and configuration may be complex | Limited to tracing functionality, lacks other telemetry features |
| Learning Period | Requires understanding of distributed tracing concepts | Limited documentation and community support for advanced use cases |
| Performance | Overhead from collecting additional telemetry data | Lightweight and efficient tracing, but may lack scalability for large systems |
| Dependency | Dependent on other observability tools and platforms | It may require additional components for a complete observability solution |
Conclusion
In conclusion, OpenTelemetry and Jaeger offer powerful tracing solutions for monitoring and troubleshooting modern software applications. Understanding their key features, similarities, and differences is essential in making an informed decision.
Whether you choose the standardized approach of OpenTelemetry or the specific and focused distributed tracing capabilities of Jaeger, implementing a robust tracing solution is important for the performance and reliability of the applications.
Considerations for Choosing an Observability Solution include evaluating your organization's specific requirements, assessing the level of tracing depth needed, and considering the compatibility with existing monitoring infrastructure. By considering these factors, you can select the right tool with confidence that aligns with your needs.
Monitor Your Entire Application with Atatus
Atatus is a Full Stack Observability Platform that lets you review problems as if they happened in your application. Instead of guessing why errors happen or asking users for screenshots and log dumps, Atatus lets you replay the session to quickly understand what went wrong.
We offer Application Performance Monitoring, Real User Monitoring, Server Monitoring, Logs Monitoring, Synthetic Monitoring, Uptime Monitoring and API Analytics. It works perfectly with any application, regardless of framework, and has plugins.

Atatus can be beneficial to your business, which provides a comprehensive view of your application, including how it works, where performance bottlenecks exist, which users are most impacted, and which errors break your code for your frontend, backend, and infrastructure.
If you are not yet a Atatus customer, you can sign up for a 14-day free trial .
#1 Solution for Logs, Traces & Metrics
![]() APM
APM
![]() Kubernetes
Kubernetes
![]() Logs
Logs
![]() Synthetics
Synthetics
![]() RUM
RUM
![]() Serverless
Serverless
![]() Security
Security
![]() More
More