Top 7 AppDynamics Competitors and Alternatives to Try in 2024
AppDynamics was founded by Jyoti Bansal in 2008. It is an application performance management (APM) and IT operations analytics (ITOA) company that focuses on managing application performance and availability in a cloud computing environment and inside the data centre.
Here how it’s done:
- Introducing AppDynamics
- Top 7 AppDynamics Alternatives
Introducing AppDynamics
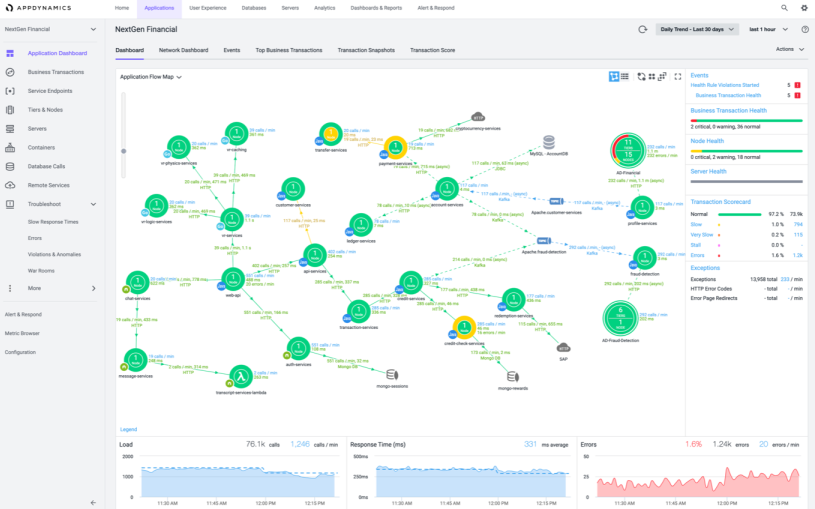
AppDynamics is an application performance management tool that helps you to align your business outcomes with IT. It provides tools like Cloud Monitoring, DevOps, Cloud Migration, and Unified Monitoring to gain the most efficient way of performance-boosting. AppDynamics provides detailed observability facilitating to increase business decisions using modules like infrastructure monitoring, multi-cloud monitoring, end-user monitoring, network monitoring, and much more.
It provides access to enterprises to use mechanisms like dynamic baselining, application mapping, and code-level diagnostics. Enterprises get to pinpoint the root cause of code-related errors and get them, resolved in real-time. They can also analyse the performance of individual applications and their potential impact on business.
With network monitoring, you can isolate the performance issues to the networks which are in charge of driving business applications. An intuitive cognition engine gets anomaly detection in an automated manner using machine learning.
It supports Java, .NET, PHP, Node.js, SQL, and Server Networks. It integrates with Splunk, Rookout, Apica, DB CAM, Scalyr, Compuware Strobe, AppDynamics for Database, and ServiceNow.
Customer Rating:
G2 Crowd – 4.2/5 stars
Capterra – 4.5/5 stars
Top 7 AppDynamics Alternatives
- Atatus
- Dynatrace
- AppOptics
- Datadog
- Sumo Logic
- New Relic
- Instana
We will break down some of the major features of each software and why we think it is a great alternative to AppDynamics and what additional features you can use to combine some tasks to help you save money on your monitoring solution overall.
#1 Atatus
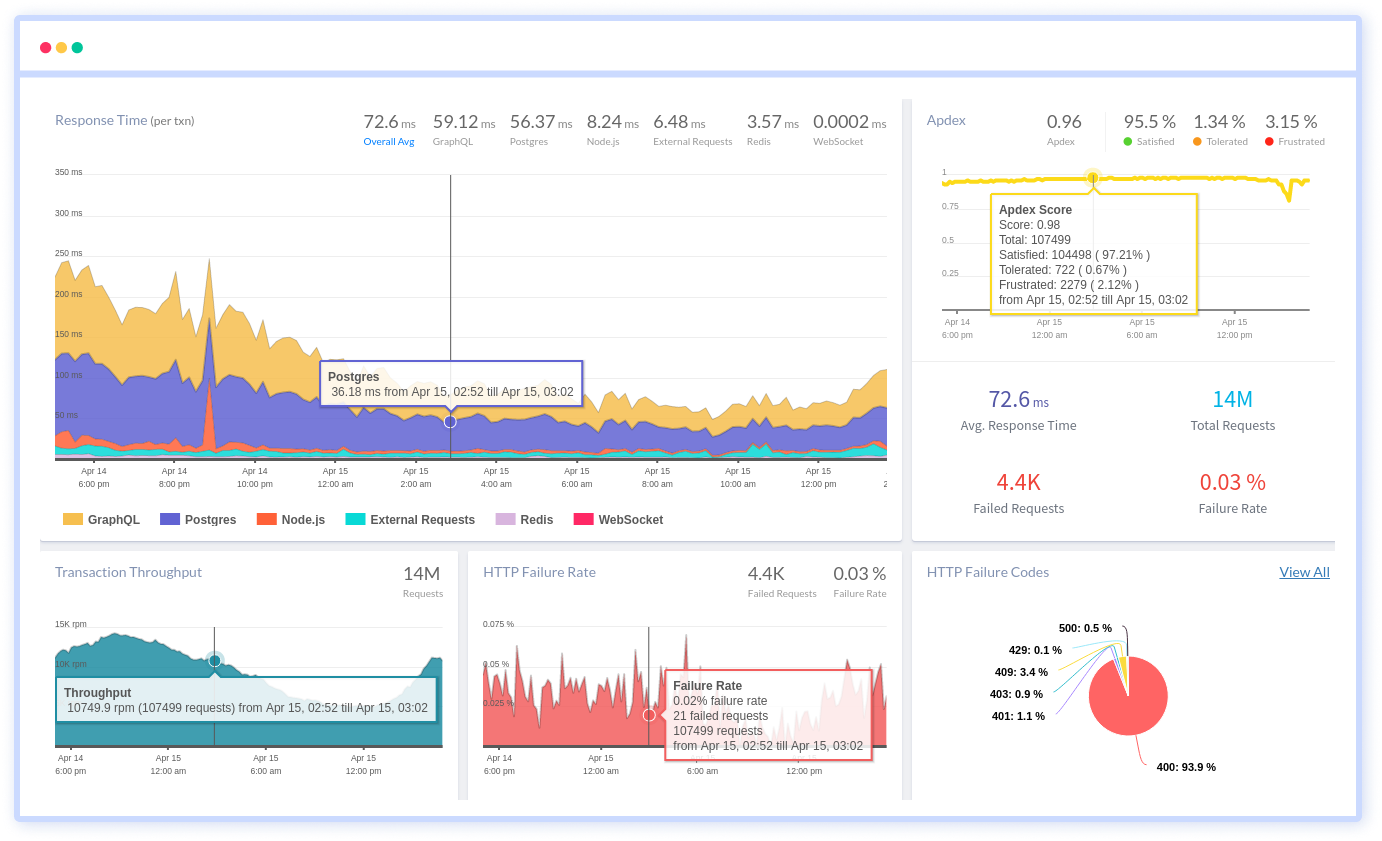
Atatus is a SaaS-based application performance management with an error tracking solution to delivers full-stack visibility for all your applications in one solution. We provide the access to dynamically collect millions of performance data points across the applications so that users can quickly resolve issues, and improve digital customer experiences. With cloud or on-premise deployment flexibility, you can implement all this in real-time, in production.
Atatus allows having a more granular look into your transactions and their outliners by drilling down into the main cause in your application. With our easy-to-navigate dashboard, you can view historical performance metrics and errors. Also, you can track error rates to ensure that your application is performing at peak historical levels.
Along with transactional monitoring (APM), Atatus offers Real User Monitoring, Log Monitoring, Database Monitoring, Error Tracking, and Server Monitoring capabilities that will give you an overview of an application and how it is performing. This includes measuring the performance of database queries from Redis, Memcache, and MongoDB along with queries that cause the performance to slow down.
Atatus supports PHP, Java, Ruby, Python, React, and Node.js. It integrates with Slack, Asana, HipChat, OpsGenie, Datadog, VictorOps, YouTrack, and much more.
Customer Rating:
G2 Crowd – 4.8/5 stars
Capterra – 4.8/5 stars
#2 Dynatrace
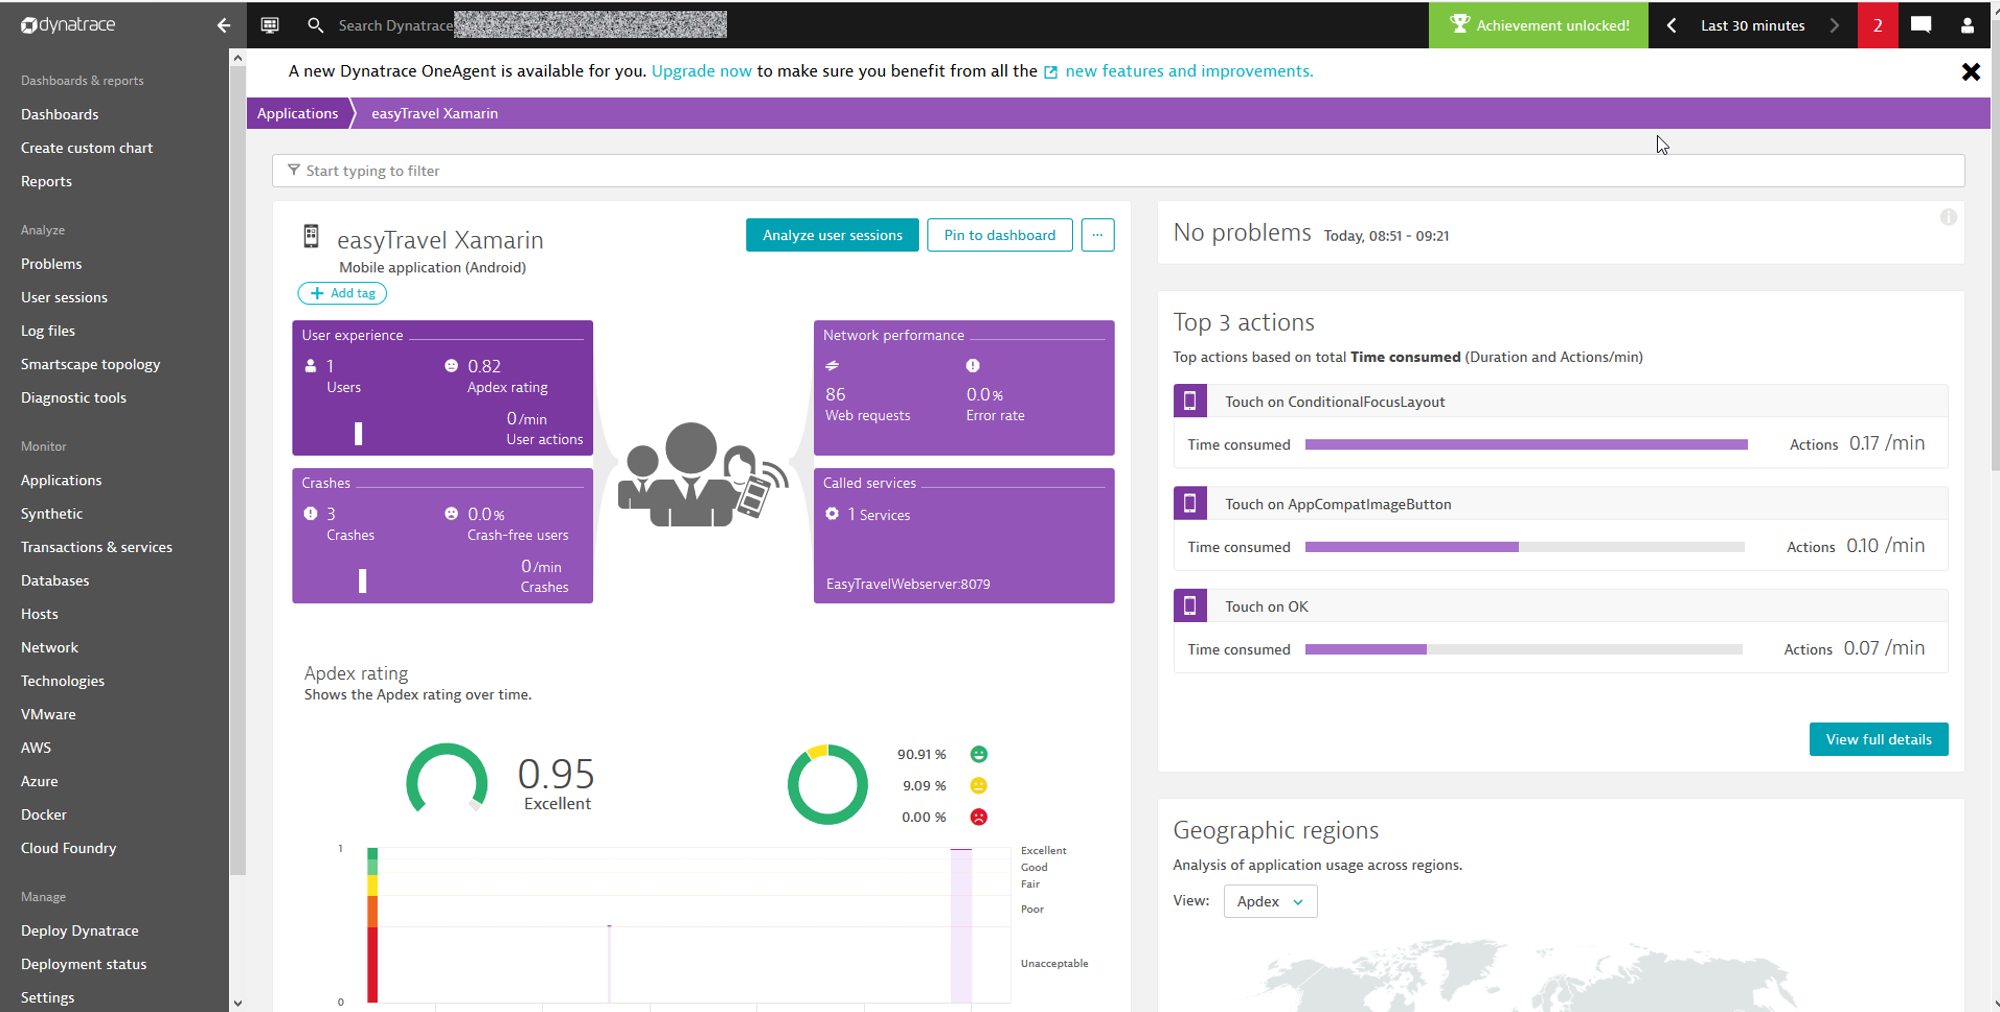
Dynatrace is an artificial intelligence-based platform to monitor and optimize application performance and development, user experience, and IT infrastructure for businesses to develop their application and website. The tool uses a proprietary form of artificial intelligence called Davis to identify, map, and monitor applications, microservices, container orchestration platforms like Kubernetes, and IT infrastructure running in multi-cloud and hybrid cloud environments and provides automated error remediation.
Dynatrace provides observability of the full solution stack that simplifies cloud complexity and speeds up your business’s digital transformation and cloud migration. It is designed to monitor the application performance assigned to it and make them work better by improving their performance and availability. It let you innovate faster, collaborate efficiently, and deliver more value with less effort.
It supports PHP, Java, Go, .NET, Node.js, and much more. Also, it can be integrating with OpenTracing, Slack, WebHooks, OpsGenie, Atlassian, etc.
Customer Rating:
G2 Crowd – 4.5/5 stars
Capterra – 4.4/5 stars
#3 AppOptics
AppOptics is a SaaS-based infrastructure and application monitoring tool into one seamless, centralized platform for custom on-premises, cloud, and hybrid systems. It gives you real-time visibility into your application along with tracing errors and bottlenecks to visualize how they are affecting performance.
AppOptics allows you to monitor a huge set of applications and programming languages that gives you instant visibility without changing other monitoring solutions. The host agent is used as an active community of plugins for different systems, languages, and a service that can be monitored using a fully personalized, real-time dashboard.
It supports .NET, Python, PHP, Scala, Node.js, Ruby, and Go. Also, it integrates with Apache, Cinder, Flask, HipChat, MongoDB, VictorOps, Zapier, and much more.
Customer Rating:
G2 Crowd – 4.2/5 stars
#4 Datadog
Datadog is a cloud-based application monitoring tool for infrastructure, applications, and event logs. It allows you to search, collect, and analyse traces across fully distributed platforms. Also, you can automatically track data flows and cluster services by their interdependencies in real-time.
It narrows down from a global perspective to one single customer’s particular line of code or request trace. Datadog provides a machine learning-based monitor to surface and auto-detect errors with zero configuration. Using Datadog APM, you can auto trace requests from any popular library or framework. It also enables you to find traces that match a particular customer, error code, custom tag, or service.
Datadog support Java, Go, Python, Ruby, PHP, .NET, and Node.js. It integrates with Spring, Laravel, Ruby on Rails, and Django give instant visibility into anomalies.
Customer Rating:
G2 Crowd – 4.2/5 stars
Capterra – 4.6/5 stars
#5 Sumo Logic
Sumo Logic is a cloud-based application performance management and data analytics company that focuses on security, operations, BI use-cases. It provides analytics service and log management with machine-generated big data to provide real-time IT insights. It is the industry’s leading, secure, cloud-based service for metrics and logs management for modern applications, providing real-time analytics and insights.
With real-time analytics, you can rapidly identify and resolve potential cyber-attack, detect, and prevent breaches, and reduce compliance costs. Their machine-learning algorithms work 24/7 and alert you if there is an important event or issue to fix. Personalized dashboards will align teams by visualizing metrics, logs, and performance data for full-stack visibility and reliable delivery.
Sumo Logic integrates with Apache, Amazon Web Services, Google Cloud Platform, Microsoft Azure, Salesforce, Slack, and much more.
Customer Rating:
G2 Crowd – 4.3/5 stars
Capterra – 4.6/5 stars
#6 New Relic
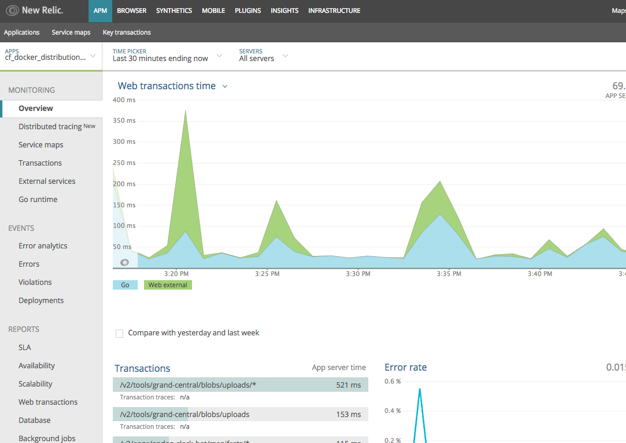
New Relic is a popular application performance management tool that was established by Lew Cirne in 2008. It has been used across the globe and is currently an integral tool for all IT industries and business executives. Using New Relic, you can monitor applications and address critical issues before they affect end-users.
New Relic is a cloud-based tool that helps you to track your application and website performances of their services. You can also send calls to APIs and confirm that each output and system response is successfully returned from multiple locations across the world. If you notice any errors in the software, you can take actual screenshots of the errors and send them to the creators of New Relic to resolve them.
It supports languages like Java, .NET, Ruby, Go, PHP, and Python. Also, it integrates with Amazon Web Services, Microsoft Azure, Google Cloud Platform, IBM Cloud, Pivotal Cloud Foundry, etc.
Customer Rating:
G2 Crowd – 4.2/5 stars
Capterra – 4.5/5 stars
#7 Instana
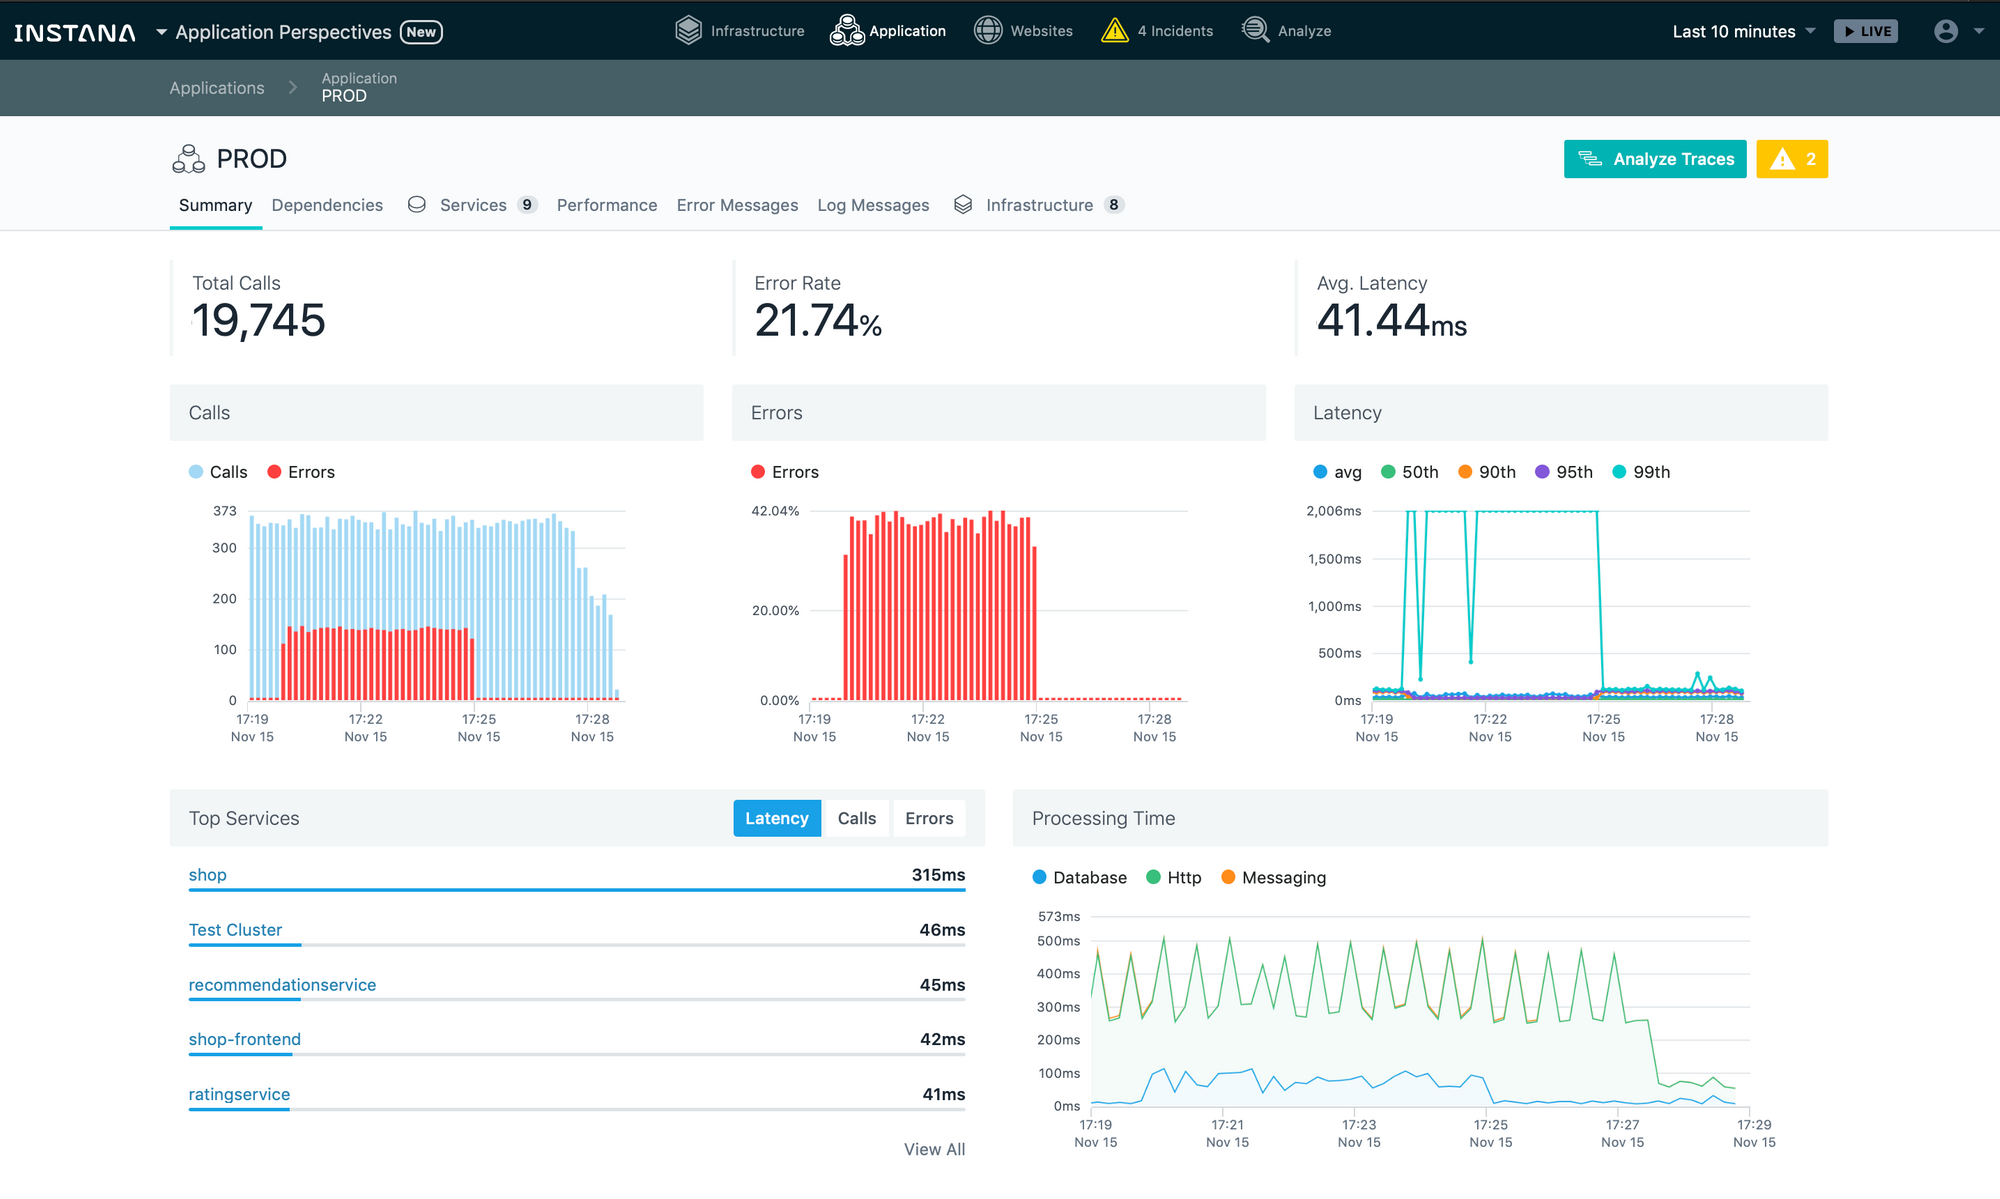
Instana is used for monitoring and managing the application performance used in microservice architectures, and permits 3D visualization of application performance through graphs using machine learning algorithms which notifications regarding performance that generated automatically. Instana’s APM is used purposed for application monitoring used in so-called “container orchestration”.
Instana helps to make sure that the organization has the application delivery data, visibility, and information that you need to manage the performance of critical business applications across the DevOps lifecycle. It is used to handle the dynamic nature of containerized, microservice architectures. Instana's automatic infrastructure and application monitoring will ensure the application performance, quality of custom applications and accelerate the CI/CD cycle.
Instana supported languages are Java, Ruby, Python, Go, Scala, .NET, Node.js, and PHP. It integrates with Amazon Web Service, Google Cloud Platform, Microsoft Azure, Red Hat, VMware, and much more.
Customer Rating:
G2 Crowd – 4.6/5 stars
Capterra – 3.5/5 stars
Conclusion
We hope our list of AppDynamics alternatives will help you find a replacement tool for whatever you are looking for. Many of these applications have a free trial for 14 to 30 days, so it is worthwhile to sign-up and tests this tool in your network before actually committing to long-term use.
Atatus provides a 14-day unlimited free trial to access every feature of the software. Also, share which tool are you going to try for your business.
#1 Solution for Logs, Traces & Metrics
![]() APM
APM
![]() Kubernetes
Kubernetes
![]() Logs
Logs
![]() Synthetics
Synthetics
![]() RUM
RUM
![]() Serverless
Serverless
![]() Security
Security
![]() More
More

![New Relic vs Sentry - Which Monitoring Tool to Choose? [2024]](/blog/content/images/size/w960/2024/10/VS--1-.png)
![New Relic vs Splunk - In-depth Comparison [2024]](/blog/content/images/size/w960/2024/10/Datadog-vs-sentry--19-.png)