Understanding the programming language of evolving systems is complicated by new and advanced technology. With so many applications and websites in place, it's important to have a dedicated leader who can break down the internal workings of the developer's end for a clearer picture of how things function.
OpenTelemetry, an open-source tool, is the only one that can do it. When dealing with disruptive systems and troubleshooting in a distributed workflow, this model makes the concerns behind an app software transparent and enables request tracking, which provides context to technologists and aids in better conflict resolution.
We will cover the following:
- What is OpenTelemetry?
- What is Telemetry Data?
- OpenTelemetry Architecture
- Components of OpenTelemetry
- Benefits of OpenTelemetry
- OpenTelemetry Future
What is OpenTelemetry?
OpenTelemetry is an open-source observability framework that consists of a set of tools, APIs, and SDKs. It enables IT teams to collect, analyze, and export telemetry data in order to better understand application performance and behavior.
It provides vendor-neutral APIs, software development kits (SDKs), and other tools for gathering telemetry data from cloud-native applications and their underlying infrastructure in order to better understand their performance and health.
In today's complicated, distributed environment, managing performance is incredibly tough. Telemetry data is essential for DevOps and IT teams to understand the behavior and functioning of these systems. They need to instrument all of their frameworks and libraries across programming languages to get a complete picture of their services and applications' behavior.
OpenTelemetry is significant because it standardizes the collection and transmission of telemetry data to backend platforms. It eliminates visibility gaps by standardizing instrumentation across all services.
When a backend platform is changed, engineers don't have to re-instrument code or install separate proprietary agents. Unlike commercial systems, which require vendors to design new connections to make their products interoperable, OpenTelemetry will continue to work as new technologies emerge.
What is Telemetry Data?
In observability, telemetry data is the output acquired from system sources. When these results are combined, they create a picture of the relationships and dependencies that exist within a distributed system.
Logs, metrics, and traces are the three primary data classes employed, which are often referred to as "the three pillars of observability."
#1 Log
A log is a text record of an event that occurred at a specific point in time. A log entry is generated whenever a block of code is executed, documenting the time the event occurred and providing a "payload" of context about the event.
There are three types of log data: plain text, structured, and unstructured. The most prevalent format is plain text, but structured logs, which include additional metadata and are easier to query, are becoming increasingly popular. Unstructured logs, on the other hand, are more difficult to understand. The source of truth for what the application is doing is usually the logs.
It's where you go when something goes wrong in a system, and it's where developers go to diagnose and test their code. A distributed system failure usually has a number of underlying causes (sometimes known as root causes), and logging gives us fine-grained information about when certain code blocks are performed.
#2 Metrics
A metric is a numerical number that is calculated over a period of time. It contains specific information such as the timestamp, event name, and event value.
Metrics, unlike logs, are structured by default, making them easier to query. It also optimizes them for storage, allowing you to keep more measurements for longer periods of time, providing you with a better view of a system's historical trends.
When you need an answer to a specific issue, metrics perform best with huge data sets or data collected at regular intervals. We are accustomed to seeing metrics aggregated across time, which is critical in our current systems for analyzing and responding to concerns.
Metrics can trigger alarms, either as a group or as a single point, and are frequently the first sign of a problem in our systems.
#3 Traces
A trace displays a request's complete travel through a distributed system. As a request progresses through a system, it undergoes a number of procedures.
Each operation is given a "span" that contains information such as the trace identifier, the span identifier, the name of the operation, a start and finish timestamp, logs, events, and other indexed data.
You may track a complete execution path and see whether a section of the code is producing issues like failures, latency concerns, or resource availability by viewing a trace, also known as distributed tracing.
Traces can also create metrics, particularly in the RED format (rate, errors, and duration). Traces are also useful for deciding which occurrences of the other two pillars are most relevant for diagnosing a specific problem.

Logs, metrics, and traces serve various purposes on their own, but when combined, they provide the in-depth information needed to analyze and debug distributed systems.
OpenTelemetry Architecture
OpenTelemetry's architecture is made up of numerous components that work together to deliver optimum value to enterprises that use it. Taking a high-level look at each of these components can help you realize the true value of OpenTelemetry. This can help companies see what it has to offer in terms of data collecting and customer analytics.
- API
APIs are language-specific computer programs that provide the fundamentals for integrating OpenTelemetry. They make it easy to add new features to the app by providing a framework that can be attached to it. - SDK
The SDK is another language-specific component of the architecture. This serves as a sort of mediator, bridging the gap between the exporter and the APIs. Because of the SDK's additional setup, transaction sampling and request filtering are both handled more easily. - Collector
Technically, this is the only component that isn't essential. The Collector, on the other hand, makes setting up OpenTelemetry architecture faster and easier. It's a highly handy component that allows you to transmit and receive application telemetry on the backend with a lot of flexibility. The collector can be deployed in two ways: as an agent or as a standalone. - Exporter
Companies can use an Exporter to determine whose backends they're sending telemetry to. The backend configuration is independent of instrumentation, providing for a variety of options. It's simple to switch backends, and there's no need to re-instrument code.
Components of OpenTelemetry
The MELT approach, which may be separated into four different data groups, is used by OpenTelemetry to standardize data visibility.
- Metrics
This entails time-sensitive numerical metrics that show average transactions per second. - Events
By creating a data inventory comprised of user-defined units, keeps track of specific actions. - Logging
This app-generated interface gathers text that can be used to troubleshoot problems. Log data, on the other hand, can be difficult to grow and is also expensive. - Tracing
This shows how requests move through a system and how various components interact to produce a concrete picture of the app's status.
Benefits of OpenTelemetry
OpenTelemetry has a number of features that can help the technology business in a variety of ways:
- Ease to Use
It is business-friendly and helps in the achievement of objectives. It provides developers and engineers with a complete manual that helps them discover bugs faster, report them, and repair them right away, saving time and resulting in positive results. - Consistency
It offers a de facto standard for adding observability to cloud-native apps by providing a consistent method for gathering telemetry data and delivering it to a backend without modifying instrumentation. Instead of wrangling with their instrumentation, developers and IT can now focus on designing new application features. - Simpler Choice
Organizations had to select between OpenTracing or OpenCensus before OpenTelemetry, each of which took a different strategy to obtain observability. Because the code of the two frameworks is combined in OpenTelemetry, you get the best of both in a single solution. If you were previously utilizing one of the two, moving to OpenTelemetry poses no danger. Both are backward compatible with OpenTelemetry. - Streamlined Observability
Developers can monitor application usage and performance metrics with OpenTelemetry from any device or web browser. This user-friendly interface makes tracking and analyzing observability data in real-time a breeze.
OpenTelemetry Future
The OpenTelemetry initiative is still in its infancy. It's still in beta, so it only supports traces and metrics for now; log support is in the works.
OpenTelemetry's fundamental components are being stabilized, automated instrumentation via agents is being integrated, language compatibility is being added, and metrics capabilities are being improved. After that, we should see if a production-quality release becomes widely available.
Along with Prometheus and Kubernetes, OpenTelemetry is one of CNCF's most popular open-source projects, and it has a lot of support from the IT community. In the cloud-native telemetry landscape, OpenTelemetry will eventually become the main observability framework.
Conclusion
Even while observability is a key component of OpenTelemetry, including it into the existing system may be a bigger step toward meeting the pressing needs of a supportive data ecosystem. End-to-end accountability ensures that the process is transparent and that the infrastructure is fit for a good user experience.
OpenTelemetry is the key to organizing your telemetry and providing the entire visibility you need to optimize your observability practices. It gives you the tools you need to collect data from across your whole technological stack without getting bogged down in tool-specific debates. In the end, it aids in the smooth operation of your applications and greatly improves business consequences.
Check out:
- Business Intelligence (BI)
- Continuous Intelligence
- DevSecOps
- IT Service Intelligence (ITSI)
- Machine Data
Atatus API Monitoring and Observability
Atatus provide Powerful API Observability to help you debug and prevent API issues. It monitors the user experience and be notified when abnormalities or issues arise. You can deeply understand who is using your APIs, how they are used, and the payloads they are sending.
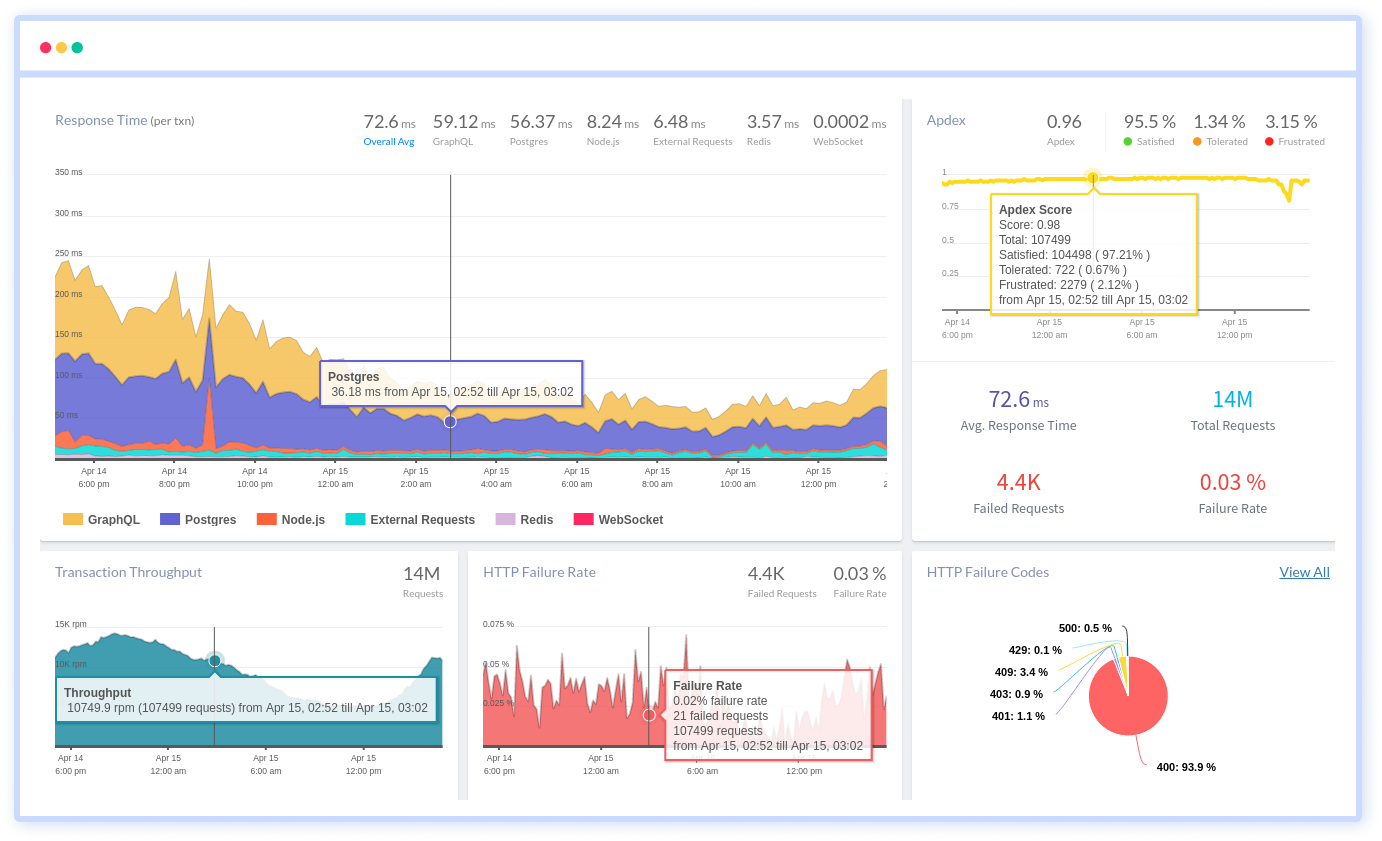
Atatus's user-centric API observability monitors the functionality, availability, and performance of your internal, external, and third-party APIs to see how your actual users interact with the API in your application. It also validates rest APIs and keeps track of metrics like latency, response time, and other performance indicators to ensure your application runs smoothly. Customers can easily get metrics on their quota usage, SLAs, and more.