IT teams are under increasing pressure to track and respond to conditions and concerns across their multi-cloud environments as dynamic systems designs become more complicated and scaled. As a result, IT operations, DevOps, and SRE teams all want more observability into these increasingly diverse and complex computing environments. Observability allows for deep visibility into current distributed applications, allowing for faster and more automated problem detection and resolution.
We will go over the following:
- What is Observability?
- Three Pillars of Observability
- Benefits of Observability
- Challenges in Observability
- Why Observability is Important?
What is Observability?
In general, observability refers to the extent to which you can deduce a complicated system's internal status or condition solely from its exterior outputs. Without additional testing or coding, you can move from an identified performance problem to its core cause faster and more precisely if the system is more observable.
Observability also refers to software tools and practises for aggregating, correlating, and analysing a steady stream of performance data from a distributed application and the hardware it runs on in order to more effectively monitor, troubleshoot, and debug the application to meet customer experience expectations, service level agreements (SLAs), and other business requirements in cloud computing.
Observability is based on telemetry collected from endpoints and services in your multi-cloud computing setups. Every component of hardware, software, and cloud infrastructure, as well as every container, open-source tool, and microservice, generates records of every activity in these modern systems.
The purpose of observability is to comprehend what's going on across all of these environments and among the technologies so that you can spot and fix problems to keep your systems running smoothly and your customers satisfied.
Observability is a relatively new IT term that is frequently misunderstood as a hyped buzzword or a rebranding of system monitoring in general and application performance monitoring (APM) in particular.
Observability is, in reality, a logical progression of APM data gathering methodologies that better fits the increasingly rapid, distributed, and dynamic nature of cloud-native application deployments. Observability does not replace monitoring; rather, it improves monitoring and APM.
Three Pillars of Observability
Metrics, traces, and logs are three types of telemetry that are commonly used to describe observability. The three pillars of observability are sometimes referred to as these three important data points. It's important to remember that, while these pillars are essential for achieving observability, they are only the means to an end.
#1 Logs
Logs in the technology and development field give a written record of happenings within a system, similar to the captain's log on a ship. Logs are time-stamped and can be in binary or plain text forms. Structured logs, which mix text and metadata and are generally easier to query, are also available. A log can be the most efficient approach to find out what's wrong with a system.
#2 Metrics
Metrics are a set of values that are tracked over time. Key performance indicators (KPIs), CPU capacity, memory, or any other assessment of a system's health and performance are examples of metrics. Understanding performance changes over time allows IT teams to gain a better understanding of the user experience, which allows them to enhance it.
#3 Traces
A trace is a means to track a user request from the user interface all the way through the system and back to the user when they receive confirmation that their request has been completed. As part of the trace, every operation executed in response to the request is recorded.
A single request may pass through dozens of microservices in a complicated system. Each of these distinct actions, or spans, carries critical information that is incorporated into the trace. Traces are essential for locating bottlenecks in systems and determining where a process has failed.
Benefits of Observability
DevOps developers can use observability to gain a better understanding of an application's internal state at any given time, as well as more accurate data regarding system faults in dispersed production environments. The following are a few significant benefits:
- Better Workflow
Observability allows developers to observe the end-to-end path of a request, as well as relevant contextualised data about a specific issue, which speeds the investigation and debugging process for an application, resulting in improved performance. - Improved visibility
Developers often have trouble knowing what services are in production, whether application performance is good, who owns a specific service, or what the system looked like before the most recent deployment since distributed systems are so large. Observability provides them with real-time visibility into production systems, which can aid in the removal of these roadblocks. - Better Alerting
Observability enables developers to find and fix problems faster by offering deeper visibility into the system, allowing them to immediately establish what has changed, debug or fix issues, and determine what, if any, problems those changes have created. - Less Time in Meetings
Previously, developers had to scour third-party companies and applications for information on who was responsible for a specific service or what the system looked like days or weeks before the most recent deployment. This information is readily available due to effective observability. - Accelerated Developer Speed
Observability streamlines monitoring and troubleshooting, removing a major source of frustration for engineers. As a result, delivery times are faster, and DevOps workers have more time to come up with novel solutions to satisfy the needs of the company and its customers.
Challenges in Observability
Organizations commonly face the following issues when it comes to observability:
- Data Silos
It's difficult to comprehend interdependencies among applications, various clouds, and digital channels like web, mobile, and IoT since there are so many agents, disparate data sources, and silos monitoring tools. - Volume, Speed, Variety, and Complexity
The sheer volume of raw data generated from every component in ever-changing modern cloud platforms like AWS, Azure, and Google Cloud Platform (GCP) makes it nearly impossible to extract answers. This is also true for Kubernetes and containers, which may be started and stopped in a matter of seconds. - Manual Instrumentation and Configuration
When IT resources are obliged to manually instrument and alter code for each new type of component or agent, they spend the majority of their time attempting to set up observability rather than innovating based on observability data insights. - Lack of Pre-production
Even with pre-production load testing, developers have no way of seeing or understanding how real users would affect applications and infrastructure before pushing code into production. - Wasting Time Troubleshooting
To troubleshoot and try to discover the root cause of problems, teams from application, operations, infrastructure, development, and digital experience are called in, wasting important time guessing and trying to make sense of telemetry and come up with answers.
Then there's the challenge of multiple vendors and tools. While a single tool may provide observability into a specific region of an organization's application architecture, it may not provide total observability across all applications and systems that can affect application performance.
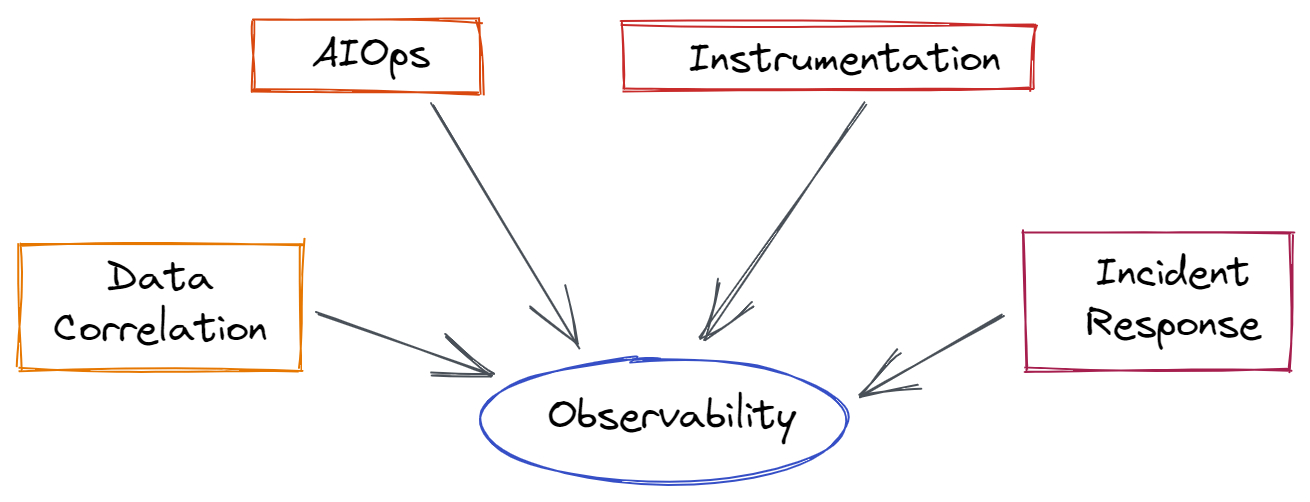
Why Observability is Important?
Observability aids cross-functional teams in enterprise environments in understanding and answering specific queries about what's going on in highly distributed systems. Observability allows you to see what is slow or broken, as well as what has to be fixed to increase performance. With an observability solution in place, teams may receive proactive notifications about issues and rectify them before they have an impact on users.
Most problems aren't understood or monitored since modern cloud infrastructures are dynamic and constantly evolving in scale and complexity. Observability solves the problem of "unknown unknowns" by allowing you to automatically and continually grasp new types of problems as they emerge.
For artificial intelligence IT operations (AIOps), observability is also an important feature. As more companies adopt cloud-native architectures, they're searching for ways to incorporate AIOps, which uses artificial intelligence to automate more operations throughout the DevSecOps life cycle.
Your organisation can have the solid answers it needs for automating application monitoring, testing, continuous delivery, application security, and incident response by bringing AI to everything — from gathering telemetry to evaluating what's occurring across the whole technological stack.
The advantage of observability extends beyond IT applications. You'll have an invaluable window into the business impact of your digital services once you start collecting and analysing observability data. This access allows you to improve conversions, confirm that software releases match business objectives, track the results of your user experience SLOs, and prioritise business choices based on the most important factors.
You can uncover problems before your users do with an observability solution that analyses user experience data using synthetic and real-user monitoring, and you can build improved user experiences based on real-time input.
Conclusion
Observability is more than a buzzword; it's a critical and practical technique to assessing the state of your entire infrastructure. The cloud, containerization, microservices, and other technologies have increased the complexity of systems to unprecedented levels.
Complex systems rely on effective monitoring tools designed specifically for cloud-based environments — yet using these tools does not guarantee observability, as observability is a holistic term that encompasses the entire system. Finally, whatever observability solutions you choose should be adaptive and scalable so that they may expand with your company.
Explore:
Application Performance Monitoring (APM)
Monitor Your Entire Application with Atatus
Atatus is a Full Stack Observability Platform that lets you review problems as if they happened in your application. Instead of guessing why errors happen or asking users for screenshots and log dumps, Atatus lets you replay the session to quickly understand what went wrong.
We offer Application Performance Monitoring, Real User Monitoring, Server Monitoring, Logs Monitoring, Synthetic Monitoring, Uptime Monitoring and API Analytics. It works perfectly with any application, regardless of framework, and has plugins.

Atatus can be beneficial to your business, which provides a comprehensive view of your application, including how it works, where performance bottlenecks exist, which users are most impacted, and which errors break your code for your frontend, backend, and infrastructure.
If you are not yet a Atatus customer, you can sign up for a 14-day free trial .