11 Best Tips to Node.js Debugging that You Didn’t Know in 2025
When people hear the term "Node.js Debugging," they immediately think of the function "console.log()." They also assumed that's how pros debug Node.js applications.
Nah!!! That's not good enough, mate.
You'll need more than the console.log() function to debug your Node.js application like a pro.
If the proper technique is not taken before testing, debugging a Node.js application might be difficult. Testing is an essential part of the development process for any application, software, or website. We'll go over the top 11 tips for debugging Nodejs in this article. This blog is a collection of some of the most unusual debugging tips for Node.js applications.
We will cover the following:
What is Debugging?
Debugging is the shady business of repairing software bugs. Often, fixing a bug is as simple as changing a single character or adding a new line of code. Finding that bug is a different story, and engineers often waste a lot of time trying to figure out what's wrong. Fortunately, Node.js provides some excellent tools for tracing problems.
Terminology
Debugging has its own set of obscure jargon, such as the following:
- Breakpoint – When a debugger stops a program so that its state may be examined
- Debugger – A debugging tool that allows you to see internal variable states by running code line by line
- Feature – It's something that every developer says at some time in their career.
- Frequency – How frequently or under what circumstances a bug will appear
- It doesn’t work – The most common but ineffective bug report
- Log point – A debugging instruction that displays the value of a variable at a certain point during execution
- Logging – Runtime data is written to the console or a file
- Logic error – The program works, but it doesn't do what it's supposed to do
- Priority – A bug is assigned to a list of upcoming updates
- Race condition – Bugs that are difficult to track are those that are reliant on the sequence or timing of uncontrollable events
- Refactoring – Rewriting code to make it easier to read and maintain
- Regression – A previously repaired bug reappears, possibly as a result of other updates
- Related – A bug that is linked to or comparable to another
- Reproduce – The steps that must be taken to cause the error
- RTFM error – A bug report disguised as user ignorance, usually followed by a response to "Read the Flipping Manual."
- Step into – Step inside the function being called when debugging code line by line
- Step out – Complete the current function's execution and return to the calling code when running line by line
- Step over – Complete the execution of a command without stepping into a function it calls when running line by line.
- Severity – The system's influence as a result of a bug
- Stack trace – The list of all methods that were called before the error
- Syntax error – Typographical errors, like console.lug()
- User error – An error created by a user rather than the application, although depending on that person's seniority, an update may still be required
- Watch – A variable to look at while the debugger is running
- Watchpoint – When a variable is set to a specified value, the program is stopped, similar to a breakpoint
How to Stay Away from Bugs?
Bugs can typically be avoided before your application is tested.
Invest in a Good Code Editor
Line numbering, auto-completion, colour coding, bracket matching, formatting, auto-indentation, variable renaming, snippet reuse, object inspection, function navigation, parameter prompts, refactoring, unreachable code detection, suggestions, type checking, and more are all features of a good code editor.
Make Use of a Code Linter
Before you save and test your code, a linter can detect errors including syntax errors, inadequate indentation, undeclared variables, and mismatched brackets. ESLint, JSLint, and JSHint are popular alternatives for JavaScript and Node.js.
You may perform checks from the command line by installing these as global Node.js modules:
eslint myfile.jsMake Use of Source Control
Git, for example, is a source control system that can help you protect your code and manage revisions. It becomes easy to determine when and where a bug was introduced, as well as who should be held accountable. GitHub and Bitbucket provide free storage and management features.
11 Best Node.js Debugging Tips
- Test-Driven Development
- Look into Other Console Methods
- Debugger Statement
- Inspect Flag
- Take a Look at Postman
- Logging/APM Tools
- Test Performance
- Debug in VS Code
- Make Use of Flame Graphing
- Debugging Memory Leaks
- Using Debugging Tool
#1 Test-Driven Development
Test-Driven Development is a development method in which unit tests are created before the code is written. Unit tests are based on the recurrence of small development cycles, and the requirements vary among test cases. The code in this method fails at first but passes once the developer writes clean code.
To put it another way, the developer first writes a test that fails since no code for these tests has been written yet. The developers should next check to see if the test cases fail. The next step is for the programmer to build clean code that passes the test cases. If the test cases fail, they should go over them again and build better code. The ultimate goal is to improve and streamline the code.
While this isn't particular advice for Debugging Node.js, understanding the fundamentals of testing is essential before debugging a Node.js application.
#2 Look into Other Console Methods
As I said before, when people hear Node.js debugging, they immediately think of the console.log() function.
The console.log() is familiar to most JavaScript developers. If you aren't, it will just print a string or an object. Most developers are unaware, however, that the console object itself includes a plethora of helpful methods that are sometimes overlooked. Let me show you a few of our personal favourites.
console.group()
You can create a new collection of JavaScript console logs by calling console.group(). This would group all of your logs together in the browser.
To exit the current group, call console.groupEnd(). For example, given this code:
console.log("This is the outer level");
console.group();
console.log("Level 2");
console.group();
console.log("Level 3");
console.warn("More of level 3");
console.groupEnd();
console.log("Back to level 2");
console.groupEnd();
console.log("Back to the outer level");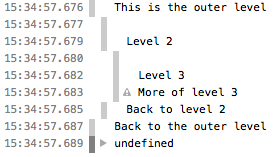
Then there's console.table().
Console.table() does exactly what it says on the tin: it takes an array or an object and returns an ASCII table. This is very beneficial for long or huge objects with a lot of characteristics because it adds structure to the object and makes it easier to comprehend.
// an object whose properties are strings
function Person(firstName, lastName) {
    this.firstName = firstName;
    this.lastName = lastName;
}
var me = new Person("John", "Smith");
console.table(me);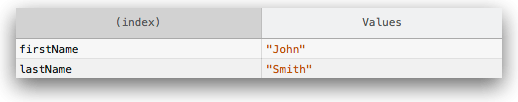
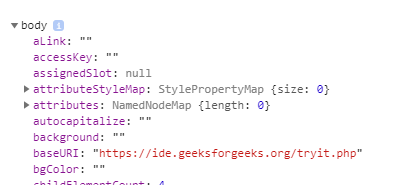
Last but not least, console.dir().
I'm highlighting this because it incorporates two arguments, the most essential of which is the last.
The first one accepts an object, whereas the second one takes an object of options. You can set the depth of your console login to this options object. You'll realize how tough it is to comprehend a huge output if you've ever tried to console log a native Node.js object.
Instead, you get the following using console.dir() with a depth property:
<!DOCTYPE html>
<html>
<head>
	<style>
		h1 {
			color:green;
		}
		body {
			text-align:center;
		}
	</style>
</head>
<body>
	<h1>GeeksforGeeks</h1>
	<h2>console.dir() Method</h2>
	<h3>
		Open console using F12 or Ctrl+Shift+I
	<h3>
	<script>
		console.dir(document.body);
		console.log(document.body);
	</script>
</body>
</html>
#3 Debugger Statement
The debugger statement is a simple method to begin debugging. A debugger statement pauses the execution of the code in the browser if the developer tools are open. In Node.js, however, there is no developer console, thus the equivalent would have to be done with inspecting. An interactive debugger will now appear, allowing you to walk through the execution of code.
This is a basic debugging solution that may work for small-scale Node.js applications, but extensive debugging requires a more sophisticated tool. However, you should be familiar with this method of debugging, just as you should be familiar with all of the different methods and how they work.
When using dev tools, type this command and paste the code. It will bring the code to a halt at the line. You'll be able to see all of the scoped variables and begin coding the experiment.
Save the following code as app.js:
const app = express();
app.get('/', (req, res) => {
    res.statusCode = 200;
    res.setHeader('Content-Type', 'text/plain');
    res.end('Hello World\n');
});
app.listen(8000, () => {
   console.info('Application is listening on port 8000!');
});
You can now begin using your application as usual:
node app.jsNow, Node.js doesn't have a developer console, so we'll have to create one to use in the browser. In Node.js, inspect is used to accomplish this.
node inspect app.jsUsing a port to listen to this application.
OUTPUT: Application is listening on port 8000!This can be a useful tool while working on a small Node.js application. You'll need a more capable tool for advanced debugging.
#4 Inspect Flag
The inspect flag restores several of the browser's debugging features. The inspect flag starts the debugger in the CLI. The inspect flag's job isn't overly difficult. Before starting the Node.js application, the developer must first tell Node.js that the application should run in debugging mode by giving a flag to the node process. A WebSocket connection will be established, allowing you to debug remotely from your browser.
If you're using Chrome, go to chrome:/inspect#devices for more information.
You'll find a section named "remote target" here, which displays a list of all the node processes that are currently running, as well as those that have been executed with the inspect flag. A debugging terminal will open in Chrome when you click on the desired application.
This is how you can use the inspect flag to perform debugging. If you're wanting to catch a few little bugs, this is a fantastic strategy to use.
#5 Take a Look at Postman
The debugging tools we've discussed so far will only function if you're also running your software in the same way that your users would. Building RESTful APIs is a common use case for Node.js. If you're working with APIs and haven't heard of Postman, you're in for a treat.
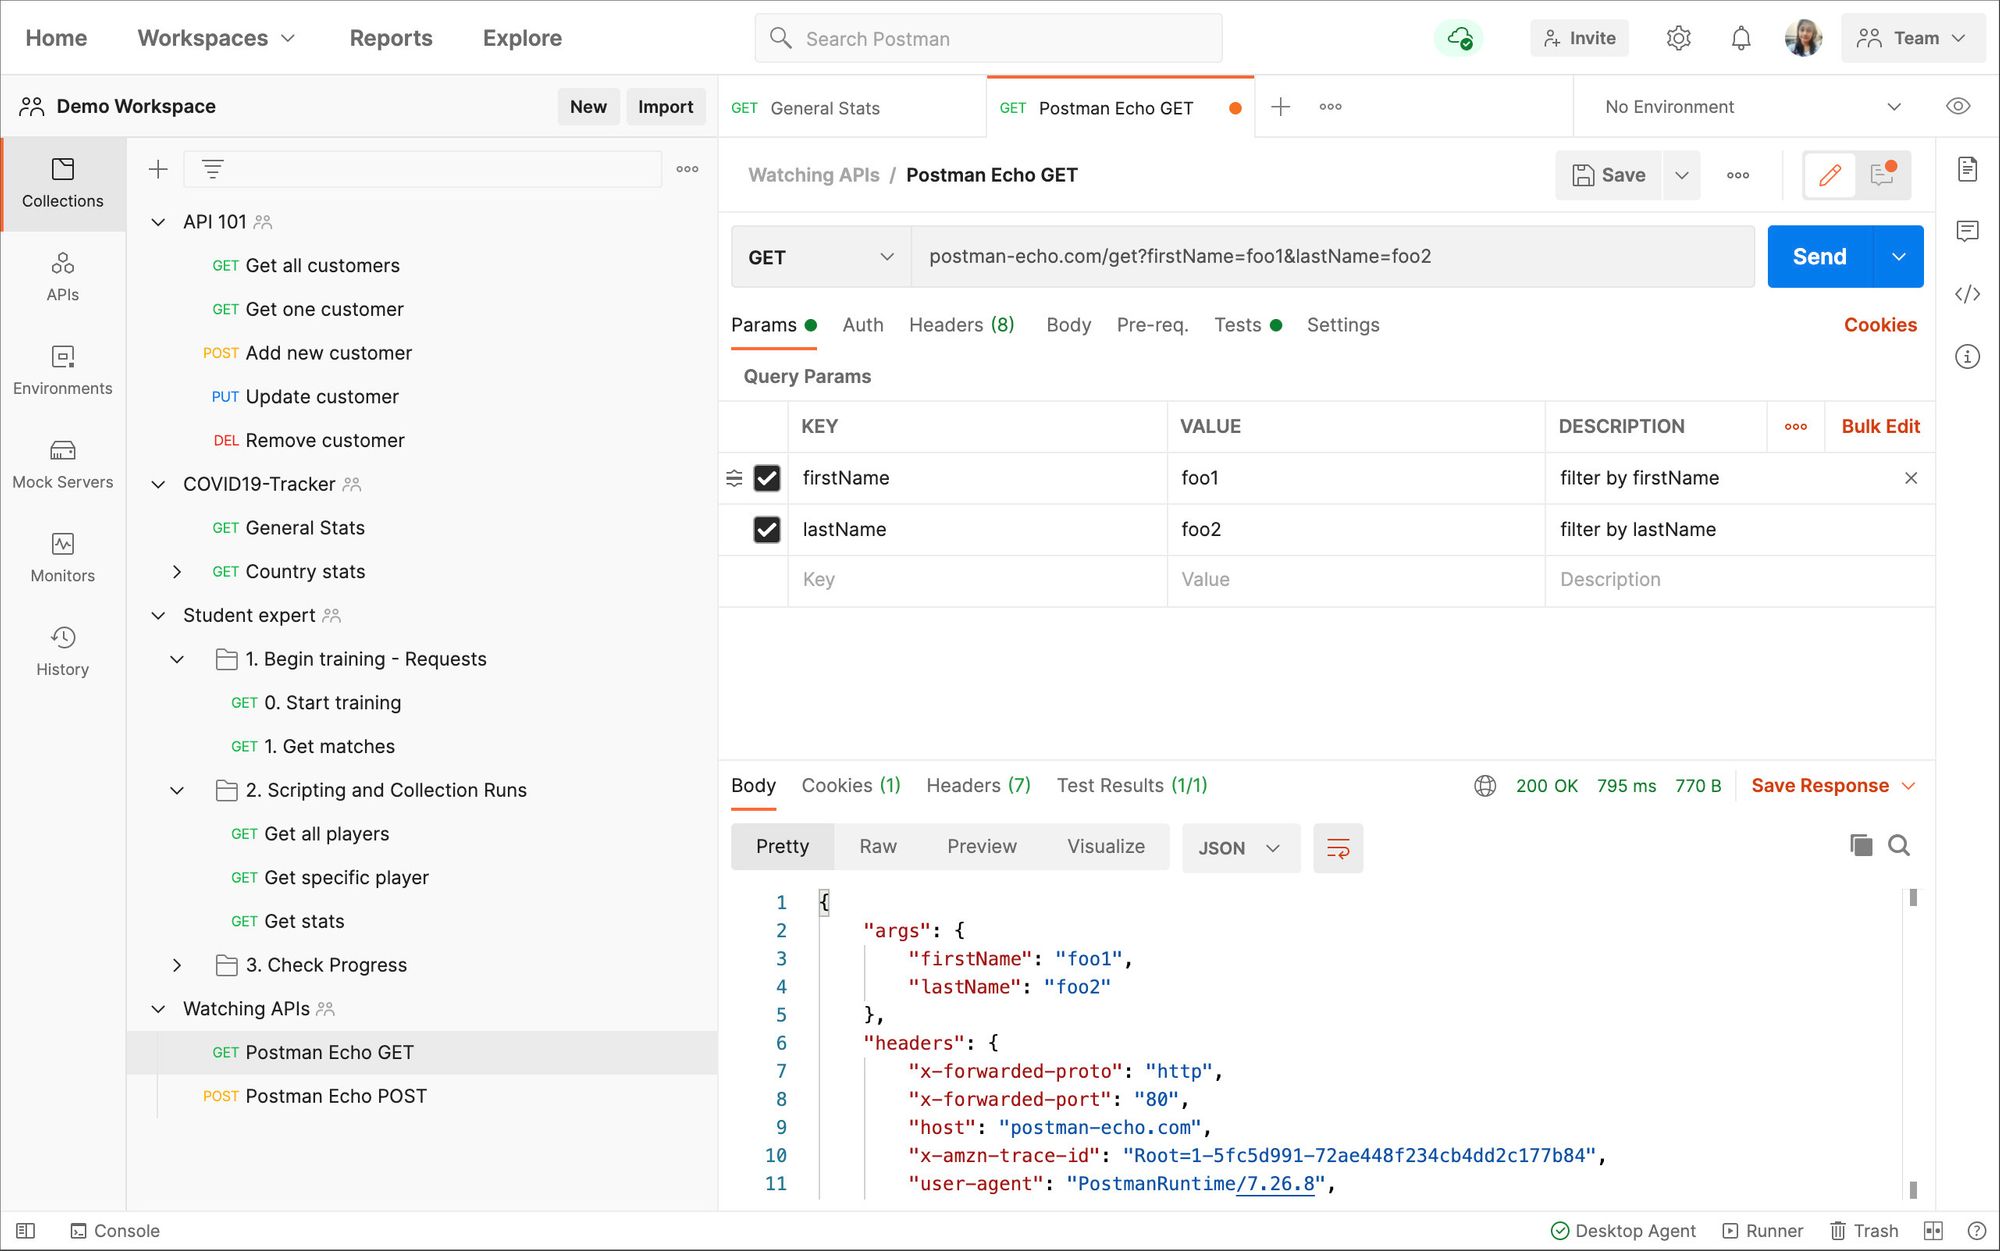
Postman is a tiny application that lets you create, save, and execute API commands. POST requests are more difficult to imitate than GET requests, which may be done by going via the browser. You may create API requests with Postman and send them out with the press of a button.
Postman has lately progressed, gaining the ability to do things like pre- and post-scripting. These scripts allow you to dynamically adjust your requests before sending them (for example, altering a timestamp) or preserve values from your response for use in future requests. Simply said, you can run a series of linked commands and feed the results back. Postman is your holy grail if you're building complex RESTful APIs with Node.js.
#6 Logging/APM Tools
It is critical to attempt to debug an application locally in the same way that it would be debugged in production. Logging on to your remote server to view the console logs, which are remarkably identical to the ones on your local machine, is one of these tools. Although it is a time-consuming method, there are always tools that conduct log aggregation.
These tools collect the logs from a running application and transfer them to a single location. These tools make it simple to parse and view logs. There are also several logging libraries that may be used to format logs and send them to a centralized log aggregator system. Logs can also be used in conjunction with a log level, which is an environment-specific configuration. This is a handy technique.
Another tool for remote debugging in Node.js applications is APM, which stands for Application Performance Monitoring. It gathers stack traces from within the code and transfers them to a central location for analysis.
All of these tools are quite handy while developing Node.js applications. You should consider observing and monitoring your system from the start, before moving on to the core development process. Learning how to visualize your Node.js application is crucial.
#7 Test Performance
Tools for test performance are essential for a developer to learn because certain issues only appear when the system is under a lot of stress.
Artillery is a popular and trustworthy tool for performance testing Node.js. With this tool, a developer can construct a YAML configuration file that specifies the types of performance tests that should be conducted. These tools, such as Artillery, can help you gain a better view of how your system works by triggering specific test cases based on your preferences. This is quite beneficial to the overall debugging process.
#8 Debug in VS Code
If you thought stepping through your code on your browser was cool, you'll love this: some IDEs support the inspect flag, allowing you to do remote debugging without leaving the IDE.
These IDE tools operate in a similar manner as before. You'll need to add an inspector to your node process and then listen to the WebSocket you've constructed for debugging.
Visual Studio Code is the most popular JS IDE, we will show you how to set up debugging in it. If you're more comfortable using WebStorm, you can accomplish the same thing.
To begin, copy and save the following Express application (as app.js):
const express = require('express');
const app = express();
app.get('/', (req, res) => {
    res.send('Hello!!!');
});
app.listen(3000, () => {
    console.info('Example app listening on port 3000!')
});
Then, with the following command, execute your application:
node app.jsAlso, take a look at the results:
Example app listening on port 3000!You'll see that we're not passing the—inspect flag this time (unlike before). You can enable inspect mode for your node process in one of two ways: by supplying the flag from within your IDE or through your IDE.
#9 Make Use of Flame Graphing
Understanding how your functions are executed is useful in JavaScript, and flame graphs are a wonderful method to visualize how your functions are processed.
Your call stack is represented by a flame graph. When one function is run, it may call another, and then another, and so on. At the end of this chain of functions, one will return, which will then return to the next function, which will then return to the function that called it, and so on until the call stack is cleared.
This is beneficial since you'll want to see how your application interacts with your call stack. You might be interested in seeing how long functions run or what other functions they call. This is impossible to achieve with console.log() alone, however, it is possible with a flame graph such as flamebearer.
#10 Debugging Memory Leaks
In every Node.js application, proper memory allocation is critical. A memory leak is a problem with memory allocation that happens when memory is improperly freed up. This might cause a high amount of memory to be consumed by an application, resulting in the application running out of memory and crashing. Global variables, closures, and call-back methods, among other things, can cause memory leaks in JavaScript.
As a result, debugging memory leaks is equally crucial. You may profile your memory usage in the Node.js application and discover memory leaks by using the inspect tag and seeing the memory tab.
#11 Using Debugging Tool
This isn’t a tip but it may useful if you choose to use debugging tools.
The importance of debugging cannot be overstated because numerous errors prohibit entire systems from functioning properly. The complexity of this process is determined by a number of factors, including the system's size, structure, and how it interacts with other systems. As a result, current developers are familiar with and employ a wide range of debugging approaches and tools.
The following is a list of the most popular Node.js debugging tools.
- Debug by Visionmedia
It's a small debugging tool for Node.js. Both libraries and applications will benefit from the technology. Debug by Visionmedia, in addition to Node.js, is also appropriate for use in a browser. - Node Inspector
Based on the Blink Developer Tools — a robust JavaScript debugging interface - Node Inspector is a dependable debugger for Node.js applications. - Atom Node Debugger
It's a simple debugging tool for both Node.js and io.js that's ideal for everyday use. All you have to do now is open your JS file and press F5 to run the start-resume command. - Node Vim Debugger
It is a Node.js debugging client that takes you through the process of debugging in vim. - ironNode
If you're tired of the standard Node.js debugging algorithm's endless process of attaching, file watching, and process restarting, then ironNode is for you. The debugger combines the debugging power of JavaScript with Chrome Developer Tools.
Finally!!!
Following the list may now assist some developers in moving away from console.log(). These are even more effective approaches to troubleshoot and optimize your Node.js applications.
Hopefully, this article has sparked your interest in debugging your Nodejs application and embarking on your path to successful software and application development.
Monitor Your Node.js Application with Atatus
Atatus is an Application Performance Management (APM) solution that collects all requests to your Node.js applications without requiring you to change your source code. However, the tool does more than just keep track of your application's performance.
Atatus' ability to automatically gather all unhandled errors in your Node.js application is one of its best features. To fix Node.js exceptions, gather all necessary information such as class, message, URL, request agent, version, and so on. Every Node.js error is logged and captured with a full stack trace, with the precise line of source code marked, to make bug fixes easy.

All errors are automatically logged and structured in Atatus so that they can be easily viewed. Not only will Atatus show you what errors have happened, but it will also examine where and why they occurred. The logs also display the time and number of occurrences, making it much easier to focus on which issue to address.
#1 Solution for Logs, Traces & Metrics
![]() APM
APM
![]() Kubernetes
Kubernetes
![]() Logs
Logs
![]() Synthetics
Synthetics
![]() RUM
RUM
![]() Serverless
Serverless
![]() Security
Security
![]() More
More


![New Relic vs Splunk - In-depth Comparison [2026]](/blog/content/images/size/w960/2024/10/Datadog-vs-sentry--19-.png)