Best 7 Monitoring Tools for Node.js Applications in 2025
Sometimes, applications do not perform as well as they should. Application developers are responsible for performing preventive and curative maintenance. Customers that use your application as a developer may waste a lot of money attempting to restore the applications without your support. To maintain track of your application's activities, it's best to do a comparison to use an effective monitoring system.
Here we will cover the following:
What is Node.js Monitoring?
Monitoring a JavaScript and Java application entails keeping a careful eye on its performance and availability. Developers accomplish this by identifying and correcting bugs. Node.js application monitoring uses application performance management (APM) tools to look over applications. When it comes to monitoring and optimizing the performance of applications, APM is a must-have tool.
Features of Node.js Monitoring
The following main features of Node.js are largely responsible for its success among software developers:
- Performance
Node.js is built on Chrome's V8 JavaScript Engine, which is famed for its speed, code execution via the Node.js library is speedy and efficient. - Asynchronous and Event-driven
This means that all APIs in the Node.js libraries are non-blocking, which implies that servers do not have to wait for data to be returned from an API. Instead, the next API is called, and a notification system aids in the retrieval of a response from the previous API request. - Zero Buffering
Data is never queued in Node.js applications; instead, it is produced in bulk. - Scalable
Node.js makes servers scalable because it is an event-driven platform that assists the server in sending non-blocking responses. It does not manage requests by limiting threads as standard servers do. - Single-Threaded
As part of its single-threaded approach, Node.js makes use of event looping. This device can handle a higher volume of queries than traditional servers.
Best 7 Tools for Node.js Monitoring
If you're thinking about utilizing Node.js for your project, or if you already use it, you might want to think about making the process easier for you and your team. Performance monitoring, log analysis, and other methods are used by numerous platforms to enhance Node.js. The following Node.js application monitoring tools will help you enhance your workflow.
#1 Atatus
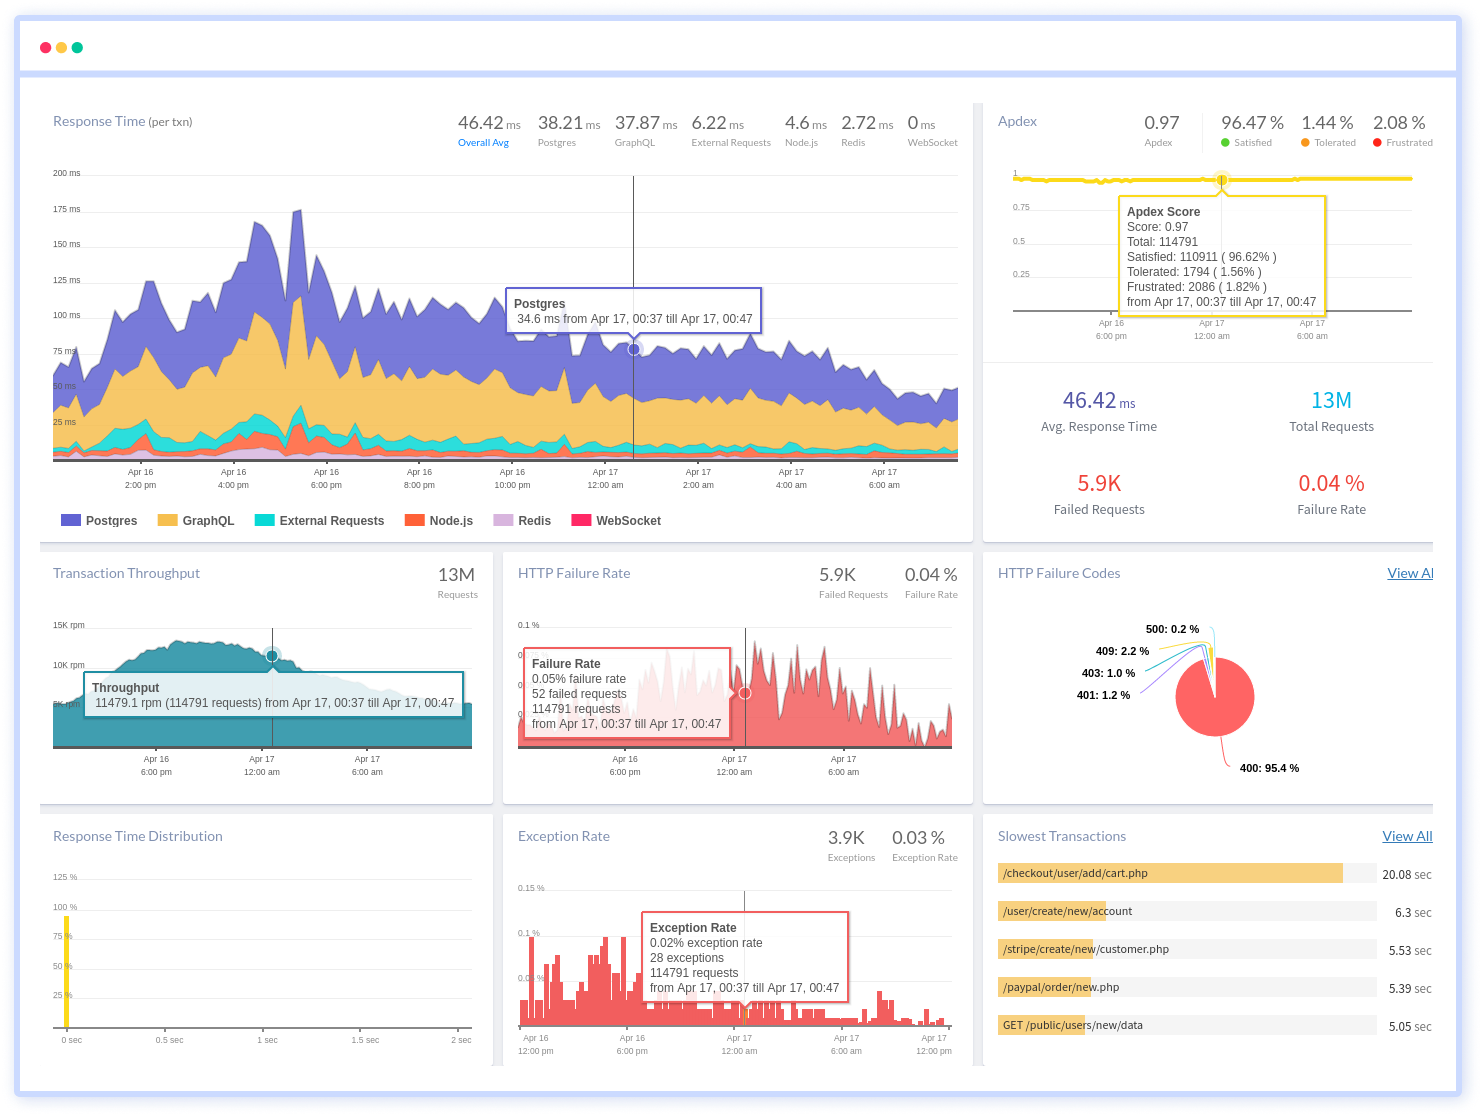
Without needing you to update your source code, Atatus is a lightweight tool that collects all requests to your Node.js applications. Get a good understanding of how your methods, database statements, and external requests affect your endusers' experience. It automates the visualization of end-to-end business transactions in your Node.js application.
Keep track of the number and types of HTTP status code failures and application problems. Also, analyze response time for each and every business transaction to identify Node.js performance bottleneck. Understand how methods and database calls affect the experience of your customers.
To make bug fixing easier, every Node.js error is tracked and captured with a full stack trace with the specific line of source code underlined. You can collect all necessary information such as class, message, URL, request agent, version, and so on to fix the Node.js exceptions.
Features of Atatus:
- Full Transaction Diagnostics
- Performance Analysis
- Root Cause Analysis
- Server Monitoring
- Trace individual transactions
Try a 14-day free trial of Atatus.
#2 PM2
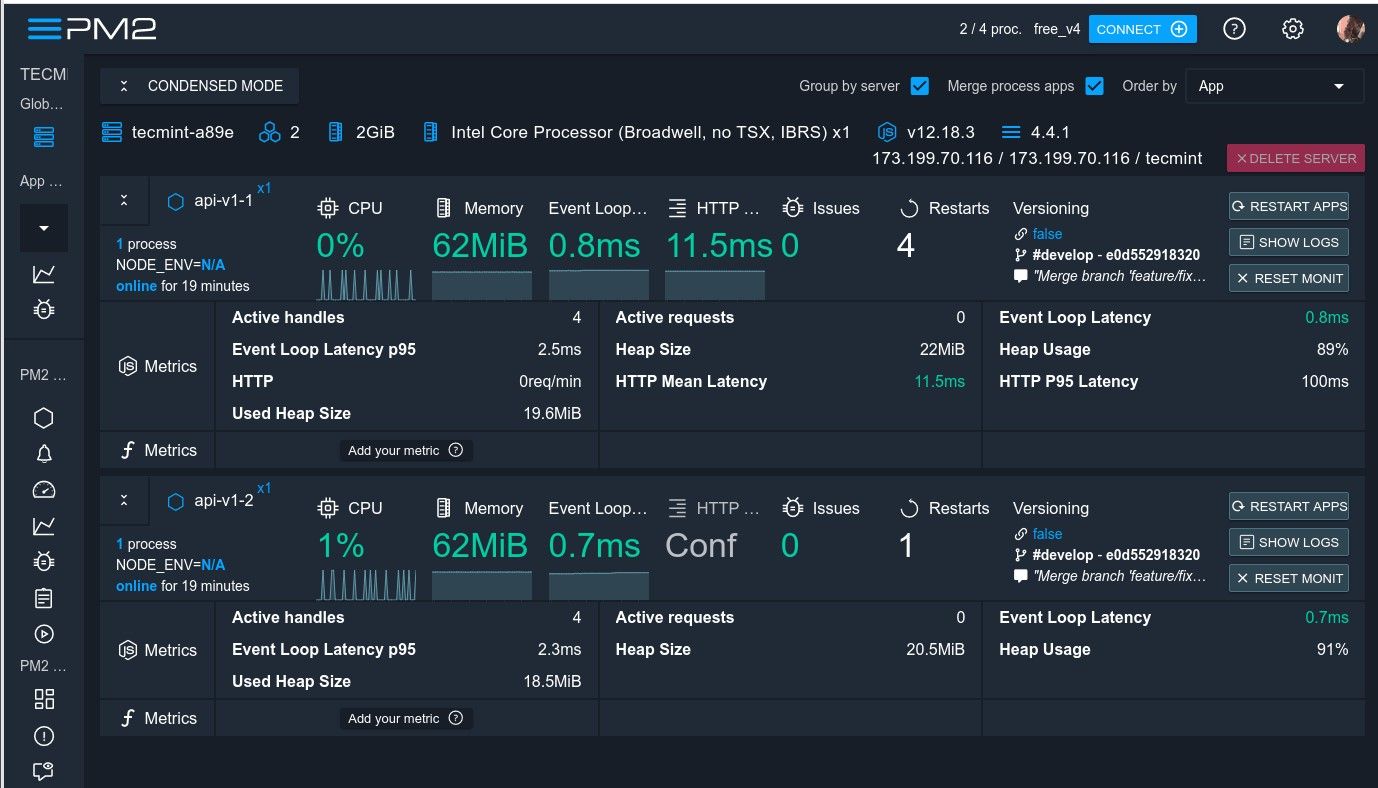
PM2 is a popular Node.js monitoring tool for ensuring that your application is up and operating. It's a simple solution for running and monitoring live production workloads via a web interface or command line.
PM2 is a daemon process manager that allows Node.js developers to manage and maintain their applications while they are online. To get started with this service, developers must first install NPM, which may be done with the npm –version command.
Web interface integration for application health monitoring is one of PM2's best features. Application and error log management, hot-reload, log streaming, and auto-clustering are some of the other features. Most significantly, it aids in the management of multiple Node.js applications.
Features of PM2:
- Log management
- Auto-clustering for Node.js apps
- Container integration
#3 Sematext
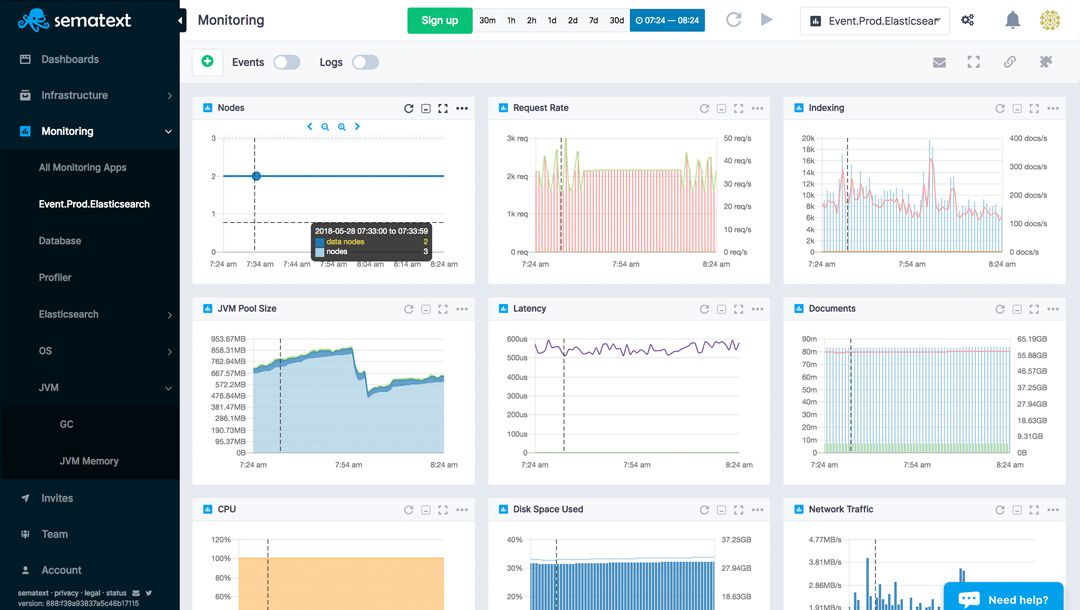
Sematext provides an all-in-one solution for monitoring and analyzing logs. On-premises or in the cloud, it provides full-stack monitoring. Full-stack means you have full visibility into your infrastructure management as well as the availability and performance of your applications.
With NodeJS monitoring, you can track latency, request rate, GC, anomalies, worker, events, heartbeat, and more. You can view the data on a nice pre-built monitoring dashboard or design your own if necessary. Slack, WebHooks, PageDuty, HipChat, and other tools can alert you when something isn't right.
Features of Sematext:
- Application Security
- Bandwidth Monitoring
- Capacity Planning
- Compliance Tracking
#4 App Metrics
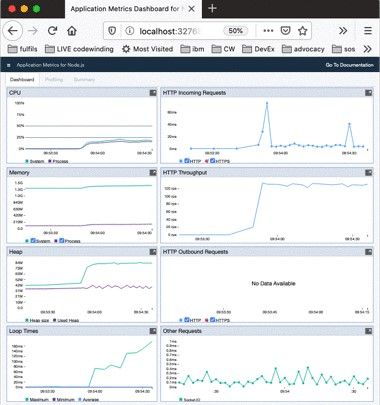
App Metrics provides a great web interface for monitoring application health, using features like AppMetrics-dash. App Metrics is one of the best tools for Node.js performance testing because it can be used as middleware to build a monitoring application.
An application dashboard in App Metrics displays the performance metrics of a running Node.js application. The module is simple to use. It only requires installation and placement at the top of the main Node.js source file.
IBM developed and maintains App Metrics, an open-source initiative. Its primary goal is to provide a framework for outstanding application metrics that can be applied to a variety of jobs. Network speed, data transaction, database query performance, CPU profiling and memory usage, and trash collection are some of these duties.
Features of App Metrics:
- AppMetrics-dash plugin for app monitoring
- A free and open-source tool
- Data transaction
- Network speed
#5 Retrace
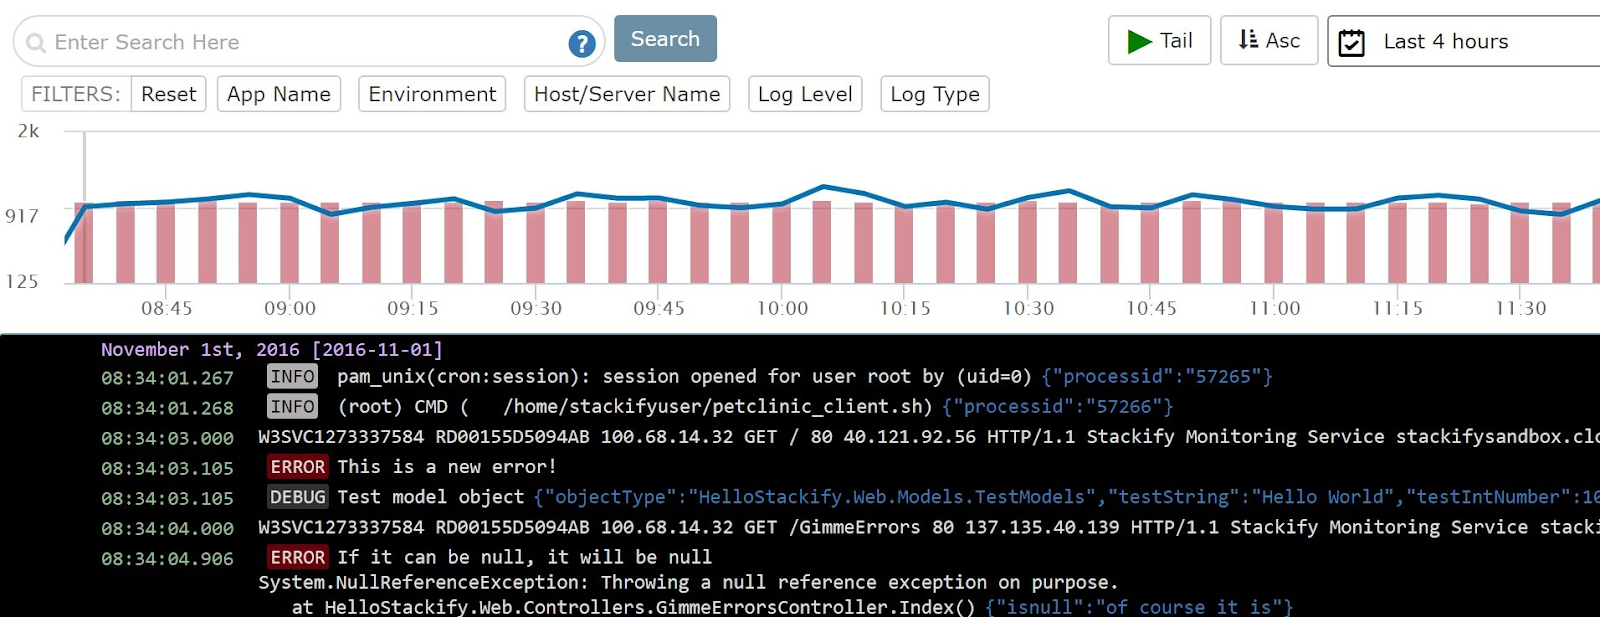
Retrace is a well-known cloud-based solution for monitoring and managing application performance. It also has centralized logs, error and log integration, and basic server metrics in addition to APM. It is used by an enterprise of all sizes to detect difficulties before they affect production and to troubleshoot in crisis mode when production issues do arise.
The development team may track the code's performance in near real-time using Retrace's activity dashboard. Dashboards can also be used to keep track of websites such as shopping carts and login pages.
Retrace was created to give developers more insight into their code's performance in both testing and production contexts. Developers can use Retrace to get APM, centralized logging, code profiling, integrated logs, and errors all in one place. Developers may easily determine the core cause of performance bottleneck due to integrated errors and logs that provide thorough trace views.
Features of Retrace:
- Error and log integration
- Deployments and validates deployment
- Dev-centric insights to quickly fix errors
#6 Express Status Monitor
Express.js is a Node.js framework that allows users to create web applications in a simple way. This tool includes routing tools, which allow web applications to use URLs to preserve web page states, allowing other endusers to access URLs and return to the original page state.
It is completely obvious that ExpressJS is the most widely used web framework in NodeJS. Users can also utilize Express.js to access a templating engine, which creates HTML templates for dynamic content. This operation takes place on the server, which relieves the client of a potentially substantial load.
Response times, request frequency, status code, average overload, and CPU use may all be controlled with Express Status Monitor.
Features of Express Status Monitor:
- Monitor response time
- Request frequency
- Memory & CPU utilization
- Status code
#7 Prometheus
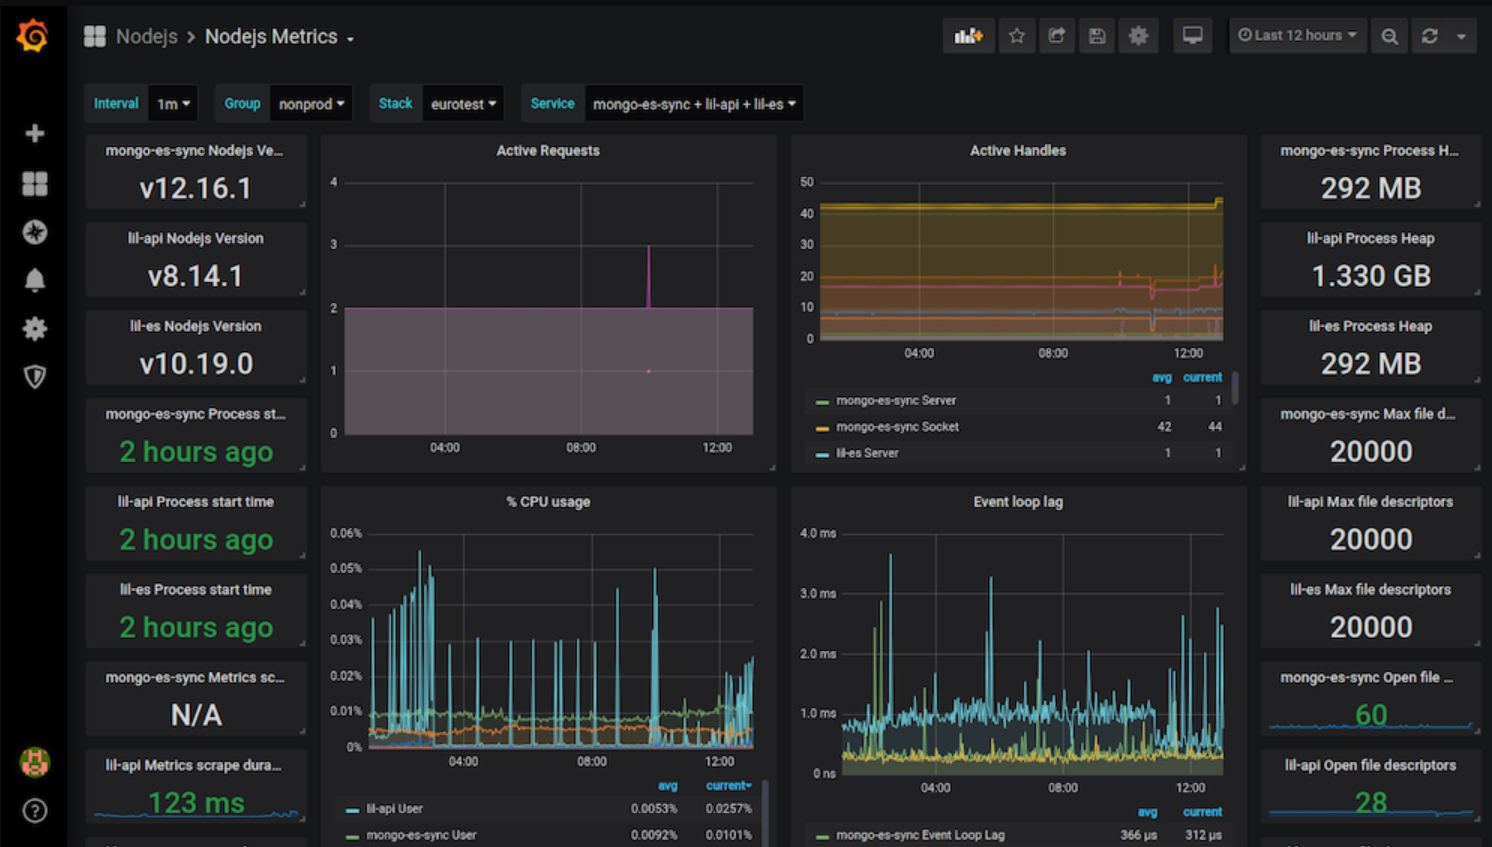
Prometheus is the last Node.js monitoring tool on the list and one of the most well-known open-source applications. It's a performance monitoring and testing tool that's run by the community. All of the components of this tool are available on Github under the Apache 2 License for Node.js developers.
To build a Prometheus-data directory, first, navigate to the root directory of the Node.js application. After that, launch the Prometheus Docker container. You may add the necessary configuration to your Node.js application now that the Prometheus container is functioning.
Features of Prometheus:
- Great visualization
- Many integrations
- Precise alerting
- Many client libraries
- Efficient storage
Conclusion
Monitoring is frequently overlooked, despite its importance in ensuring application availability. Tools that evaluate code, monitor performance, and provide insight into faults are certain to be of considerable use, especially when development costs are a major consideration. They assist you to satisfy SLAs by offering a speedier resolution to the client, saving you time and effort.
Monitor Your Entire Application with Atatus
Atatus Observability Platform lets you review problems as if they happened in your application. Instead of guessing why errors happen or asking users for screenshots and log dumps, Atatus lets you replay the session to quickly understand what went wrong.
We offer Application Performance Monitoring, Real User Monitoring, Serverless Monitoring, Logs Monitoring, Synthetic Monitoring, Uptime Monitoring, and API Analytics. It works perfectly with any application, regardless of framework, and has plugins.

Atatus can be beneficial to your business, which provides a comprehensive view of your application, including how it works, where performance bottlenecks exist, which users are most impacted, and which errors break your code for your frontend, backend, and infrastructure.
If you are not yet an Atatus customer, you can sign up for a 14-day free trial.
#1 Solution for Logs, Traces & Metrics
![]() APM
APM
![]() Kubernetes
Kubernetes
![]() Logs
Logs
![]() Synthetics
Synthetics
![]() RUM
RUM
![]() Serverless
Serverless
![]() Security
Security
![]() More
More


![New Relic vs Splunk - In-depth Comparison [2026]](/blog/content/images/size/w960/2024/10/Datadog-vs-sentry--19-.png)