How Leading Businesses Achieved Greater Uptime with Atatus Monitoring
When every second of downtime can mean lost revenue and frustrated customers, leading businesses can’t afford to leave performance to chance. That’s why leading companies are turning to Application Performance Monitoring (APM) tools like Atatus, a Datadog alternative to keep their applications healthy, detect issues before customers do, and achieve higher uptime than ever.
But how exactly are they doing it? Let’s take a look at how real businesses used Atatus APM and observability features to improve availability, reduce mean time to resolution (MTTR), and gain confidence in every deployment.
Table of Contents:
- Understanding the Technical Challenges of Downtime
- Implementing APM for Full-Stack Visibility
- Detecting Performance Bottlenecks Before Downtime
- Businesses That Improved Uptime with Atatus - Case Studies
- Best Practices for Maximizing Uptime
- Take control of your performance monitoring with Atatus
Understanding the Technical Challenges of Downtime
Even the most reliable systems can experience performance issues that go unnoticed until they affect users. Downtime doesn’t always mean a complete outage. Often, it begins with small performance drops that slow critical operations and impact user experience.
Common causes include:
- Latency Bottlenecks in Microservices: Inefficient APIs, heavy database queries, or network delays in one service can cascade, slowing multiple dependent services.
- Hidden Errors and Failures: Uncaught exceptions or silent service failures can accumulate, degrading user experience without triggering traditional alerts.
- Infrastructure Resource Constraints: CPU, memory, disk I/O, and network saturation often cause performance degradation before full outages occur.
- Limitations of Traditional Monitoring Tools: Logs-only or server-centric monitoring lacks context, making it difficult to link symptoms to root causes.
To truly ensure availability, teams need visibility into what’s happening behind the scenes, where and why the slowdown occurs.
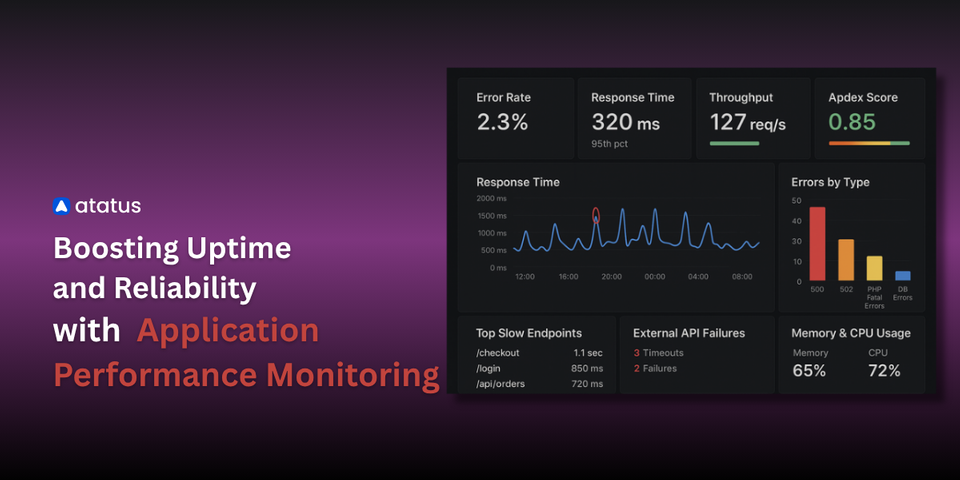
Atatus APM provides that depth of insight. It offers full-stack observability across applications, databases, servers, and real user interactions. With detailed transaction traces and error insights, teams can identify bottlenecks early, improve response times, and maintain consistent uptime for users.
Ready to uncover what’s slowing your app down?
Don’t let hidden issues impact uptime or customer trust. Monitor every layer of your stack — from code to user sessions.
Improve Uptime NowImplementing APM for Full-Stack Visibility
Leading businesses solve these challenges by instrumenting every layer of their application stack with Atatus:
- Instrumenting Services and Endpoints: Every request, transaction, and API call is traced across the system. This provides detailed timing metrics, helping engineers locate which services or queries are causing delays.
- Real User Monitoring (RUM): Atatus captures actual user interactions, including page load times, API response times, and device/geography-specific performance. This ensures teams understand true customer experience, not just backend health.
- Error Tracking and Intelligent Alerting: Automatic detection of errors and anomalies, with customizable thresholds, ensures engineers are alerted before issues impact users.
- Infrastructure Metrics Correlation: CPU, memory, disk I/O, and network latency are correlated with application performance, enabling teams to see which resources are causing slowdowns.
With these capabilities, teams gain end-to-end observability, critical for maintaining uptime in complex, microservice-driven environments.
Discover Why Teams Are Switching : Many teams are migrating from New Relic to Atatus due to its transparent pricing, intuitive setup, and comprehensive support. To understand the reasons behind this shift, explore our detailed blog post: 👉 Why People Are Migrating from New Relic to Atatus
Detecting Performance Bottlenecks Before Downtime
Proactive monitoring is the key to uptime. Atatus enables businesses to:
- Anomaly Detection and Trend Analysis: By tracking historical trends in latency, error rates, and throughput, teams can predict incidents before they occur, rather than reacting after a failure.
- Root Cause Analysis Using Traces and Metrics: For example, a slow SQL query in a database microservice can be traced to the exact request causing delays, reducing mean time to resolution (MTTR).
- Proactive Incident Prevention: Alerts and automated workflows allow teams to resolve potential issues before end-users experience downtime, aligning uptime performance with SLOs and SLAs.
Businesses That Improved Uptime with Atatus - Case Studies
Drezga
Challenge: Drezga’s operations team lacked unified visibility across applications, APIs, and infrastructure, leading to slower response times during incidents.
Solution: By implementing Atatus’s APM, Infrastructure Monitoring, and Uptime Monitoring, they consolidated data across all layers of their system.
Results:
30%
Reduction in cloud resource wastage
2x
API performance assurance
100%
Comprehensive service visibility
- 30% reduction in cloud resource wastage
- Faster deployments and performance validation
- Improved team collaboration between development and operations
"Atatus is no longer just a monitoring tool, it’s part of our product development workflow. We don’t ship without it" — Budimir Skrtic, IT Manager
Iterios
Challenge: The absence of a unified monitoring tool made it difficult to identify and resolve performance bottlenecks, leading to inefficiencies in their operations.
Solution: By integrating Atatus Application Performance Monitoring (APM), Iterios gained comprehensive visibility into their system's performance. Atatus provided real-time monitoring, enabling the team to detect issues promptly and understand the root causes of performance degradation.
"Having everything in one place made monitoring so much easier." - Ivan Romaniuk, Founder & CEO
Result:
- Enhanced System Performance: Real-time insights allowed for proactive performance tuning.
- Faster Issue Resolution: With detailed diagnostics, the team could address problems more efficiently.
- Operational Efficiency: The unified monitoring platform streamlined workflows and reduced downtime.
Best Practices for Maximizing Uptime
Based on real-world implementations, the following strategies help teams use APM effectively:
Define SLOs and SLAs with APM Metrics:
- Use real performance and error metrics from your APM to set realistic Service Level Objectives (SLOs) and Service Level Agreements (SLAs). This ensures monitoring thresholds match your business priorities, helping teams focus on incidents that truly impact users. Track latency percentiles (p95/p99) and error rates per critical endpoint to make SLOs meaningful.
Instrument Critical Services and Endpoints:
- Identify which services and endpoints drive revenue or user engagement, then instrument them for detailed monitoring. Full visibility across your stack allows you to capture performance issues before they cascade into major outages. Use distributed instrumentation so you can trace the entire user journey—from frontend clicks to backend database queries.
Implement Distributed Tracing:
- Connect frontend requests to backend processes to pinpoint where bottlenecks occur. Distributed tracing reveals the root cause of slowdowns, whether it’s a service, a database query, or a third-party API. Focus on tracing high-traffic or critical business flows first to maximize uptime impact.
Set Intelligent Alerts:
- Configure alerts based on behavioral baselines, not just static thresholds. Trigger notifications for unusual error rates, latency spikes, or infrastructure anomalies to allow teams to act before customers notice issues. Combine multiple signals (e.g., CPU spike + slow queries) to reduce alert fatigue and improve actionable insights.
Correlate Metrics Across Layers:
- Don’t analyze application, database, or infrastructure metrics in isolation. Correlate them to identify the true root cause of performance degradation, rather than reacting to symptoms. Use dashboards that overlay metrics across layers, such as request latency vs. database performance vs. CPU usage.
Take control of your performance monitoring with Atatus
Choosing the right APM platform is not just a technical decision, it’s a strategic one. Atatus gives your teams the clarity, speed, and confidence they need to deliver high-performing applications at scale.
With Atatus, you get:
- Proactive Downtime Prevention – Detect performance degradation before it leads to outages with real-time visibility into every transaction.
- Unified View of Application Health – Monitor uptime, latency, and error rates across services, APIs, and dependencies — all from one platform.
- Data-Driven Root Cause Analysis – Quickly trace issues to the exact code, query, or infrastructure layer impacting uptime.
- Smarter Incident Management – Correlate APM metrics with logs and errors to reduce mean time to resolution (MTTR).
- Continuous Reliability Optimization – Track uptime trends, performance SLAs, and release stability to ensure consistent service availability.
#1 Solution for Logs, Traces & Metrics
APM
Kubernetes
Logs
Synthetics
RUM
Serverless
Security
More


