Best Log Monitoring Tools

Log monitoring is a fundamental practice in the system administration and cybersecurity, playing a pivotal role in maintaining the health and security of computer systems. At its core, log monitoring revolves around the scrutiny of log files generated by diverse software applications, operating systems, and servers.
These log files serve as detailed records, containing crucial information about system events, errors, and user activities. The importance of log monitoring lies in its ability to detect issues proactively, ranging from system errors and warnings to identifying potential security breaches and unauthorized access.
Additionally, log monitoring helps in optimizing system performance, adhering to regulatory compliance standards, and facilitating effective troubleshooting. Key components of log monitoring include the collection of log data, thorough analysis, alerting mechanisms, and visualization tools to interpret large volumes of data comprehensively.
In this blog, we'll talk about some log monitoring tools and what makes each of them stand out. We'll go over their main features, making it easier for you to pick the right tool for your needs.
1. Atatus
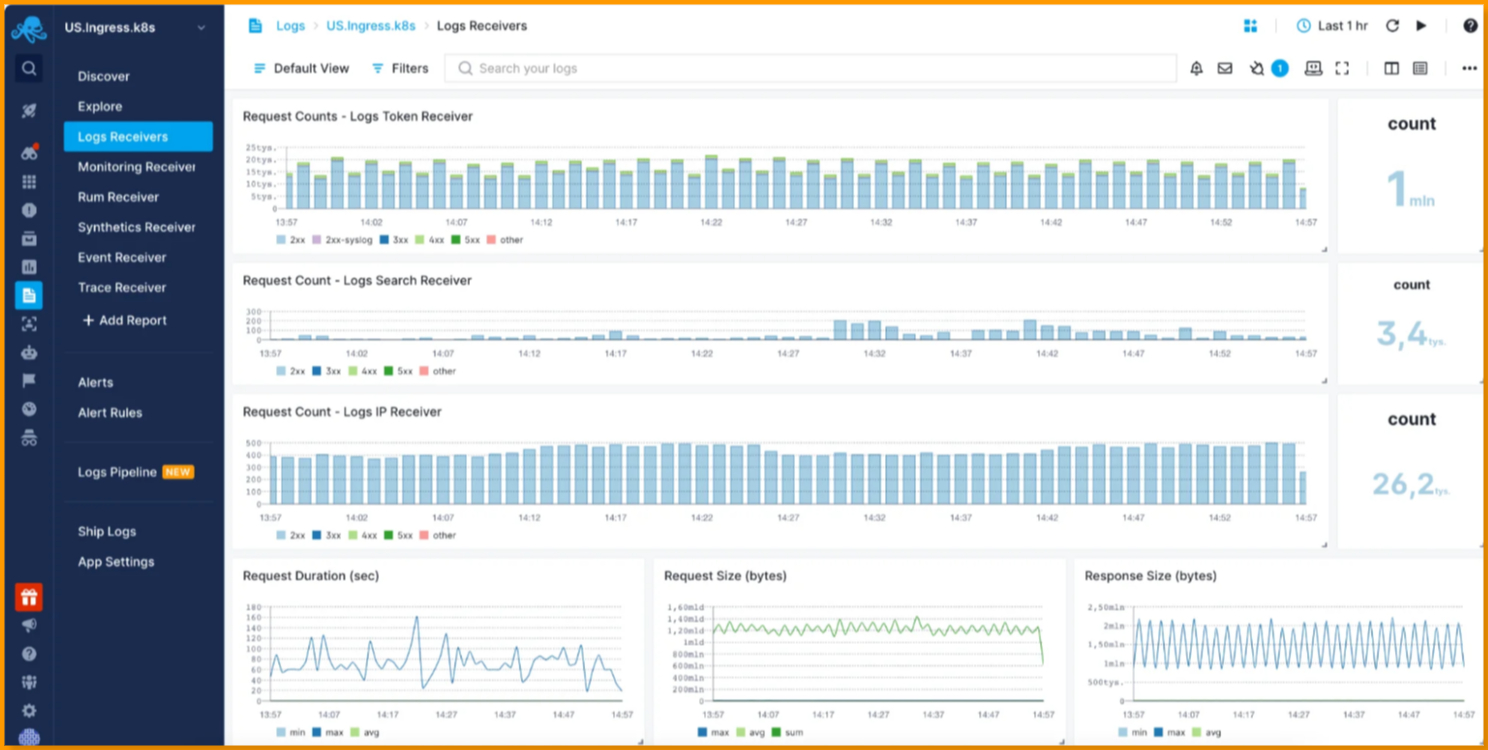
With Atatus, a centralized logging tool, you can effortlessly gain complete visibility into your intricate architecture. This cost-effective and scalable approach empowers you to process logs, generate metrics, and visualize log data seamlessly, all from a unified platform.
Atatus offers a unified logs monitoring and observability solution that seamlessly integrates across various platforms, providing comprehensive tracking and analysis of system activities and performance.
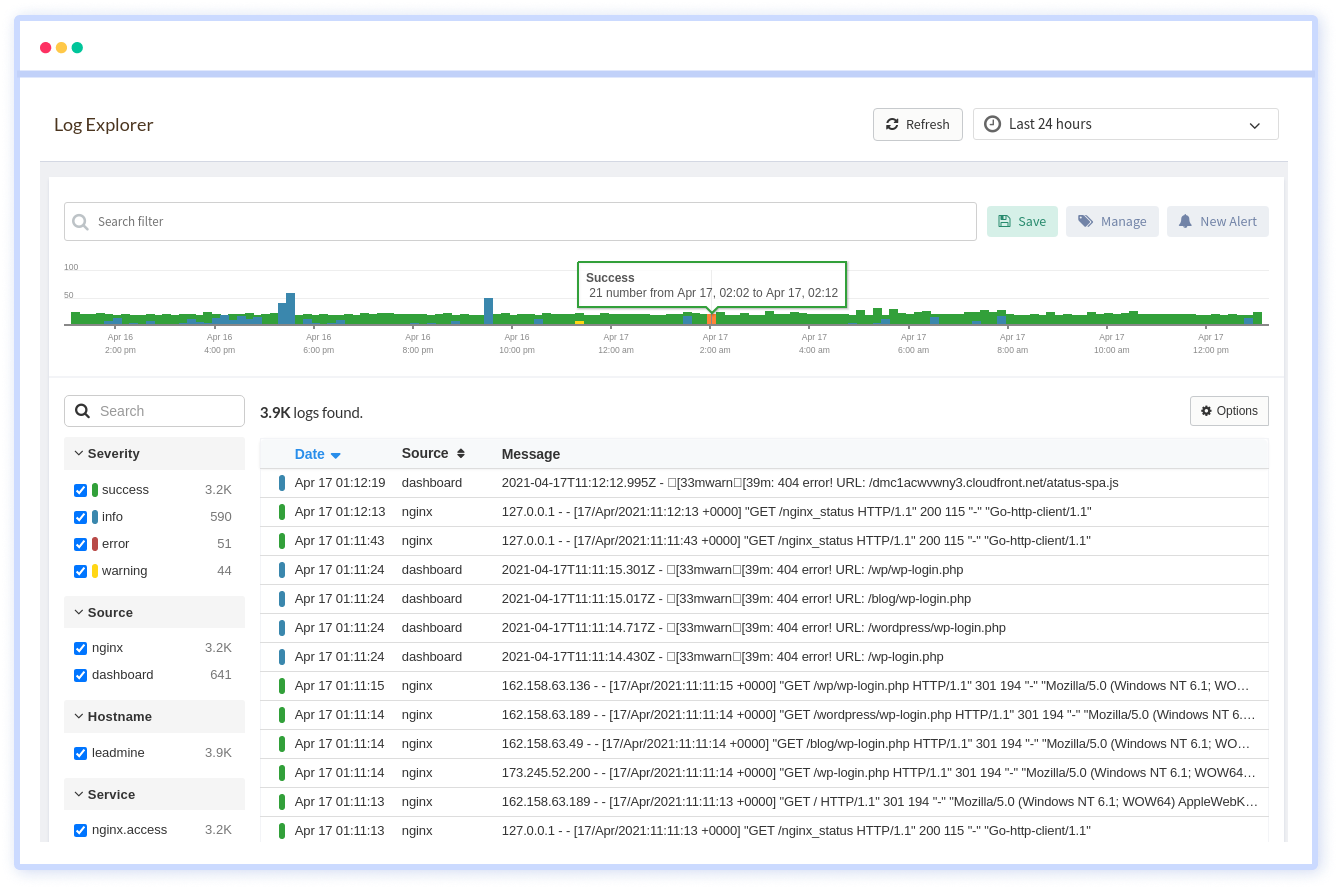
Atatus log monitoring tool transforms troubleshooting in the production environment. Search, filter, and analyse logs on the fly as they come in, utilizing a user-friendly interface reminiscent of "tail -f" across systems. Atatus enhances your troubleshooting capabilities by seamlessly correlating log events with APM slow traces and errors, providing deeper insights for faster issue resolution.
Navigate through log events effortlessly with intuitive filters such as hostname, service, source, messages, and more. Atatus allows you to focus on critical events that matter, cutting through the noise. Take control of log message retention and optimize storage costs by moving older logs to cost-effective storage tiers, ensuring you only pay for the logs you access frequently.
Key Features
- Centralized logging.
- Correlate logs with APM Traces & Errors.
- Complete log events in a Single View.
- Log parsing, log pipelines and grouping.
- Store logs for longer periods of time.
- Immediate notification of high-priority incidents through advanced configurations.
2. Papertrail
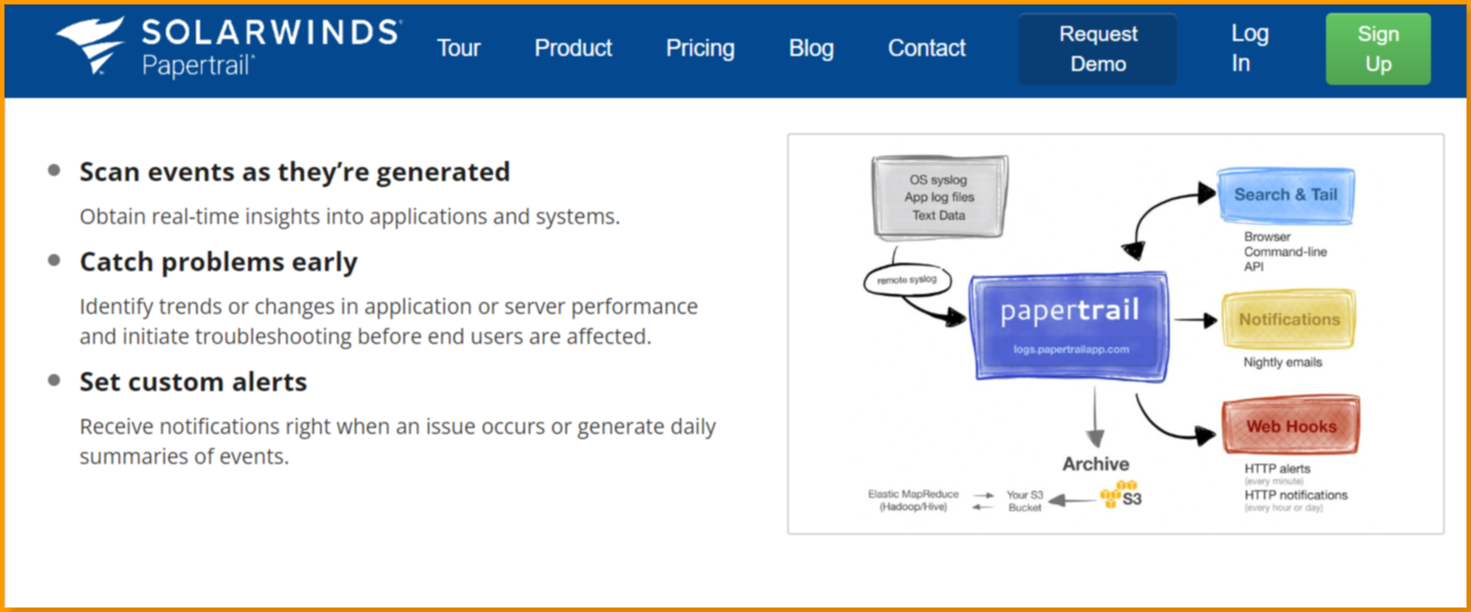
SolarWinds Papertrail provides real-time visibility for log monitoring, allowing users to monitor and search log messages across their IT infrastructure through a user-friendly interface. The tool offers insights into events from systems, applications, servers, etc., enabling efficient transformation of raw data into actionable information.
Key features:
- Real-time Visibility - Monitor and search log messages in real-time for quick insights.
- Easy-to-Use Interface - Single, intuitive interface for improved interpretation of log data.
- Tail and Scroll - View and scroll through event logs as they are generated.
- Advanced Search and Filtering - Query logs by date, IP address, hostname, service name, etc., with customizable metrics.
- Alerts and Integration - Built-in alerts for potential issues with customizable settings, supporting integration with popular communication channels like Slack and PagerDuty.
3. Sematext
Sematext's log monitoring solution revolutionizes IT infrastructure management by offering a unified platform for collecting, analyzing, and correlating data from diverse sources. With automated logs discovery, users can effortlessly collect data from various services with a simple click, streamlining the entire process. Compatibility with Syslog and Elasticsearch log shippers facilitates seamless data transmission to Sematext Cloud.
This real-time log monitoring solution stands out with its intuitive interface, providing a distraction-free experience through features like live tail and full-screen mode. Users can create prioritized alerts based on anomalies or thresholds, ensuring timely issue resolution. The platform's powerful search and filter capabilities enable users to efficiently pinpoint log events and conduct root cause analysis.
Key Features:
- Automated Logs Discovery - Effortlessly collect data from various services with a click.
- Pipelines for Log Structure Management - Intuitively extract meaningful data, set alerts, and filter irrelevant information.
- Real-time Log Monitoring - Monitor logs without disruptions via an intuitive interface.
- Rich Dashboards - Develop comprehensive dashboards with visual components for system-wide visibility.
- Alerts and Prioritization - Create alerts based on anomalies or thresholds, with customizable priority levels.
- Scheduled Reports - Receive key performance indicator charts directly to your mailbox with automated reports.
4. Datadog
Datadog's Log Management solution revolutionizes troubleshooting and analytics by eliminating the need for complex querying. Users can seamlessly search, filter, and analyse logs with interactive dashboards, drag-and-drop visualizations, and intelligent Log Patterns.
Watchdog Insights automates the identification of Log Anomalies for time-sensitive issues. The platform supports over 200 technologies with out-of-the-box log processing pipelines, ensuring structured datasets from diverse log sources.
Custom reference data enriches logs for actionable insights, while Log Forwarding centralizes routing to third-party destinations. Flex Logs allows flexible ingestion, Live Tail, and Live Search, with the ability to decide retention periods.
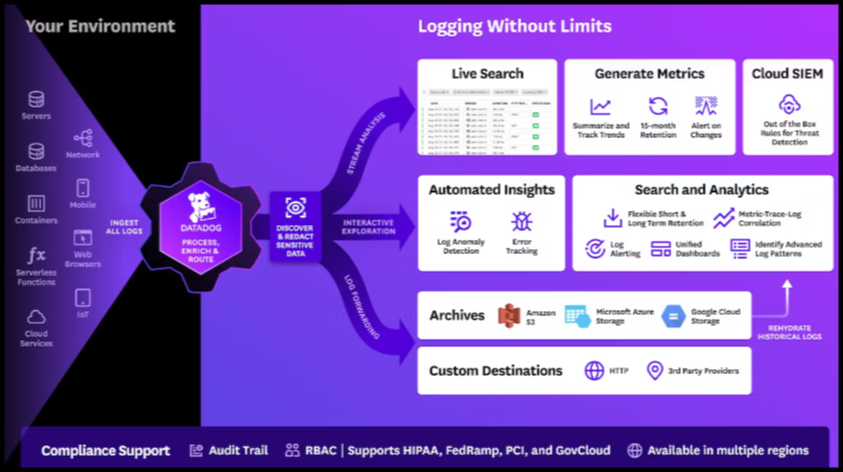
Log Explorer enables simple or complex queries, correlating seamlessly with full context, and integrates with APM traces and security signals. With granular RBAC controls, Datadog ensures secure log data access, and its scalability supports millions of logs per minute or petabytes per month, complying with PCI and HIPAA standards.
Key Features:
- User-Friendly Interface
- Automated Anomaly Detection
- Out-of-the-Box Log Processing
- Flexible Log Storage
- Integrated Correlation and Navigation
5. Better Stack
Better Stack is a robust tool designed to streamline the management and analysis of logs, which are essentially records of events in your computer systems. This tool allows you to search and filter through vast amounts of log data.
It operates efficiently with ClickHouse and a custom data pipeline, swiftly handling massive log volumes and alerting you to any unusual activities, serving as a vigilant guardian for your system. Not only it is quick, but Better Stack also contributes to cost savings by optimizing log management processes.
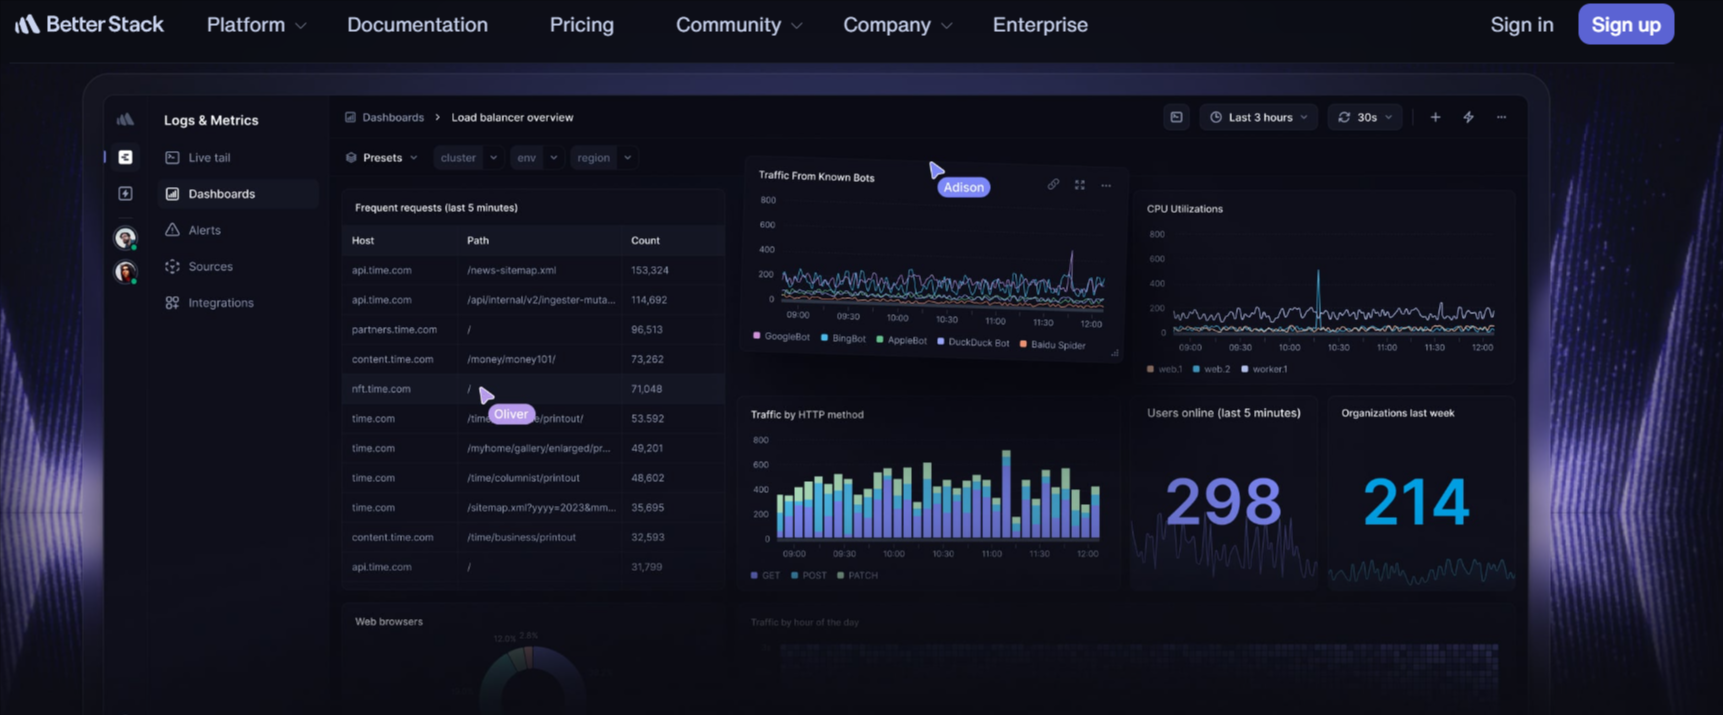
Compatibility is a key strength, as it seamlessly integrates with popular tech stacks like Kubernetes, Heroku, Logstash, Rails, Docker, and AWS. The collected data is sent to Grafana for intuitive visualization, transforming raw data into easy-to-understand charts and graphs.
The user interface is well-designed and offers a dark mode for comfortable usage, especially during late-night troubleshooting sessions. Beyond log management, Better Stack fosters collaboration among team members, providing a collaborative space of Google Docs for coding.
6. Dynatrace
Dynatrace seamlessly integrates Log Monitoring into its platform, providing a comprehensive suite of features to enhance troubleshooting and contextual understanding of logs.
With the ability to create custom log metrics, users can streamline their troubleshooting processes, ensuring smarter and faster problem resolution. The Log Management solution offered by Dynatrace extends beyond analysis, incorporating robust alerting functionalities. This allows users to stay informed about critical events in their log data.
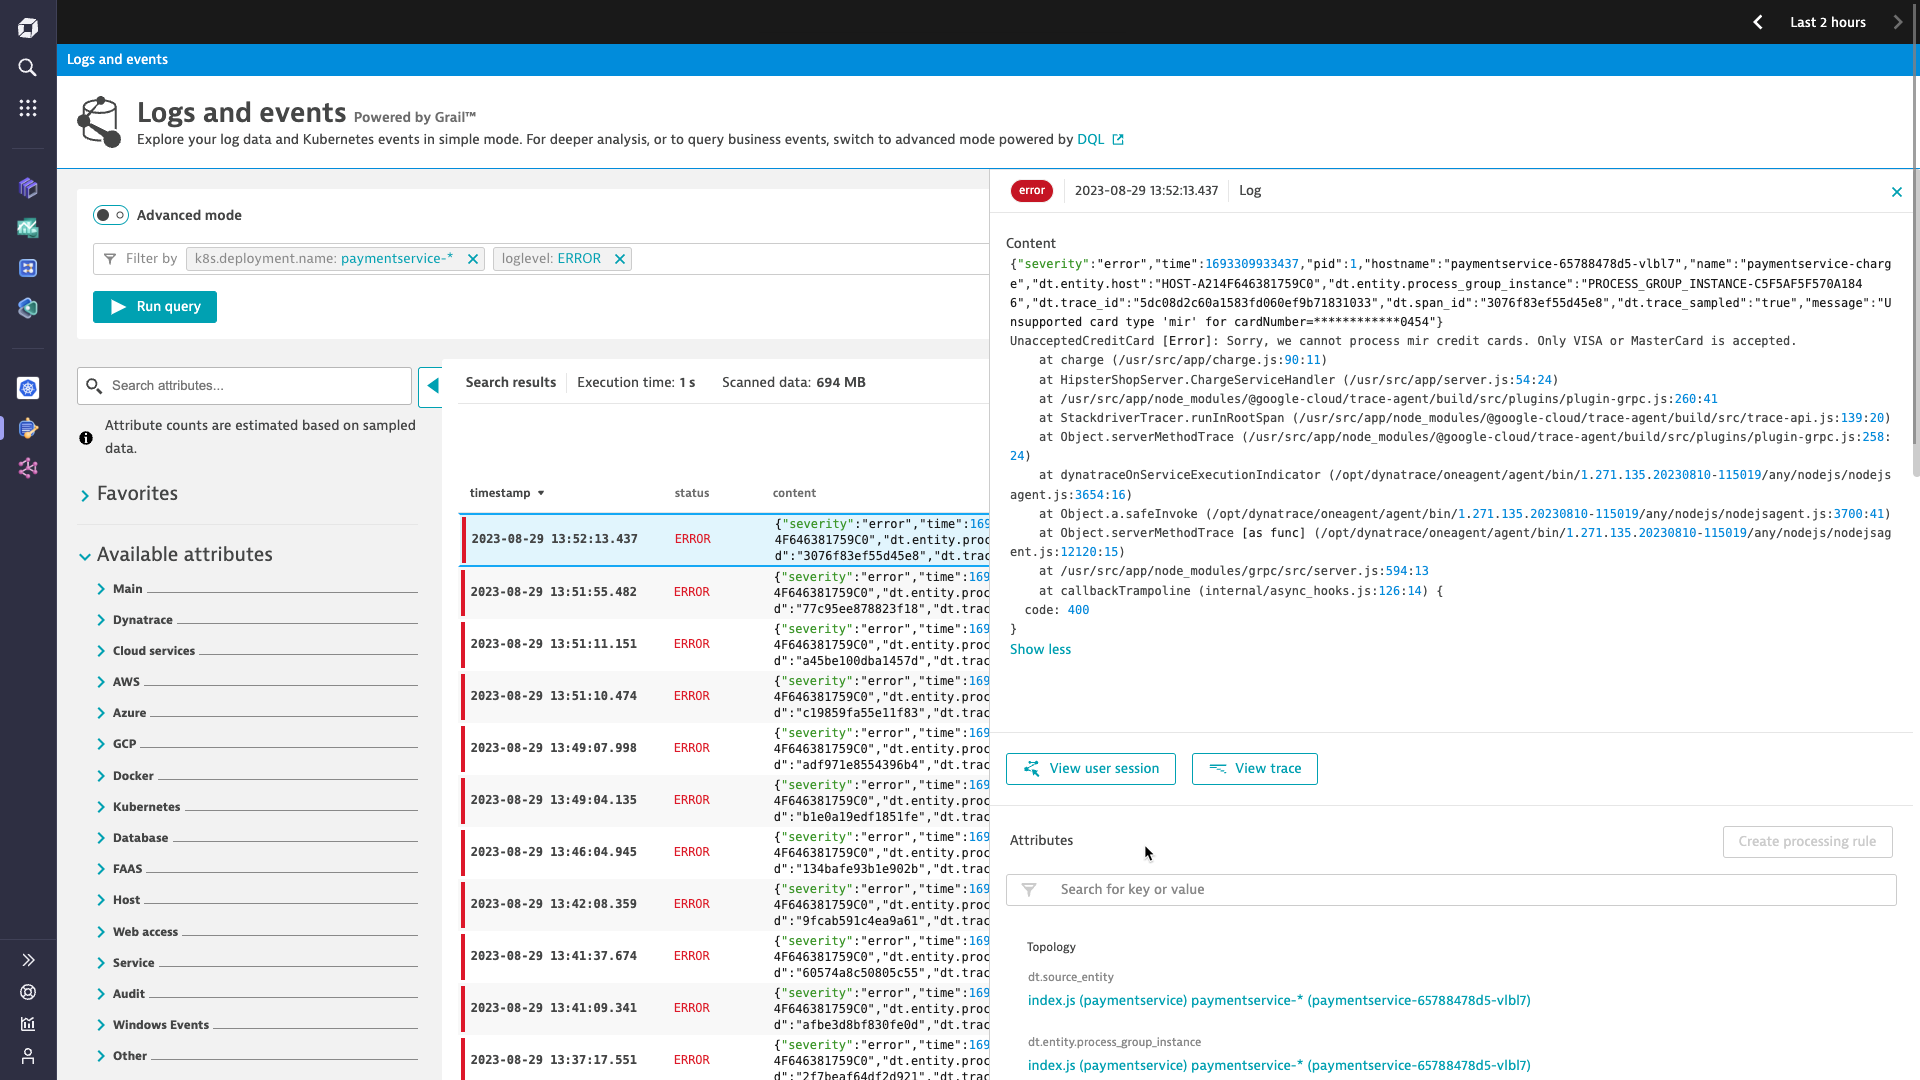
Dynatrace's capabilities span across various facets of production, enabling users to analyse log events seamlessly across different components and extended timeframes. The platform's AI-assisted full-stack monitoring solution boasts support for over 560 technologies, offering a versatile toolkit for monitoring diverse tech stacks.
Beyond Log Monitoring, Dynatrace provides solutions that address a spectrum of needs, including security, Digital Experience, and Business Analytics. This comprehensive approach underscores Dynatrace's commitment to delivering an all-encompassing platform for efficient and effective system monitoring.
7. Splunk
Splunk's Log Observer is a specialized tool crafted for DevOps teams, aiming to simplify the monitoring of logs. With a user-friendly interface, Splunk allows for easy investigation of logs, providing a point-and-click system for filtering, sorting, and exploring data based on your specific needs. The Live Tail feature enables real-time observation and filtering of logs.
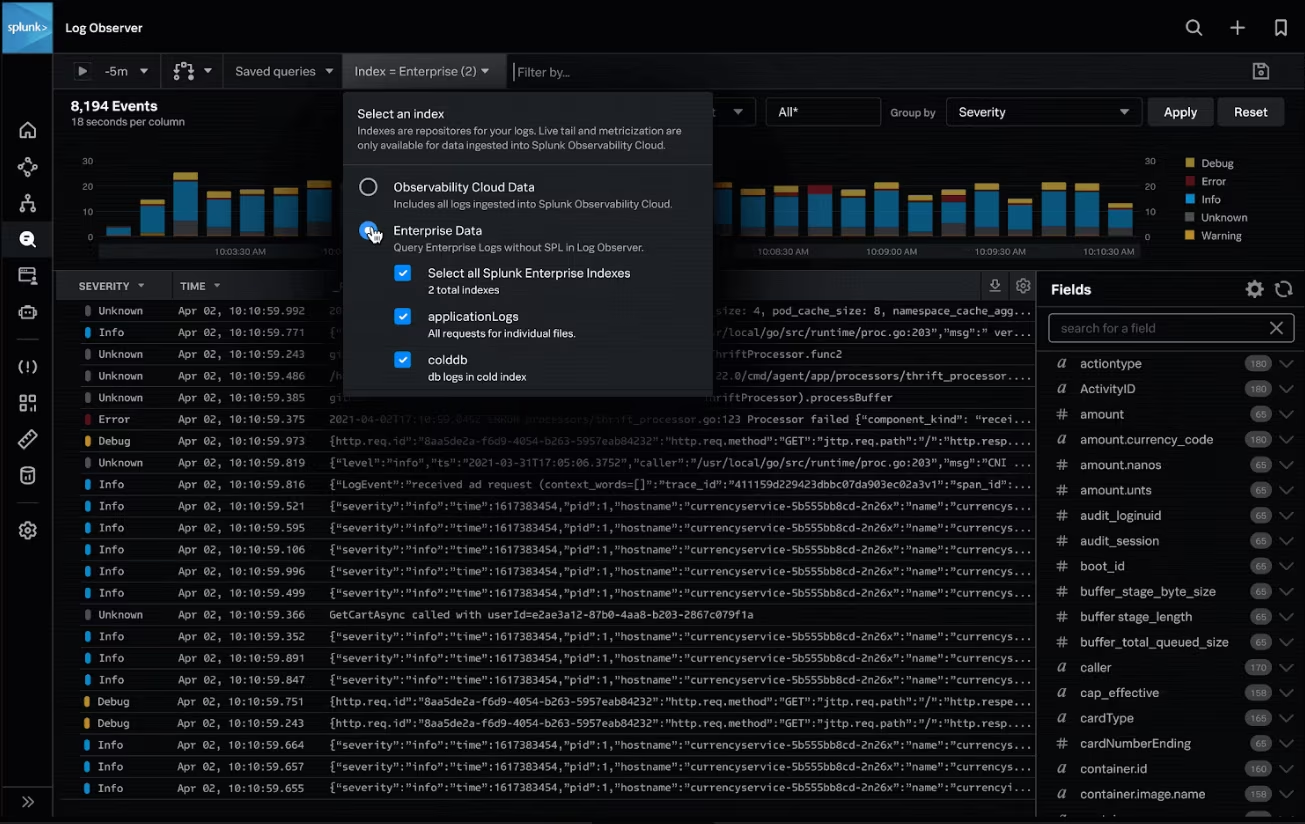
Log Observer is just one part of Splunk's Observability Platform, which encompasses Splunk Infrastructure Monitoring, Real User Monitoring (RUM), Application Performance Monitoring (APM), and On-Call features.
Splunk is an enterprise-grade solution, with its pricing reflecting its robust capabilities. Log Observer can be billed based on the amount of data indexed or ingested. Overall, Splunk is a handy tool that helps businesses keep their computer systems running smoothly.
Key Features:
- Real-Time Observation with Live Tail
- Enterprise-focused solution
8. LogicMonitor
LogicMonitor log monitoring tool is a cloud-based tool that helps monitor and keep track of the health and performance of your IT infrastructure. While it's well-known for overseeing things like servers and applications, it also has a feature for monitoring logs.
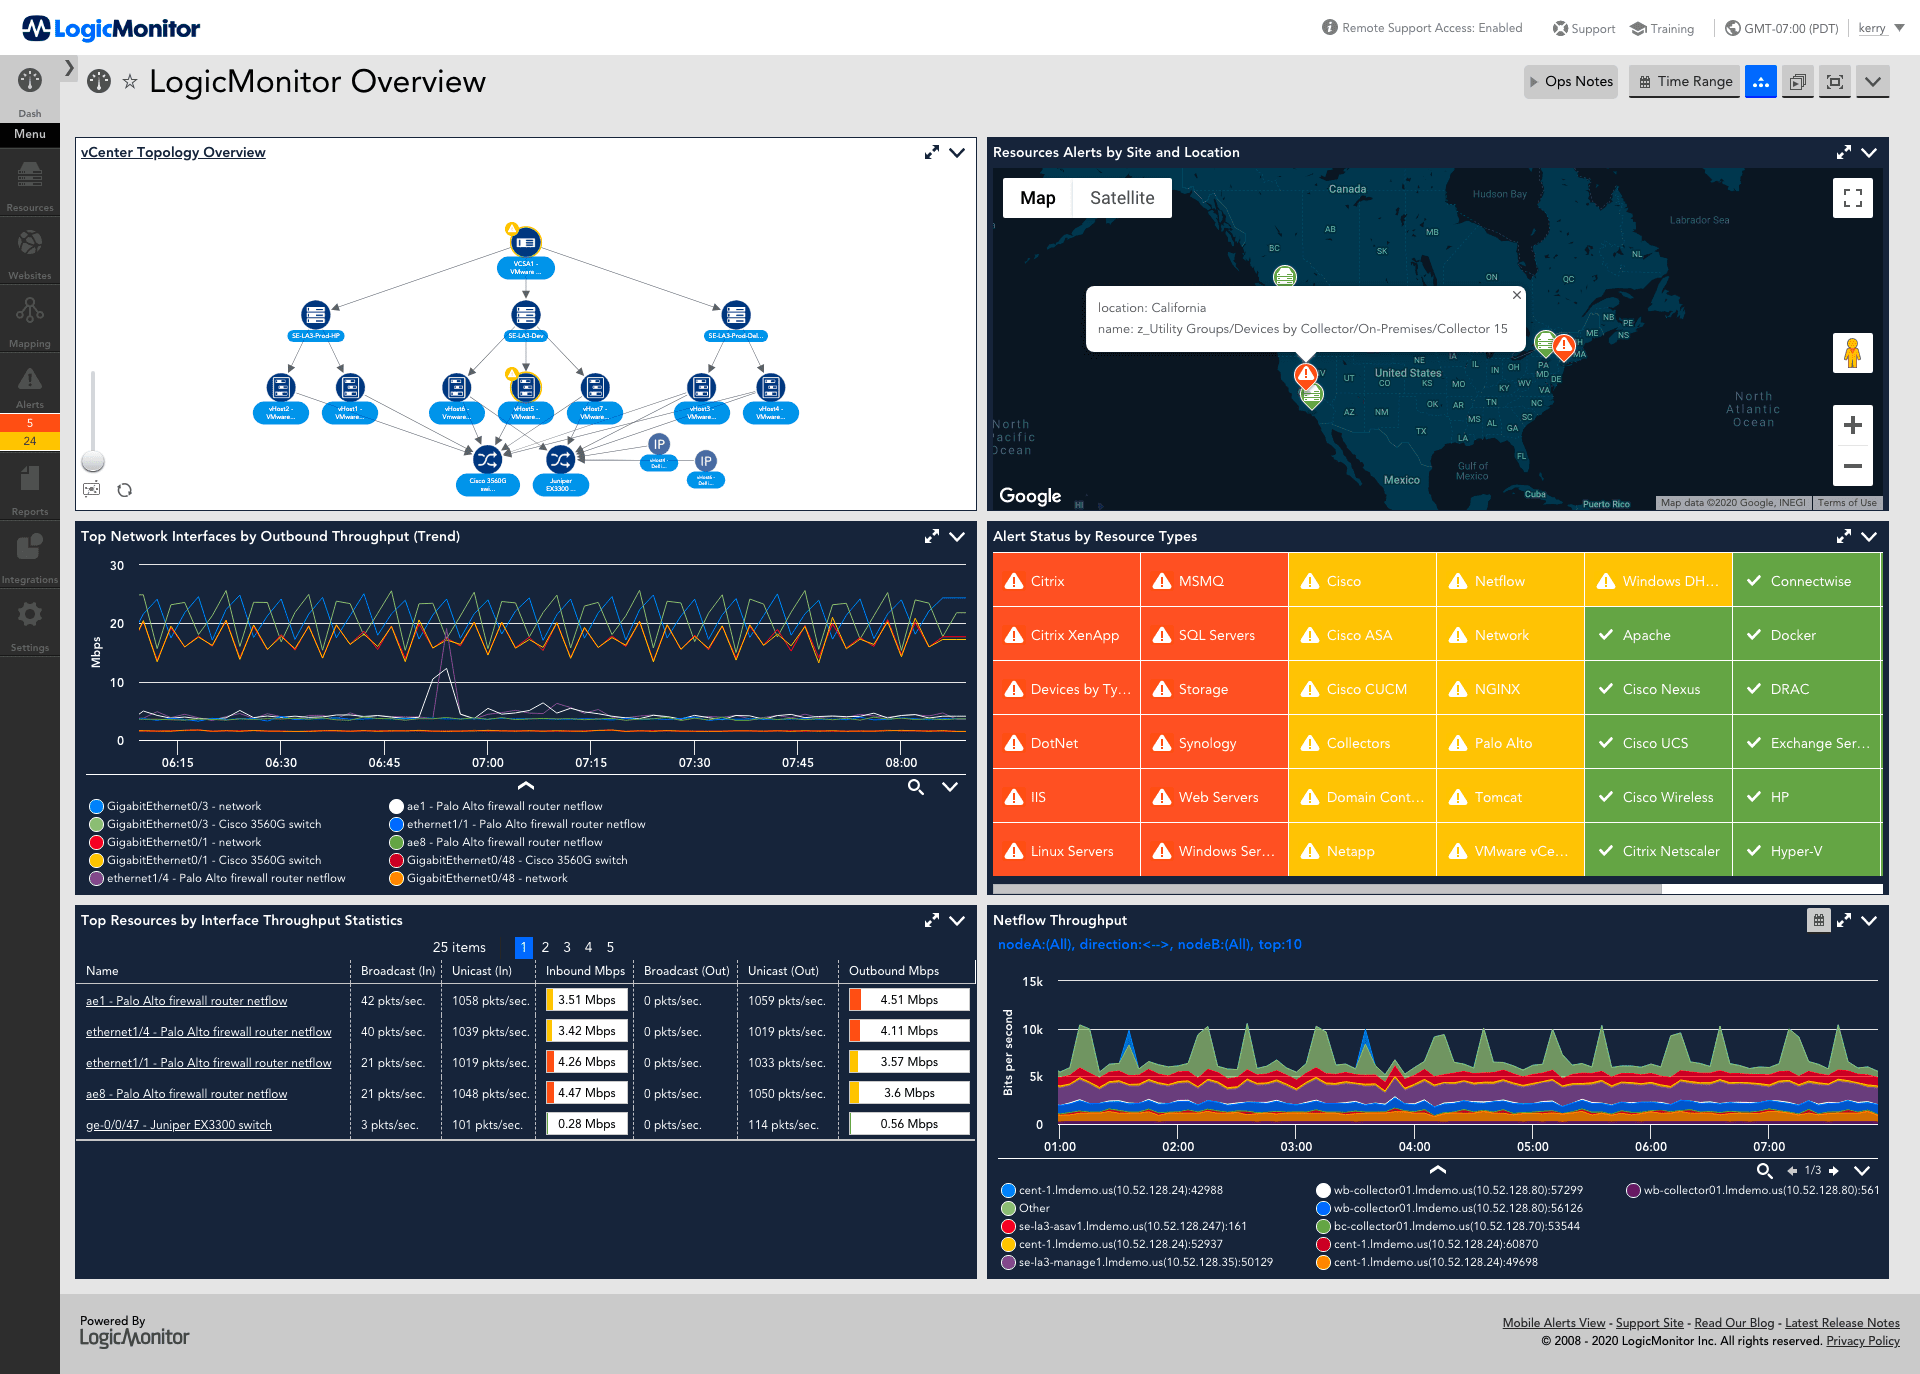
Logs are like records that systems keep of their activities, and LogicMonitor can gather these logs from different sources, such as servers and applications. Once collected, LogicMonitor helps make sense of this information by providing tools to search, filter, and analyze the logs.
This can be useful for finding patterns, spotting problems, or identifying unusual activities. Additionally, LogicMonitor can alert you if it detects something important in the logs, making it easier for you to stay on top of potential issues.
Key Features:
- Customizable dashboards for visualizing and analyzing performance metrics.
- Supports cloud infrastructure monitoring and integrates with third-party tools.
Conclusion
Log monitoring is a vital practice for maintaining computer system health and security. Log files, detailed records of system events and activities, serve as the foundation for proactively detecting issues and optimizing performance.
Key log monitoring tools like Atatus, Papertrail, Sematext, Datadog, Better Stack, Dynatrace, and Splunk offer unique features, from centralized logging to real-time visibility and automated logs discovery. Choosing the right tool depends on specific needs and preferences.
Atatus provides a scalable solution, Papertrail emphasizes real-time visibility, Sematext excels in automated logs discovery, Datadog offers user-friendly log management, Better Stack integrates seamlessly with popular tech stacks, Dynatrace provides a comprehensive suite, and Splunk's Log Observer simplifies log monitoring with a user-friendly interface.
Ultimately, log monitoring tools play a crucial role in ensuring the efficiency, security, and compliance of computer systems.
Atatus Logs Monitoring and Management
Atatus offers a Logs Monitoring solution which is delivered as a fully managed cloud service with minimal setup at any scale that requires no maintenance. It monitors logs from all of your systems and applications into a centralized and easy-to-navigate user interface, allowing you to troubleshoot faster.

We give a cost-effective, scalable method to centralized logging, so you can obtain total insight across your complex architecture. To cut through the noise and focus on the key events that matter, you can search the logs by hostname, service, source, messages, and more. When you can correlate log events with APM slow traces and errors, troubleshooting becomes easy.
#1 Solution for Logs, Traces & Metrics
![]() APM
APM
![]() Kubernetes
Kubernetes
![]() Logs
Logs
![]() Synthetics
Synthetics
![]() RUM
RUM
![]() Serverless
Serverless
![]() Security
Security
![]() More
More