Getting Resource Metrics in Kubernetes: A Comprehensive Guide to kubectl top

In Kubernetes management, the ability to efficiently monitor resource utilization is very important for cluster owners.
Have you ever heard about the kubectl top command and wondered how it could revolutionize your Kubernetes management experience? If so, you're in the right place.
The kubectl top command – a powerful tool that offers snapshots of resource metrics for pods and nodes within a Kubernetes cluster. This command provides invaluable insights into CPU, memory, and storage usage, enabling cluster administrators to optimize performance and ensure seamless operation.
In this article, we'll explore how to use the kubectl top command effectively, decode its output, and understand its capabilities to maintain a good cluster performance.
Let's dive in and understand the potential of Kubernetes resource monitoring with kubectl top.
Table of Contents
- What is a Pod?
- What is a Node?
- Understanding kubectl - An Introduction
- kubectl Command
- kubectl top Command
- Understanding Kubernetes Resource Monitoring
- kubectl top Pod Command
- kubectl top Node Command
What is a Pod?
In Kubernetes, a pod is the smallest unit of deployment, representing a single instance of a running process in the cluster, typically encapsulating one or more containers.
Pods serve as the basic building blocks for managing applications in Kubernetes, providing a layer of abstraction that simplifies deployment and scaling while enhancing flexibility and efficiency.

- Pods hold pieces of software called containers, making it easier to handle them together.
- Pods can duplicate and spread out to handle more work, making sure everything runs smoothly without wasting resources.
What is a Node?
A node refers to a single machine in a cluster. Nodes can be physical or virtual machines, and they serve as the worker units where containers are deployed and executed.

Each node has its own resources such as CPU, memory, and storage, and it runs the necessary Kubernetes components to manage containers, such as the Kubelet, which communicates with the master node and manages the containers on the node.
Nodes work together to form the underlying infrastructure for running applications orchestrated by Kubernetes.
Understanding kubectl - An Introduction
Kubectl is a command-line tool used to interact with Kubernetes clusters. Kubectl tool enables you to manage your Kubernetes cluster for your everyday tasks and operations.
A Kubernetes cluster is a set of machines, called nodes, that collectively run containerized applications managed by Kubernetes.
With kubectl, you can issue commands to Kubernetes to create, inspect, update, and delete resources like pods (a group of one or more containers), services, deployments, and more.
Kubectl enable automation of routine operations, ensuring consistency and streamlining workflows. With their flexibility and extensive range of options, kubectl commands are invaluable for debugging, troubleshooting, and maintaining the health of Kubernetes environments.
kubectl Command
Kubectl allow users to interact with various aspects of the cluster, including deploying and managing applications, inspecting resources, troubleshooting, and performing administrative tasks.
These kubectl commands follow a consistent syntax and structure, typically starting with kubectl followed by a verb and often accompanied by flags or options for specifying additional parameters.
Here's a simple example of using the kubectl command to get information about pods in a Kubernetes cluster.
The above command gets of a list of all pods running in the default namespace of your Kubernetes cluster. It provides information such as the name, status, and age of each pod.
Let's explore deeper into one of the many commands available in kubectl, namely the kubectl top command. Let's explore its functionality and usage in more detail.
kubectl top Command
The kubectl top command is valuable for gaining insight into the resource utilization of nodes and pods within a Kubernetes cluster.
By executing this command, users can obtain a comprehensive overview of the cluster's health and performance metrics, including CPU, memory, and storage usage.
The kubectl top command has two main subcommands,
- kubectl top pod
- kubectl top node
Understanding Kubernetes Resource Monitoring
when you use the kubectl command to check resource utilization metrics (like CPU and memory usage) of your containers, it interacts with the Metrics-Server.
- Metrics-Server is a component in the Kubernetes cluster that collects and stores information about resource usage. It acts as a central hub for collecting data from cAdvisor on all the nodes.
The Metrics-Server then gathers this data from cAdvisor running on each Kubernetes node, which is constantly monitoring the containers' resource usage.
This way, you can easily get insights into how your applications are performing in terms of resource consumption within your Kubernetes cluster.
kubectl top Pod Command
kubectl top pod command in Kubernetes is used to monitor the resource utilization of pods within a cluster. It provides real-time insights into CPU and memory usage, aiding administrators in optimizing performance and managing resources effectively.
Using the kubectl top pod command, you can find several key metrics regarding the pods in a Kubernetes cluster
- Used to identify pods that might be consuming excessive CPU, causing performance issues.
- Used to detect memory leaks or inefficiencies.
- Used to sort pods based on CPU or memory usage, facilitating prioritization and identification of pods with the highest resource consumption.
- Used to provide a comprehensive overview of resource utilization in the entire cluster.
- Helps to identify individual pods and investigate their resource consumption patterns.
Overall by running this command, users can quickly identify pods that may be experiencing high resource consumption, potential bottlenecks, or underutilization. This helps ensure efficient resource allocation and optimal performance of applications.
Let's explore some examples to illustrate the possibilities offered by the kubectl top pod command.
1. Identifying High Resource Consumption
kubectl top pod --sort-by=cpuThis command lists all pods in the cluster sorted by CPU usage in descending order. By examining the pods at the top of the list, administrators can identify those consuming the most CPU resources, potentially indicating resource-intensive applications that may need optimization or scaling.
Output:
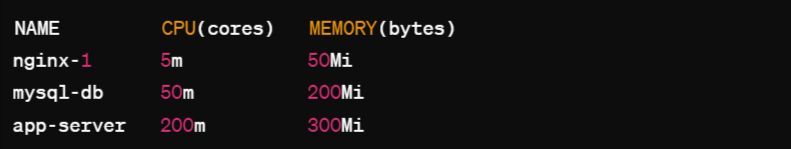
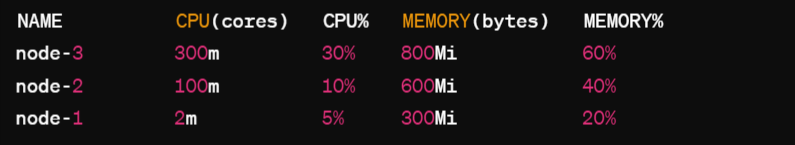
Each row represents a pod running in the Kubernetes cluster. The first column lists the names of the pods.
The second column (CPU(cores)) displays the CPU usage of each pod in milliCPU (millicores), indicating the fraction of CPU resources the pod is consuming.
The third column (MEMORY(bytes)) shows the memory usage of each pod in bytes, indicating the amount of memory allocated to the pod.
2. Detecting Bottlenecks
kubectl top pod --all-namespaces --sort-by=memoryBy fetching resource usage metrics for all pods across namespaces and sorting them by memory usage, this command helps detect pods experiencing memory bottlenecks. Admins can then investigate further to resolve issues, such as optimizing memory allocation or identifying memory leaks.
Output:
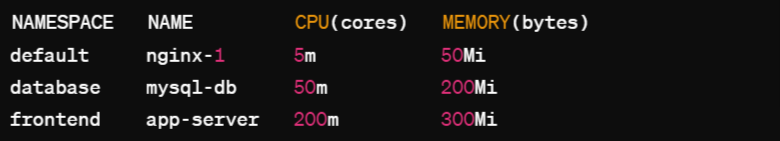
The output is similar to the previous output, but with the addition of the NAMESPACE column. The NAMESPACE column specifies the namespace in which each pod is running.
This output allows administrators to identify resource usage across namespaces, helping detect memory bottlenecks affecting pods in different parts of the cluster.
3. Namespace-Specific Analysis
kubectl top pod -n <namespace>This command fetches resource usage metrics for pods within a specific namespace, providing a focused analysis of resource utilization within that namespace. It lets admins focus on resource usage within that namespace, making it easier to allocate resources effectively for the apps running there, without having to check every part of the cluster.
Output:
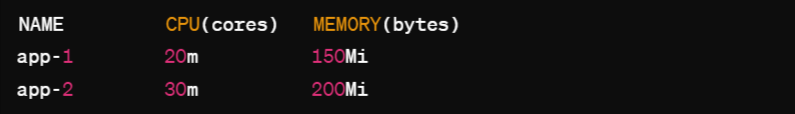
The output is focused on a specific namespace (namespace). Only pods within the specified namespace are listed, providing a targeted analysis of resource usage within that namespace.
This output is useful for administrators managing multiple applications or teams within a shared Kubernetes cluster, allowing them to monitor resource utilization within specific namespaces independently.
kubectl top Node Command
The kubectl top node command in Kubernetes helps in checking how much CPU and memory each node in the cluster is using.
It helps administrators keep an eye on node performance, so they can manage resources better and prevent any slowdowns or issues in their Kubernetes setup.
This command gives quick snapshots of node health, making it easier to spot any nodes that might be overloaded and need attention.
Here are some examples of how you can use kubectl top node to monitor and manage your Kubernetes cluster.
1. Identifying Overloaded Nodes
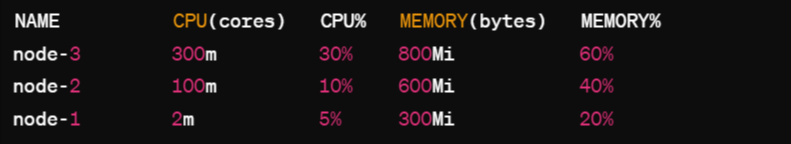
This command provides CPU and memory usage metrics for all nodes in the Kubernetes cluster, aiding in identifying nodes experiencing high loads.
kubectl top node
Output:
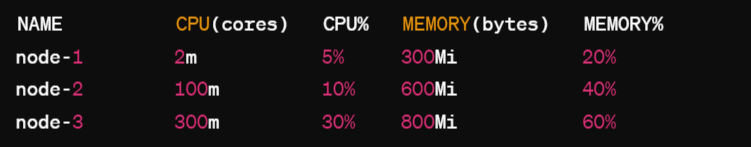
Here, you can see that node-3 is using the most CPU and memory, indicating it might be overloaded and need optimization.
2. Checking Node Resource
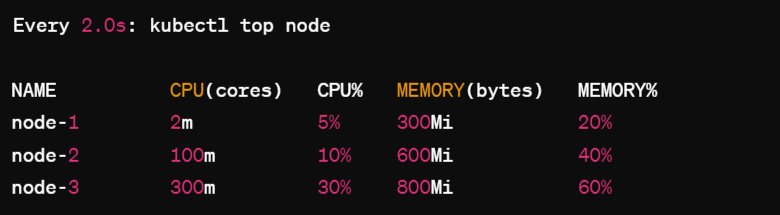
This command continuously updates and displays CPU and memory usage metrics for all nodes at regular intervals, facilitating real-time monitoring of resource trends.
watch kubectl top node
This command refreshes the node metrics periodically, allowing you to observe resource trends over time.
Output:
3. Sorting Nodes by Resource Usage
This command sorts nodes based on either CPU or memory usage, arranging them in descending order of resource consumption.
Based on CPU usage:
kubectl top node --sort-by=cpu
Output:
Based on Memory usage:
kubectl top node --sort-by=memory
Output:
4. Viewing Specific Metrics
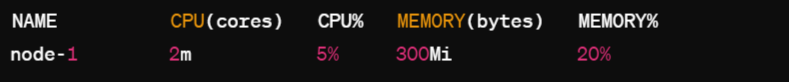
By specifying a node name with this command, it presents detailed CPU and memory usage metrics exclusively for that particular node.
kubectl top node node-1
Output:

5. Filtering Nodes
Using this command with a specific node name, it filters the output to display CPU and memory metrics exclusively for that node.
kubectl top node | grep node-1
Here this code filters the output of kubectl top node, searching for lines that contain the text node-1. So, it will only display lines from the output where node-1 appears, effectively narrowing down the output to show metrics specifically for the node named node-1.
Output:
Although viewing specific metrics and filtering nodes looks similar in appearance, viewing specific metrics focuses on detailed data for a particular entity, while filtering nodes involves narrowing down output based on specified criteria.
Wrap Up
In Kubernetes, Pods serve as the fundamental unit of deployment, encapsulating one or multiple containers. Nodes, on the other hand, represent individual machines within the cluster where these containers are executed.
The Kubectl command-line tool plays a pivotal role in managing Kubernetes clusters, offering functionalities like resource creation, inspection, and updating. With the Kubectl top command, administrators can access crucial insights into resource utilization across the cluster, including CPU, memory, and storage usage.
This command helps find where resources are being used a lot and spots possible problems, so resources can be used better. Using Kubectl and its top command, admins make sure apps run well in Kubernetes, making the system stable and resources used efficiently for managing the cluster better.
Monitor Kubernetes Cluster with Atatus
Ensuring the optimal performance and health of your Kubernetes cluster is essential for smooth operations. With Atatus, you can simplify and enhance your Kubernetes cluster monitoring experience.
Atatus offers a comprehensive monitoring solution designed to empower you with real-time insights into your cluster's performance, resource utilization, and potential issues.
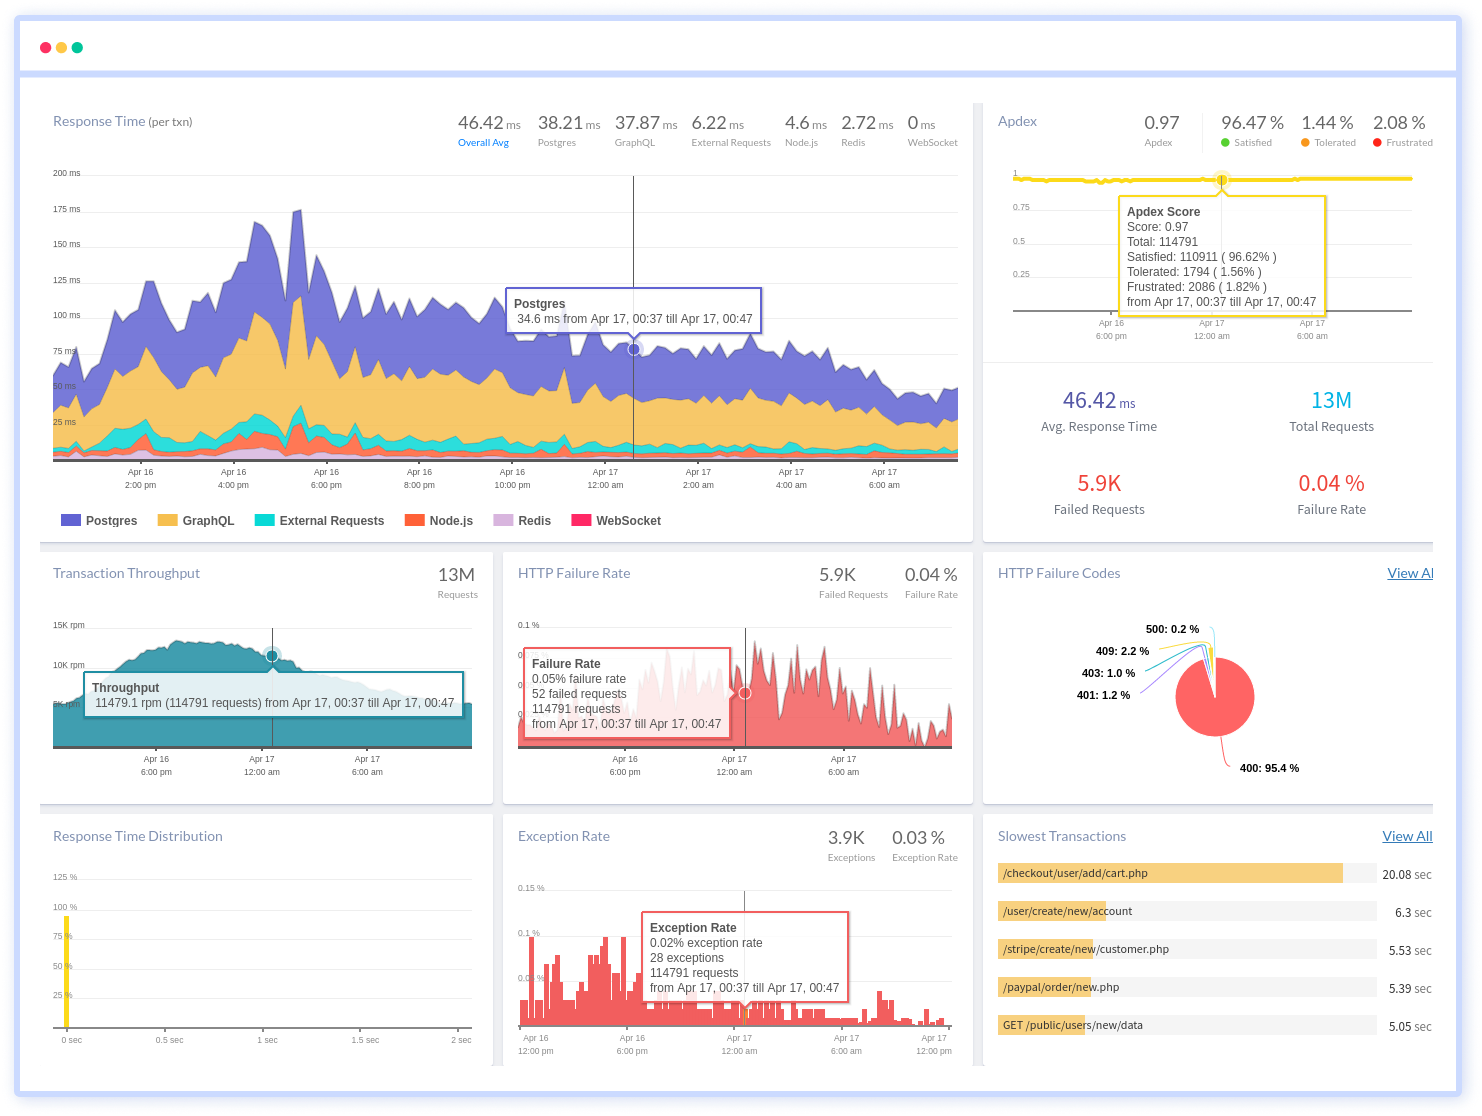
- Real-time insights for proactive issue resolution.
- Customize dashboards for focused metrics.
- Set alerts for critical thresholds.
- Optimize resource usage and scaling.
- Analyze historical data for informed decisions.
You can also easily track the performance of individual Kubernetes containers and pods. This granular level of monitoring helps to pinpoint resource-heavy containers or problematic pods affecting the overall cluster performance.
#1 Solution for Logs, Traces & Metrics
![]() APM
APM
![]() Kubernetes
Kubernetes
![]() Logs
Logs
![]() Synthetics
Synthetics
![]() RUM
RUM
![]() Serverless
Serverless
![]() Security
Security
![]() More
More