PHP Monitoring Best Practices for Developers, DevOps, and SREs
In 2025, PHP still powers over 75% of the web from ecommerce platforms like Magento to CMSs like WordPress and Laravel-powered web apps. As user expectations rise and digital experiences become mission-critical, real-time PHP monitoring has moved from a luxury to a necessity.
According to Statista, PHP continues to rank in the top 10 most-used programming languages globally. Despite the popularity of modern stacks, legacy and modern PHP coexist in thousands of production environments.
PHP apps rely on web servers, databases, and real-time code execution which makes things complex. When something breaks, like a slow query or memory leak, users feel it right away. That’s why monitoring PHP applications isn’t optional anymore.
In this article, we'll explore:
- What is PHP Monitoring?
- Why PHP Monitoring Matters?
- Use Cases and Examples for Developers, DevOps, and SREs
- Common Issues in PHP Applications
- 12 Best Practices for PHP Application Monitoring in 2025
- Why Atatus is the Best PHP Monitoring Tool?
- Get Started with Atatus Today
- FAQs on PHP Monitoring Best Practices
What is PHP Monitoring?
PHP monitoring is the continuous process of tracking, analyzing, and optimizing the performance and health of PHP-based applications. It involves collecting and analyzing key runtime metrics such as response times, memory usage, CPU load, slow database queries, error rates, HTTP status codes, and the responsiveness of external APIs. By observing these elements in real time, teams can proactively detect anomalies, performance regressions, and errors before they affect end users.
This is typically achieved using an Application Performance Monitoring (APM) tool that integrates directly with the PHP runtime, web server (like Apache or Nginx), or framework (such as Laravel or Symfony), allowing developers and SREs to gain complete visibility into how the application performs under various conditions in production environments.
Why PHP Monitoring Matters?
Most PHP applications today do more than serve HTML. They connect to databases, call APIs, run background jobs, and serve users in real time. As the app grows, so does its complexity and with that, the number of things that can go wrong. That’s where monitoring comes in. It gives teams a way to understand what’s happening inside the application without guessing.
This shift makes one thing clear: you can’t manage what you can’t see.
Monitoring isn’t just about catching errors. It’s about answering key operational questions in real time:
- Is latency creeping up over time?
- Are new deployments introducing regressions?
- Is memory usage stable under load?
- Which transactions are consistently underperforming?
Without this visibility, teams rely on gut feelings, guesswork, and fragmented logs which delay resolution and increase risk. PHP monitoring turns invisible problems into visible patterns, allowing you to respond before users feel the impact.
It also builds accountability and speed across teams:
- Developers trace problems faster
- Ops teams track infrastructure bottlenecks
- SREs enforce performance baselines and SLOs
Use Cases and Examples for Developers, DevOps, and SREs
For Developers: Deeper Visibility Beyond Local Testing
Developers are often the first to face blame when a PHP application slows down or breaks after deployment. However, local development environments and even staging servers rarely mimic the performance dynamics of production especially under real-world traffic.
One common example is the infamous N+1 query problem, where a seemingly innocent database call inside a loop executes hundreds or thousands of times during real user interactions.
Example:
Imagine a Laravel developer creates a dashboard that shows each user and their recent orders. In testing, the app loads fast because there are only a few users. But in production, where hundreds or thousands of users access the dashboard, the app slows down dramatically.
Why? For every user, the code runs a separate query to fetch their orders, this is called the N+1 query problem. So instead of one efficient database query, the app runs hundreds or thousands, one after another.
With a PHP monitoring tool, the developer can see which requests are slow and why. The tool shows a breakdown of where time is spent and clearly points to the repeated database queries. By fixing the code to load all orders in a single query (using Laravel’s with('orders')), the problem is solved, and the page loads quickly again. Without monitoring, this problem could take days of guesswork and user complaints to detect.
For DevOps Engineers: Respond Quickly When Things Break After Deployment
DevOps teams are responsible for making sure the application stays live, stable, and healthy especially during and after deployments. But not every issue shows up right away, and logs alone don’t always explain what went wrong.
Example:
After a new release, a DevOps engineer starts seeing spikes in server CPU usage. A few minutes later, the application starts returning 502 Gateway Errors. The site becomes slow, and users begin to drop off.
Using a PHP monitoring tool, the DevOps team gets an instant alert that CPU usage is unusually high. By tracing recent requests, they discover that one of the new features is making repeated calls to a Redis cache and those calls are taking longer and longer, eventually overwhelming the PHP-FPM workers.
Because the monitoring tool links the issue to the specific code change and deploy, the team quickly rolls back the release and restores performance. They also add a limit to Redis calls in future releases. Without PHP monitoring, the issue would’ve taken much longer to find and cost more in user churn and downtime.
For Site Reliability Engineers (SREs): Spot Problems Before They Turn Into Outages
SREs focus on long-term performance and reliability. Instead of waiting for errors, they track trends over time to avoid problems before they happen.
Example:
An SRE at an ecommerce company notices that page load times are getting slower especially for product detail pages. It’s not bad enough to trigger alerts, but it’s steadily increasing over the past week.
Using a PHP APM tool, the SRE finds that every product page depends on a third-party API to show personalized recommendations. That API has started timing out more often during peak traffic.
Although the PHP code isn’t broken, the delay from the external API is slowing everything down. The SRE sets up an alert for API latency and asks the dev team to add a fallback: if the API is slow, show static recommendations instead. By catching the issue early, they avoid a potential conversion drop and keep the app responsive during high traffic periods.
Common Issues in PHP Applications
- Memory leaks due to circular references: Unreleased objects cause memory to grow over time, slowing down or crashing long-running scripts.
- N+1 query problems: Running one DB query per item instead of batching causes performance drops under real traffic.
- Unhandled exceptions and 500 errors: Errors not caught in code lead to app crashes and poor user experience with no helpful feedback.
- High response time from external APIs: Slow third-party APIs delay your PHP responses and block users from accessing critical features.
- Poorly optimized cron jobs: Background tasks with inefficient logic consume server resources and delay other jobs.
- Slow or locked database queries: Unindexed or locked queries block others, leading to request timeouts and backend slowness.
- Outdated PHP versions introducing vulnerabilities: Older PHP versions miss security fixes, exposing your app to known exploits and performance issues.
- PHP-FPM pool exhaustion under load: When all workers are busy, new requests wait or fail, resulting in high latency and server errors.
12 Best Practices for PHP Application Monitoring in 2025 (With Real-Time Examples)
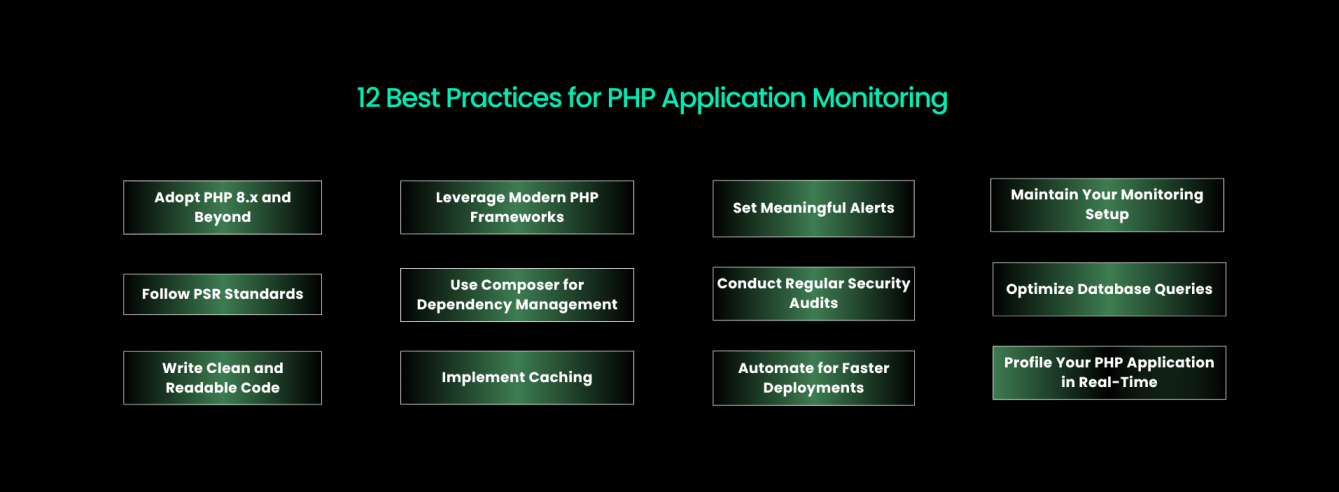
1. Adopt PHP 8.x and Beyond
Newer PHP versions (8.1, 8.2, and 8.3) offer significant performance gains, better error reporting, and improved type safety.
Example: A team running PHP 7.4 on an ecommerce site notices sluggish checkout performance under load. After upgrading to PHP 8.2 and enabling JIT (Just-In-Time) compilation, checkout page latency drops by 30%. Their monitoring tool shows a noticeable reduction in CPU usage and execution time.
2. Follow PSR Standards (e.g., PSR-3, PSR-4, PSR-12)
PSR standards make your code predictable, modular, and easier to trace in monitoring tools.
Example: A development team standardizes all logging using PSR-3. Now, their APM tool groups logs neatly by severity across all services, helping them filter production errors faster during an incident.
3. Write Clean and Readable Code
Readable code makes it easier to debug issues when they show up in trace logs or monitoring dashboards.
Example: A monitoring alert shows slow response times from a function named xProcess(). Developers have no idea what it does. After renaming it to calculateInvoiceTotal(), it becomes immediately clear during analysis. This reduces debug time by half.
4. Leverage Modern PHP Frameworks
Frameworks like Laravel, Symfony, and Slim support better debugging, routing, and monitoring hooks.
Example: A team using a custom legacy framework struggles to trace transactions. After migrating to Laravel, their APM shows clear, structured transaction traces with route names, and controller info. This speeds up root cause analysis.
5. Use Composer for Dependency Management
Composer keeps packages consistent and makes it easier to isolate third-party issues in monitoring tools.
Example: A PHP app starts slowing down. Monitoring shows the slowdown comes from a newly updated Stripe package. Because Composer tracks versions, the team rolls back to a known stable version and sets a constraint to prevent similar issues.
6. Implement Caching (DB, views, sessions, APIs)
Caching reduces response times by avoiding repeated computation or external calls.
Example: A product page loads in 1.5 seconds because it fetches categories and product details on every request. The team adds Redis caching for static data. Monitoring now shows consistent load times under 300ms, even during sales.
7. Set Meaningful Alerts (Avoid Alert Fatigue)
Too many alerts lead to missed signals. Set smart thresholds for error rates, latency, and resource usage.
Example: A team receives hundreds of alerts daily, including minor warnings. They refine alerts to only trigger if the 95th percentile latency exceeds 1s for more than 5 minutes. As a result, on-call engineers now respond only to real incidents.
8. Conduct Regular Security Audits
Monitoring helps spot security risks in real time like exposed APIs, outdated packages, or injection attempts.
Example: A PHP monitoring tool flags repeated SQL error patterns. Investigation reveals a bot is probing a vulnerable endpoint for SQL injection. The team fixes the input validation and blocks the IPs via a firewall rule.
9. Leverage Automation for Faster Deployments
Automation helps integrate monitoring with CI/CD so new code changes are automatically observed.
Example: After a new release, monitoring immediately shows higher-than-usual memory usage on a new API endpoint. The team had enabled automatic deployment tagging via CI/CD, so they quickly identify the new feature causing it and fix it without rollback.
10. Maintain Your Monitoring Setup
Monitoring tools need care too - update agents, rotate tokens, and audit dashboards regularly.
Example: A company’s PHP APM tool stopped reporting data after a server upgrade. Investigation shows the agent was outdated and incompatible with the new OS. They now schedule quarterly audits to keep all agents and integrations up to date.
11. Optimize Database Queries
Many PHP slowdowns are caused not by the code, but by inefficient database queries.
Example: An admin dashboard takes 4 seconds to load. PHP monitoring reveals a query scanning 100k+ rows without using indexes. After adding proper indexes, the load time drops to 600ms, verified in the APM’s query breakdown tab.
12. Profile Your PHP Application in Real-Time
Use profiling to see which functions or operations take the most CPU or memory during live traffic.
Example: A SaaS platform experiences random spikes in load time. The team uses PHP profiling to discover that a PDF generation script is running during every user login due to a misplaced function call. They move it to a queue, and the problem disappears.
Why Atatus is the Best PHP Monitoring Tool?
Atatus stands out not just for its powerful features, but for its developer-first design, clean UI, and easy integration with modern PHP frameworks. It gives teams real-time visibility into how PHP applications behave in production without the complexity or bloated pricing of legacy APMs.
Here’s why developers, DevOps, and SREs choose Atatus for PHP monitoring:
- Auto instrumentation for Laravel, Symfony, Slim: Automatically tracks performance in popular PHP frameworks without extra setup or code changes.
- Real-time transaction tracing: Instantly see which function, query, or external call is slowing down your app as it happens.
- Integrated logging + metrics + traces: Connect logs, traces, and performance data in one view to understand issues end to end.
- Low overhead PHP agent: Lightweight agent captures deep performance insights without slowing down your servers.
- Customizable alerts and SLO dashboards: Set smart, flexible alerts and visualize key performance goals for your PHP services.
- Affordable, transparent pricing: No hidden charges or usage surprises - plans that scale with your app, not your stress.
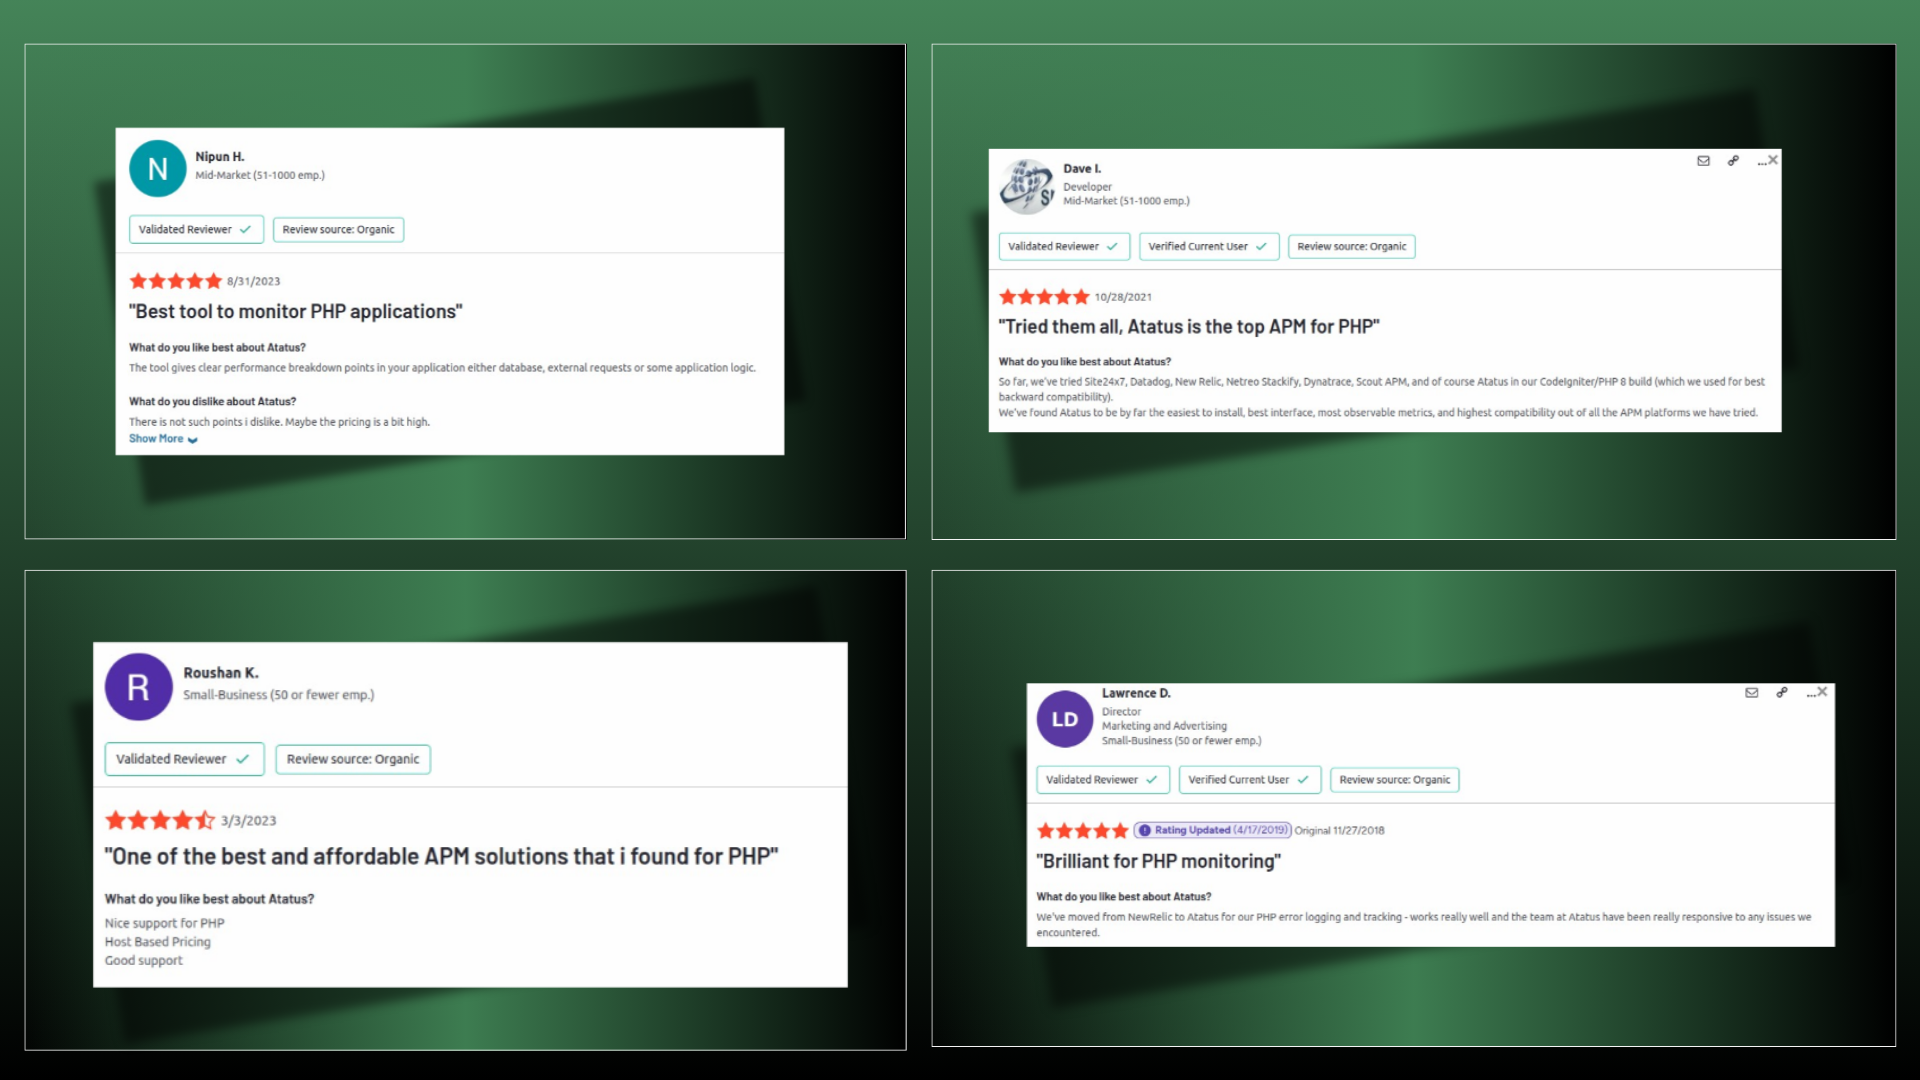
Don’t Just Take Our Word for It - See What Users Say
Get Started with Atatus Today!
Start your free trial and install the PHP agent in minutes. No credit card required. No surprise billing. Just visibility.
FAQs on PHP monitoring Best Practices
Why is PHP still popular in 2025?
PHP remains widely used in 2025 because of its ease of use, strong ecosystem, and ongoing performance upgrades. PHP 8.x brought major speed, type safety, and JIT improvements, making it suitable for modern frameworks like Laravel and scalable web apps.
How do I monitor a PHP application in production?
Use an APM tool like Atatus that supports real-time PHP tracing, error reporting, and infrastructure metrics. Integrate it with your framework (like Laravel or Symfony) to capture transactions, queries, memory usage, and external API latency.
Which metrics should I track in a PHP monitoring tool?
Track response time, error rate, database latency, memory usage, CPU load, and background job execution time. These reveal performance issues before users are affected.
How does PHP monitoring help reduce downtime?
By setting alerts on critical metrics like response time or error spikes, teams can respond faster to incidents. Monitoring tools often show the exact code or query causing failure.
What is the best way to trace slow PHP transactions?
Use a PHP APM that provides transaction traces with timing for functions, SQL queries, and external calls. This helps you pinpoint where the request slows down.
What is PHP profiling and how is it used in production?
PHP profiling reveals which functions consume the most CPU or memory. In production, it helps you detect performance regressions and optimize code paths without guessing.
Can I monitor PHP frameworks like Laravel or Symfony?
Yes, most modern APM tools like Atatus support Laravel, Symfony, Slim, and others. They provide route-level tracing, error grouping, and framework-specific performance metrics.
#1 Solution for Logs, Traces & Metrics
![]() APM
APM
![]() Kubernetes
Kubernetes
![]() Logs
Logs
![]() Synthetics
Synthetics
![]() RUM
RUM
![]() Serverless
Serverless
![]() Security
Security
![]() More
More


![New Relic vs Splunk - In-depth Comparison [2026]](/blog/content/images/size/w960/2024/10/Datadog-vs-sentry--19-.png)