PHP Application Performance Monitoring
Get full visibility into your PHP applications by seamlessly monitoring performance issues along with php errors, database queries and external calls using PHP monitoring. Fix critical issues sooner with real-time alerts impacting your users.
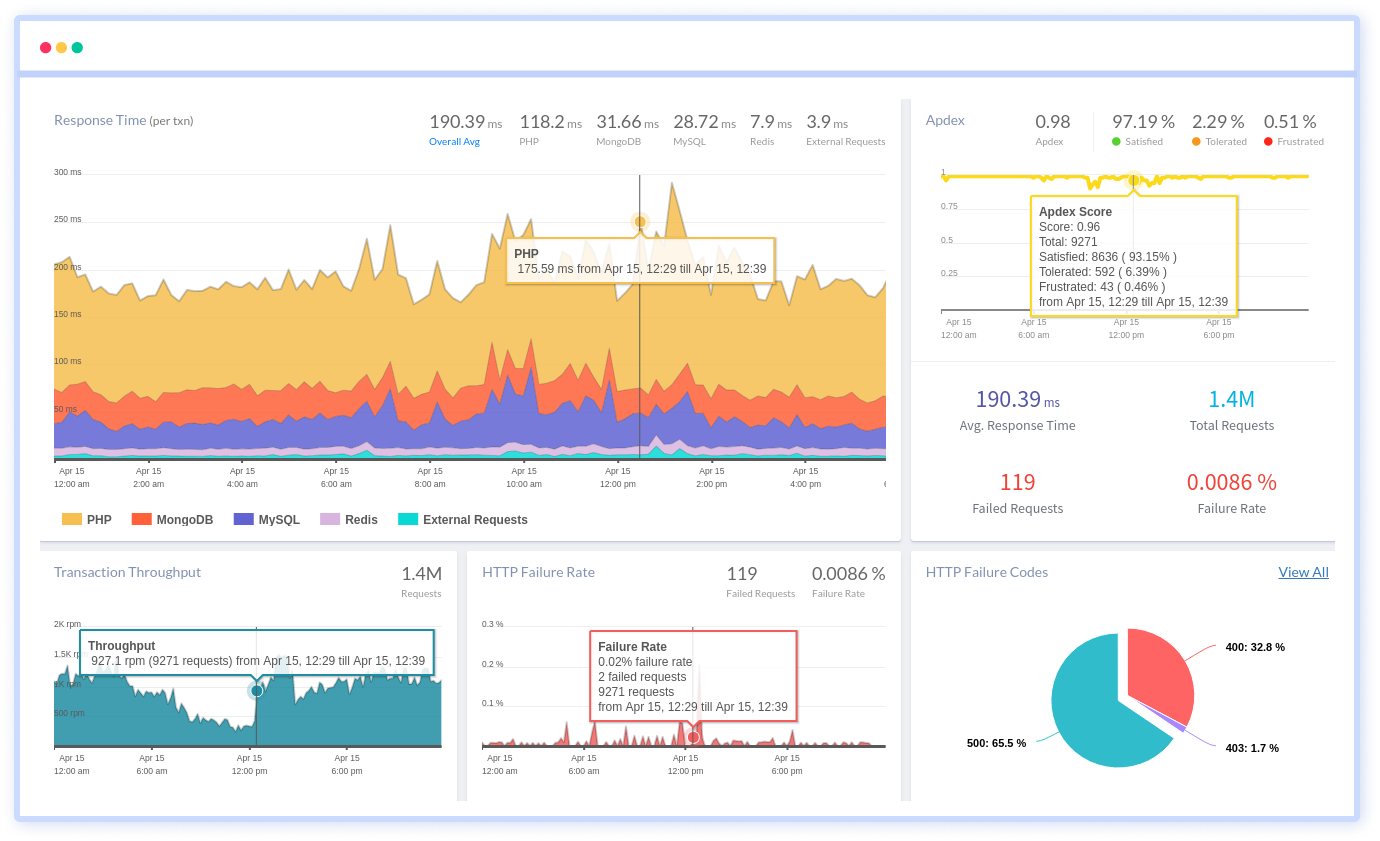
Instant PHP clarity when things break
End-to-end request flow
Follow how PHP requests move through application logic, databases, and external services under real traffic.
Cross-service request context
Understand how PHP requests interact with downstream services and where delays are introduced across boundaries.
Application dependency visibility
See how internal components and external services relate to each other and where architectural bottlenecks form.
Database execution insight
Analyze database behavior in the context of real PHP requests to isolate inefficient interactions.
External call performance
Track outbound network calls to APIs and services that influence response time and reliability.
Logs with execution context
View logs alongside runtime behavior to understand what happened and why it happened.
Security posture awareness
Surface risky runtime behavior and configuration issues that affect application stability.
Runtime error context
Capture failures with enough execution detail to understand impact and scope.
Everything You Need to
Monitor & Optimize
Production-ready observability features that help you ship faster with confidence
Trace-level Visibility Across Your Stack
See every request from frontend or API to backend services, including timing, errors, and relationships. Quickly pinpoint performance issues and link them to code and user impact.

Visualize Service Dependencies
Map service interactions, frequency, and latency to uncover bottlenecks. Overlay health metrics for a clear view of system performance.

Monitor Critical Transactions
Group requests by endpoints, business flows, or operations to track latency, errors, and throughput. Keep key user journeys and SLAs on track.

Track External Dependencies
Monitor third-party API calls, latency, and errors to spot external slowdowns and prevent wasted troubleshooting.


Why teams choose Atatus?
Teams choose Atatus for clear visibility into PHP performance without adding complexity to their stack.
Built for PHP execution
Insights are tailored to how PHP applications behave in real production environments.
Faster issue diagnosis
Minimal configuration and focused dashboards help teams identify and resolve issues quickly.
Low operational overhead
Lightweight monitoring avoids performance impact and reduces ongoing maintenance effort.
Clear performance signals
Relevant metrics are surfaced without overwhelming teams with unnecessary data.
Supports growing SaaS workloads
Scales from small PHP applications to high-traffic, production-critical systems.
Predictable pricing
Usage-based pricing without long-term contracts or restrictive feature tiers.
Unified Observability for Every Engineering Team
Atatus adapts to how engineering teams work across development, operations, and reliability.
Developers
Trace requests, debug errors, and identify performance issues at the code level with clear context.
DevOps
Track deployments, monitor infrastructure impact, and understand how releases affect application stability.
Release Engineer
Measure service health, latency, and error rates to maintain reliability and reduce production risk.