Client-side Logging: Optimize Performance and Enhance the User Experience
Performance optimization is crucial when developing user-centric applications. To achieve better performance, it is essential to maintain effective log management. Client-side (user) logging is vital in driving website traffic or increasing user engagement with your applications.
After deploying an application or a web browser, client-side information, such as user behavior, events, and errors, is not stored by default. User reports are often less useful because some users only report issues they encounter, while many do not report anything at all. This highlights the necessity for client logging, which collects and stores data from front-end applications.
For improved performance management, enhanced user experience, and increased user satisfaction, client-side logging is crucial for an application.
By utilizing client-side logging reports, developers can analyze errors and optimize the performance of an application. This article will delve into client logging and explore its significance in performance optimization.
Table of Contents
- What is Client-side Logging?
- Purpose of Client-side Logging
- Types of Client Logs
- How does Troubleshooting get Simpler with Client-side Logging?
- Best Practices to Collect Client-side Logs
- Client Log Analysis with Atatus
What is Client-side Logging?
Client-side logging is collecting and storing data such as user interactions, events, errors, and performance metrics directly within the user's browser or client-side environment, meaning it happens on the user’s device rather than on the server.
Client-side logs contain user actions (clicks, form submissions), error messages, stack traces, network requests, and timing information. This information is transferred to a server for further analysis and saved locally for debugging.
Keep an eye on performance metrics like page load times, resource usage, and network latency to optimize the overall user experience. Log user interactions, including clicks, scrolls, and other actions, for valuable insights into user behavior.
Collect browser information, such as type, version, and device details, along with user context like IDs, session details, and referral sources for a holistic understanding of user engagement.
Additionally, track feature usage and log network requests, including API calls and responses, to make informed development decisions and facilitate thorough troubleshooting.
By strategically collecting and analyzing this data, you can refine your applications, address pain points, and continually enhance performance and user satisfaction.
Purpose of Client-side Logging
Client-side logs enhances overall user support and facilitates continuous improvement in user experience. Here are some prominent purposes of client-side logs:
- Error Identification and Debugging: On-the-go spotting and debugging errors occur in the client-side environment via recording pertinent information, error messages, and stack traces When unforeseen problems occur during user interactions.
- Performance Monitoring: Keep tracking and examining the application performance from the user’s point of view by recording network requests, time data, and other performance indicators.
- User Behavior Analysis: Log events like clicks, form submissions, and other user interactions to understand user behavior better and make the site more user-friendly by analyzing trends.
- Proactive Issue Resolution: Developers can proactively address potential threats by continuously evaluating client-side logs to determine the trends in the problems.
- Enhanced User Support: Capture detailed user interactions with client-side logs for better support. Optimize the user experience, identify preferences, and address pain points effectively.
- Security Monitoring: By keeping track of security-related events and keeping an eye out for questionable client behavior, you can identify and address security threats and vulnerabilities.
- Offline Support: By keeping client-side logs, you can record and save data locally for troubleshooting purposes in the event of sporadic or nonexistent network access.
Types of Client-side Logs
Client-side logs come in various types, including error logs for identifying issues, performance logs to track speed, and event logs for user interactions. Additionally, audit logs record user actions, while debug logs aid developers in troubleshooting.
Here are some familiar types of client-side logs:
- Error Logs: Record error messages and stack traces during unforeseen problems to facilitate quick troubleshooting and identification.
- Event Logs: Analyse user behavior and improve application usability by logging user interactions and events.
- Performance Logs: Keep track of timing data and performance indicators to find bottlenecks and enhance user experience.
- Network Logs: Give specifics regarding network requests so that problems can be identified and data transfers can be optimized.
- Console Logs: For general debugging and more context, output messages from the browser console.
- User Interaction Logs: Record user interaction data, such as mouse and keyboard motions.
- Session Logs: Keep track of user session information to examine engagement trends and spot problems related to the session.
- Security Logs: Keep track of security-related incidents, like unsuccessful login attempts and unauthorized access.
- User Agent Logs: Gather information about the user's browser, device, and operating system to improve performance.
- Custom Logs: Establish and record unique events or data that meet the application's needs.
How does Troubleshooting get Simpler with Client-side Logging?
Client-side logging facilitates troubleshooting by offering comprehensive details about the client's interactions with a system or application. Here are a few ways it makes troubleshooting easier:
- Localized Issue Identification: The logs on the client side aid in locating problems unique to the device or surroundings of the user. Developers can identify issues with the device type, local settings, or user system configuration by looking through client-side logs.
- Real-time Data: Real-time information about the behavior of the application on the user's device is provided by client-side logs. This makes it possible for developers to examine problems as they arise, leading to quicker problem-solving.
- Recreation of Issues: Crystal clear client-side logs help developers reproduce the problems in a controlled environment. It is essential to find the root causes of the issues and remedies.
- Reduced Dependency on User Reports: Client-side logs provide developers with a more complete picture of the events leading up to an issue than user reports, which could be deficient in specifics.
- Debugging and Error Tracing: Client-side logs allow developers to spot issues and track the application's flow more effectively. This guarantees a more efficient troubleshooting procedure and helps with debugging.
- Enhanced Collaboration: Troubleshoot errors more proficiently via a brain-storming process by disseminating the logs among developers, support teams, and stakeholders.
- Version-specific Insights: Developers can more easily determine whether a problem is associated with a given release or upgrade by correlating client-side logs with software versions.
Best Practices to Collect Client-side Logs
Gathering client-side logs is often essential for troubleshooting and diagnosing problems with online applications. The following are some approaches for gathering client-side logs:
1. Console Logging
Use JavaScript's console object to record messages. This is frequently employed in debugging.
Example:
console.log('This is a log message');2. Custom Logging
Use unique logging functions in your JavaScript code to record particular mistakes or events.
Example:
function customLog(message) {
	// Your custom logging logic here
}
3. Error Handling
Use the window.onerror event to record errors that are left unattended.
Example:
window.onerror = function (message, source, lineno, colno, error) {
	// Log or send the error details to a server
};
4. AJAX Requests
Keep track of AJAX requests and answers to gain insight into client-server communication.
Example:
$.ajax({
    url: "your-url",
    method: "GET",
    success: function(data) {
        console.log(data);
    },
    error: function(error) {
        console.error(error);
    }
});
5. Performance API
Use the Performance API to track and log performance metrics.
Example:
console.log("Page load time: " + (performance.now() - performance.timing.navigationStart) + "ms");6. Local Storage
Save pertinent information to the browser's local storage for later access.
Example:
localStorage.setItem('logKey', 'logMessage');7. Logging Libraries
Use logging libraries such as Winston, Bunyan, or Log4js to provide organized logging on the client side.
8. Network Monitoring
Use browser developer tools to monitor network activities and record pertinent data.
9. Analytics and Error Tracking Services
Include error tracking or analytics services (like Atatus, Sentry, LogRocket, and Google Analytics) that offer comprehensive client-side logs.
10. Browser Extensions
Create browser extensions for Chrome or Firefox that record and store client-side logs.
Client Log Analysis with Atatus
Atatus provides a hassle-free Logs Monitoring solution delivered as a fully managed cloud service, requiring minimal setup regardless of scale and with zero maintenance. Effectively monitor logs from all systems and applications through a centralized, user-friendly interface, enabling swift troubleshooting for enhanced efficiency.
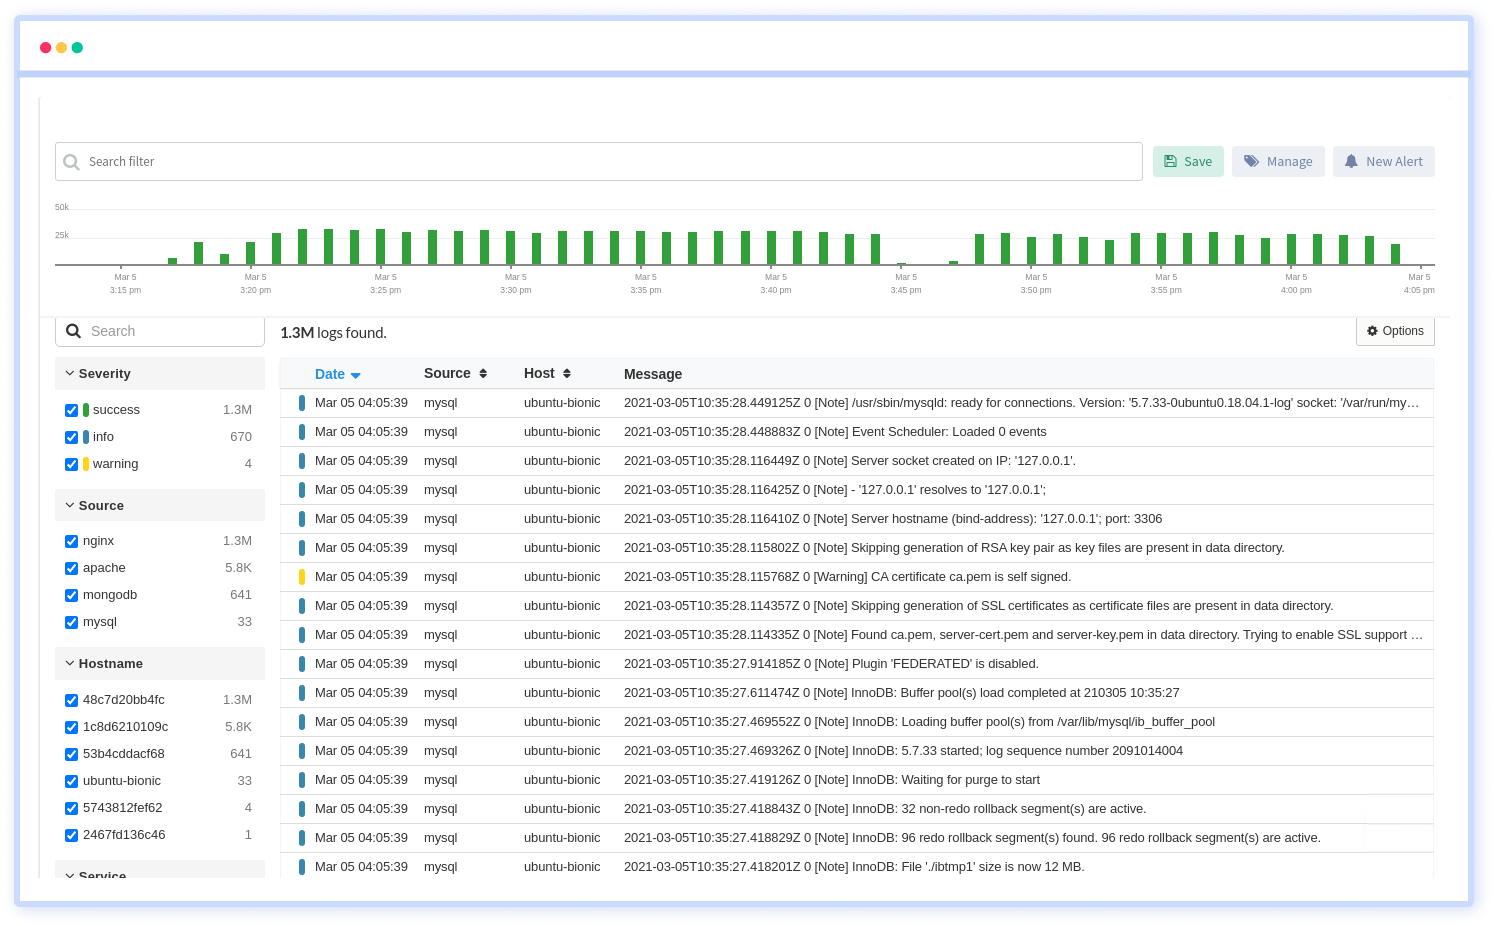
- Centralized Log Management: Centralize logs from various sources for a unified view of system behavior.
- Real-time Log Analysis: Monitor and respond to log events in real-time for timely issue resolution.
- Live Logs: Monitor logs in real-time as they are generated, providing immediate visibility into system events for rapid issue identification and resolution.
- Log Search and Filtering: Quickly search and filter logs to pinpoint specific events or patterns.
- Alerting and Notification: Customize alerts based on log events to ensure timely response to anomalies.
- Correlation with Metrics and Traces: Integrate logs seamlessly with APM metrics and traces for a holistic system view.
Getting Started with Atatus Logs Monitoring
To enable logs monitoring in your application, install the Atatus infrastructure agent and activate the "logs_enabled" flag in your configuration file.
# /etc/atatus-infra-agent/atatus.yml

# General
license_key: "lic_infra_testkey"

# Sets log level. The default log level is info.
# Available log levels are: error, warning, info, verbose
log_level: warning

# The tags of the shipper are included in their own field with each transaction published.
# eg: ["aws-eu", "web-tier"]
tags: []

# Optional fields that you can specify to add additional information to the output.
#customData:
#  env: production

logs_enabled: false
Enable log collection by default in the Atatus Infra Agent by configuring the /etc/atatus-infra-agent/atatus.yaml file.
logs_enabled: trueTry your 14-day free trial of Atatus.
Conclusion
Client-side logging is essential to frontend observability since it facilitates problem identification, optimizes user experience, and boosts overall program performance for developers.
Accessing comprehensive logs straight from the user's device makes troubleshooting more proactive and focused, eventually boosting the application's overall performance and dependability.
Several tools are available to assist you in monitoring and analyzing logs produced by your applications' client side.
Consider your unique needs when selecting a tool, such as analytics on user behavior, performance tracking, and mistake tracking. Ease of use and integration potential with your development stack should also be considered.
Atatus Logs Monitoring and Management
Atatus offers a Logs Monitoring solution which is delivered as a fully managed cloud service with minimal setup at any scale that requires no maintenance. It monitors logs from all of your systems and applications into a centralized and easy-to-navigate user interface, allowing you to troubleshoot faster.

We give a cost-effective, scalable method to centralized logging, so you can obtain total insight across your complex architecture. To cut through the noise and focus on the key events that matter, you can search the logs by hostname, service, source, messages, and more. When you can correlate log events with APM slow traces and errors, troubleshooting becomes easy.
#1 Solution for Logs, Traces & Metrics
APM
Kubernetes
Logs
Synthetics
RUM
Serverless
Security
More

