Grafana vs Splunk - An Overview
Monitoring tools serve as essential tools for computer systems, diligently collecting and analysing data to enhance decision-making and and prevent potential issues.
Monitoring tools give you real-time information, helping you quickly find and fix problems and also makes sure everything runs smoothly. Thus effective monitoring tools are a necessity for businesses seeking insight into their IT infrastructure.
In this blog post, we will look into an extensive comparison of Grafana and Splunk, two prominent monitoring tools in the current market. Our discussion will encompass a detailed exploration of their features and various aspects.
Towards the conclusion of the blog, we are going to see an exceptional monitoring tool, and an in-depth examination of its features. Curious about what this tool is? Dive into the blog to discover it.
By the end of this read, you will gain comprehensive insights into monitoring tools and their diverse features. This exploration aims to assist you in determining which tool aligns better with the needs of your business.
As you progress through the content, you will be equipped with the knowledge to make an informed decision regarding the most suitable monitoring tool for your business.
Lets get started!
Table of Contents
- Grafana - An Overview
- Splunk - An overview
- Grafana - Key Features
- Splunk - Key Features
- A Comparative Analysis of Grafana and Splunk
- A Choice Beyond Splunk and Grafana for Monitoring Solutions
Grafana - An Overview
Grafana is an open-source analytics and monitoring platform that allows users to visualize and analyse data from various sources in real-time. It supports a wide range of data sources, including databases, cloud services, and custom APIs.
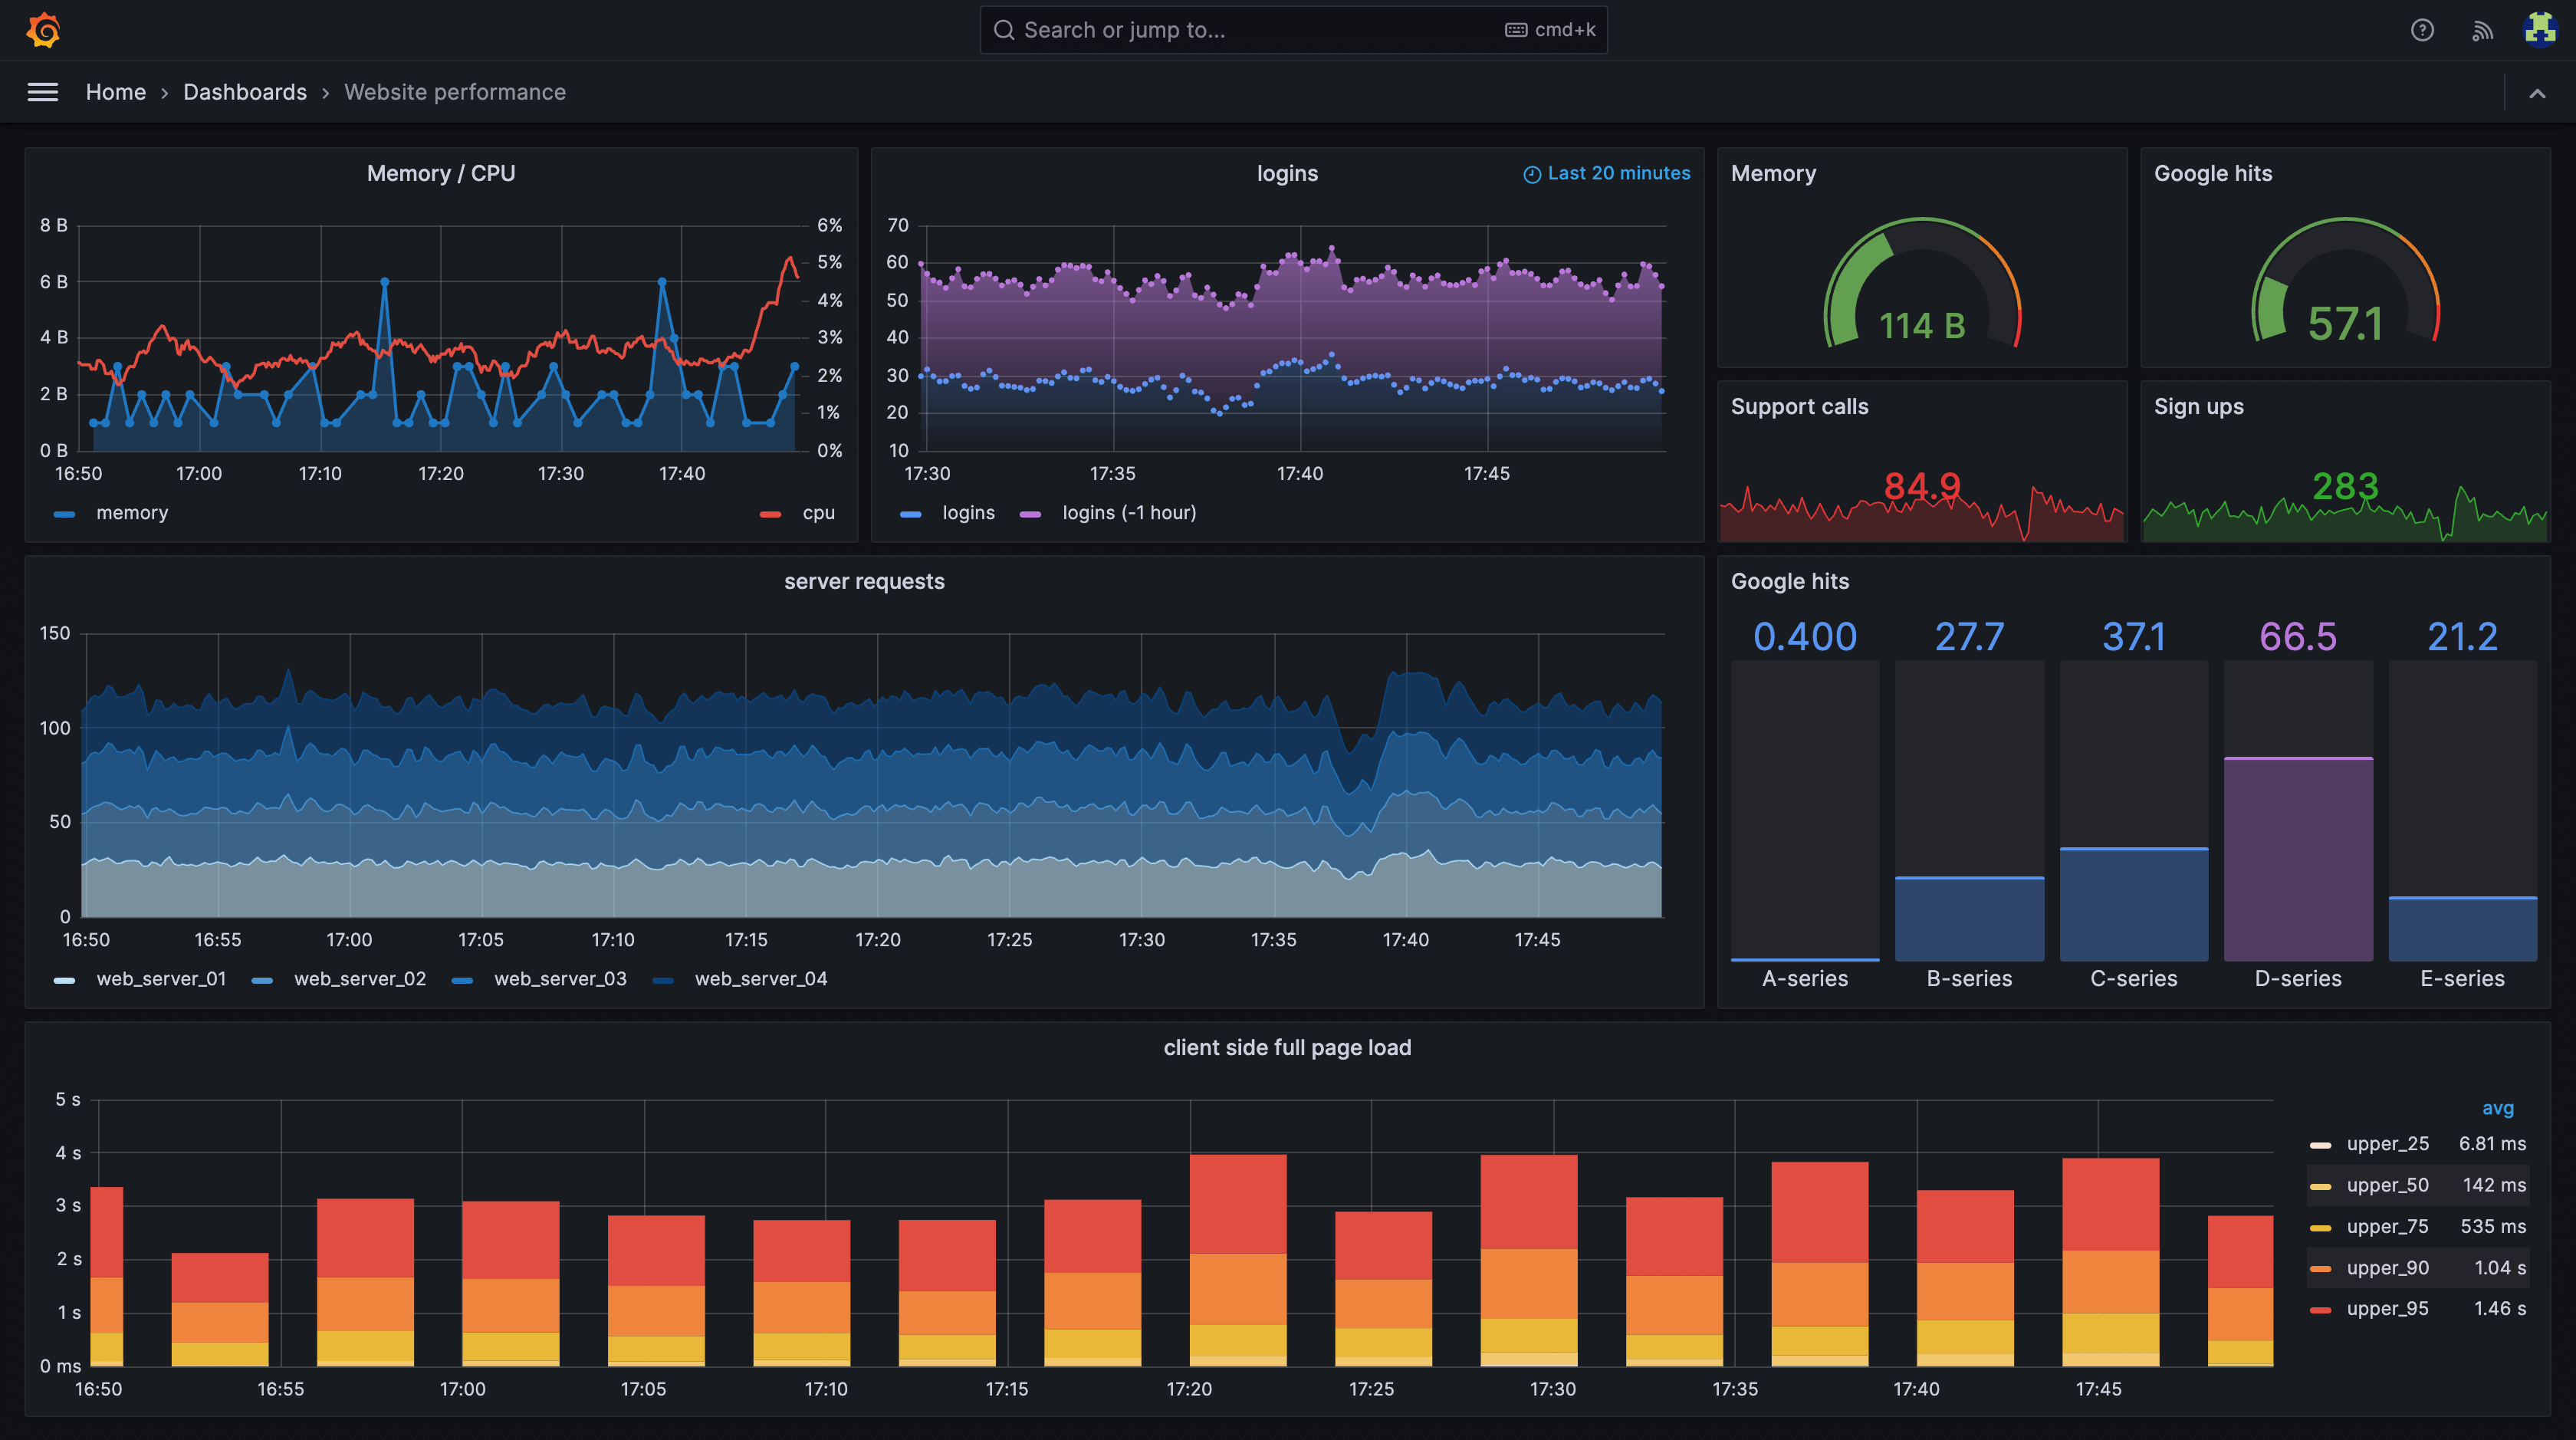
Grafana empowers users to craft interactive and personalized dashboards, utilizing diverse data visualization options like graphs, charts, and tables. With the ability to create, explore, and share aesthetically pleasing dashboards that seamlessly blend data from multiple sources, Grafana encourages the cultivation of a data-driven culture within your team.
It is commonly used for monitoring infrastructure, application performance, and business metrics. Its flexibility and extensibility make it a popular choice, providing organizations with valuable insights for informed decision-making across different domains.
Splunk - An Overview
Splunk is a leading platform extensively employed for log management, security information and event management (SIEM), and operational intelligence, contributing to the creation of a safer and more resilient digital environment.
Splunk fulfills this mission by aiding security, IT, and DevOps teams in ensuring the secure and continuous operation of their organizations. The platform prioritizes data security and privacy, aligning with global and industry compliance standards.
Upholding a commitment to safeguarding privacy, Splunk focuses on three primary objectives: integrating Environmental, Social, and Governance (ESG) principles throughout the business, advancing a Global Impact strategy, and fostering innovation through a comprehensive global climate resilience and innovation strategy.
Grafana - Key Features
- Grafana enables easy creation and sharing of dynamic dashboards, promoting collaboration and transparency.
- It allows visualization of diverse data sources like Kubernetes clusters, Raspberry Pi, various cloud services, and Google Sheets on a unified dashboard.
- Grafana offers fast and flexible visualizations, supporting a range of options from heatmaps to histograms, graphs to geomaps.
- The Grafana Alerting feature allows users to create, manage, and silence alerts through a user-friendly interface, centralizing alert management.
- Grafana plugins connect tools and teams by integrating with existing data sources through APIs, rendering real-time data without migration or ingestion hassles.
- Transformations enable users to rename, summarize, combine, and perform calculations across different queries and data sources.
- Annotations allow users to enrich graphs with events from various data sources, providing detailed metadata and tags on hover.
- The panel editor provides a consistent UI for configuring, customizing, and exploring panels, ensuring ease of use across all visualizations.
Splunk - Key Features
- Real-time streaming analytics with full-stack observability.
- Avoids vendor lock-in through open, flexible data collection and 200+ integrations.
- Easy monitoring setup with a lightweight, open-source Smart Agent.
- Cloud-agnostic monitoring with visibility for serverless functions.
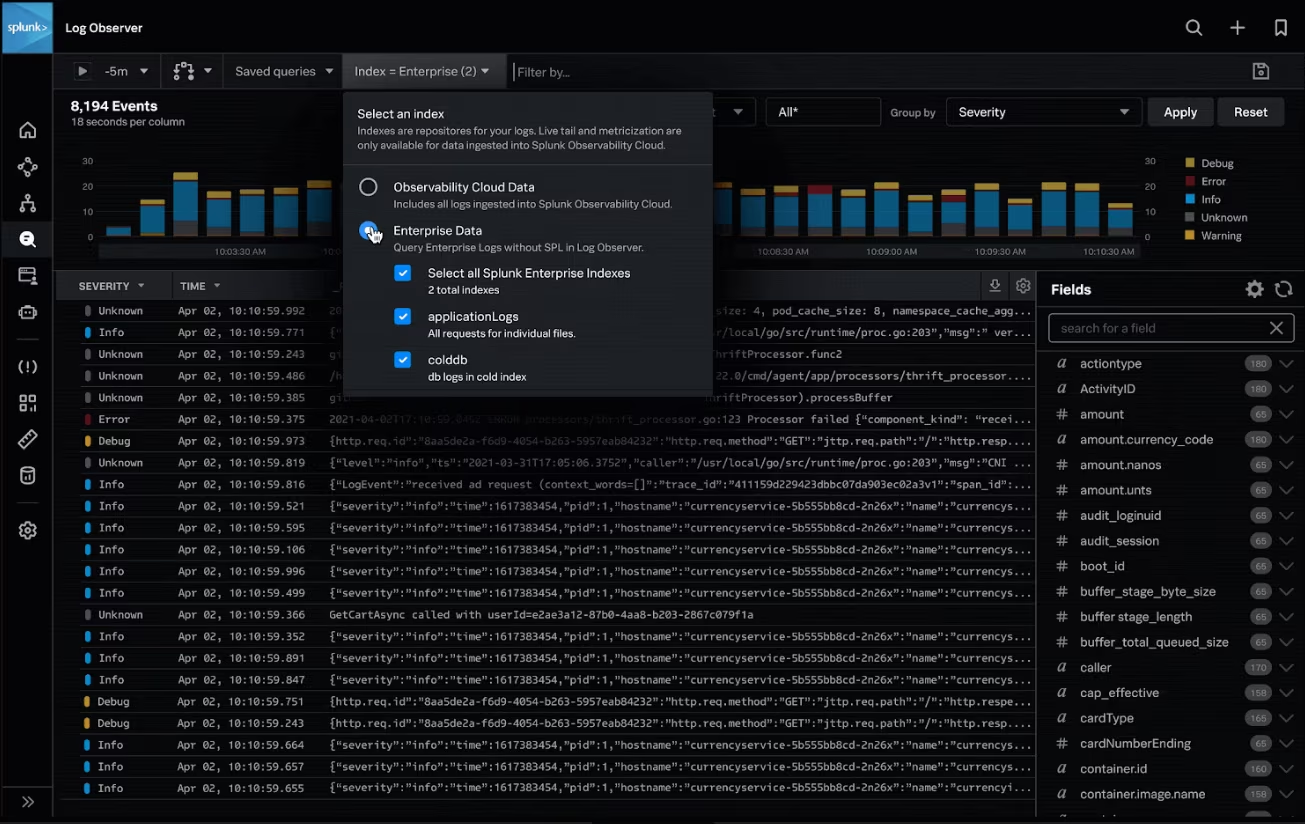
- Real-time interactive visualizations and customizable dashboards.
- Over 20 sophisticated analytics functions for deeper insights.
- Encourages team collaboration with granular access controls.
- Proactive alerting and built-in data science for dynamic thresholds.
- Best-in-class Kubernetes monitoring with turnkey solutions.
- Observability as a service, including a cloud cost optimizer.
- Integration with CI/CD tools for seamless DevOps workflows.
A Comparative Analysis of Grafana and Splunk
1. Data Collection
Both Grafana and Splunk are powerful tools used for monitoring, visualization, and analysis of data, but they have different approaches and use cases. Grafana and Splunk exhibit distinct features and approaches when it comes to data collection. Let's discuss and compare based on these aspects and then discuss some key considerations for making a choice.
Grafana is known for its user-friendly interface and ease of use, especially in terms of setting up and configuring data sources. It primarily relies on data sources and plugins for data collection. Grafana does not handle data ingestion directly but relies on connectors and plugins to pull data from various sources.
It supports a wide range of data sources, including cloud providers, databases, and time series databases, allowing users to connect to different data repositories.
Splunk, while robust, might pose a steeper learning curve due to its specialized data input configurations. As per the official documentation of Splunk Data Stream Processor, data is collected from various sources using different services and connectors:
- Ingest Service: Retrieves JSON objects from the Ingest REST API's /events and /metrics endpoints.
- Forwarder Service: Gathers data from Splunk forwarders.
- DSP HTTP Event Collector (DSP HEC): Collects data from HTTP clients and syslog sources.
- Streaming Connectors: Support data from a variety of sources including Amazon Kinesis Data Stream, Apache Kafka, Apache Pulsar, Microsoft Azure Event Hubs, and Google Cloud Pub/Sub. These connectors continuously receive data emitted by the respective sources.
The choice between Grafana and Splunk for data collection would depend on factors such as the variety of data sources in your environment, the level of flexibility required, and the familiarity of your team with the respective platforms. Both have their strengths, and the decision should align with the specific needs and preferences of your organization.
2. Visualisation and Dashboards
Both Grafana and Splunk offer robust tools for designing and customizing dashboards, facilitating effective visualization of diverse data sources.
Grafana allows powerful dashboard creation by selecting a data source and combining panels for visualizing metrics with varying bandwidth requirements.
Interact with, visualize, set alerts, and comprehend your data, irrespective of its storage location. Grafana enables the creation, exploration, and sharing of data through aesthetically pleasing and adaptable dashboards.
Splunk's dashboard studio provides customization options like layout, images, and colors for creating personalized dashboards in Splunk.
3. Security
The security of Grafana and Splunk largely depends on how well they are configured, deployed, and maintained within a specific environment.
Grafana supports secure connections through HTTPS, and user authentication and authorization mechanisms can be configured. Splunk, with its robust security features, includes role-based access controls, encryption, and auditing capabilities to ensure the confidentiality and integrity of machine-generated data.
Organizations can configure these platforms to meet their specific security requirements.
4. Alerting and Notification
Splunk and Grafana both help you set up alerts, like notifications when something important happens in your data. Splunk is really good at managing and keeping track of alerts. It can send alerts through different apps like Slack or email and keeps everything organized in one place.
On the other hand, Grafana is like a smart assistant that lets you control alerts very precisely, especially in specific parts of your data dashboards. It's great for beginners who want simplicity and customization.
Thus Splunk excels in advanced alert management and monitoring, offering comprehensive tracking capabilities. In contrast, Grafana emphasizes precise control over alerting rules at the dashboard panel level, providing detailed customization options.
A Choice Beyond Splunk and Grafana for Monitoring Solutions
Atatus provides an easy-to-use alternative to Grafana and Splunk, offering a user-friendly interface for monitoring your applications. With Atatus, you get a unified solution that's simpler to set up, provides real-time insights, and can be a cost-effective choice compared to other options.
Easily keep an eye on your entire system, from the user interface to the server backend, using Atatus for comprehensive monitoring. Get quick and straightforward insights to identify and solve issues in your applications promptly.
With unified monitoring system, you can locate performance bottlenecks and enhance your app for an optimal user experience. Atatus simplifies the process, making it easier for beginners to understand and improve their applications.
Get a complete picture of your application's performance with full-stack observability.
This means you can see everything that's happening in your app, spot and fix issues right away, and make sure your users have the best experience possible – all in real time.
Key Features
- Comprehensive Back-End Performance Analysis
Effortlessly diagnose and fix application issues with performance monitoring, boosting reliability and speeding up time to market. Gain timely insights into performance bottlenecks across your entire DevOps stack for efficient problem-solving. - Real User Monitoring for Enhanced Website Experience
See exactly how users experience your website with Real User Monitoring, covering Core Web Vitals. Identify and fix issues across devices, countries, and applications using RUM metrics. - Monitor Servers and Processes Health
Check how well your system is running and see the health and usage of your servers instantly. Use server monitoring to catch and fix problems before they affect your servers. It's like giving your servers a health check. - Identify and Address Slow Database Queries
Keep track of your database calls to ensure they do not affect your application performance. - Centralized Logging for Issue Resolution
Quickly find and solve problems by analysing log data with Log Monitoring. Keep an eye on all your log files from different places in real time. It's like having a super-fast detective for your system issues. - Ensure Seamless Website Availability
Atatus provide you a detailed overview on how your site is performing and you can fix them as soon as possible. - Uncover Real-Time API Insights
Discover how well your APIs are doing with detailed insights and find out how people are using them. - Complete Visibility Across Kubernetes
Check how well your system is running and see the health and usage of your servers instantly. Use server monitoring to catch and fix problems before they affect your servers. It's like giving your servers a health check.
Why Atatus?
Choose Atatus for an exceptional monitoring experience that simplifies application management. With a user-friendly interface, real-time insights, and comprehensive features like back-end performance analysis, Real User Monitoring, and server health monitoring, Atatus offers a unified solution suitable for both beginners and seasoned developers.
It stands out with its ability to quickly identify and resolve issues, ensuring optimal user experiences. Whether it's tracking database performance, analysing logs, or gaining real-time API insights, Atatus provides a holistic approach to monitoring.
Elevate your application's reliability and speed up development with Atatus, a cost-effective alternative that streamlines the monitoring process.
Closure
Monitoring tools like Grafana, Splunk, and Atatus play crucial roles in ensuring the smooth operation of businesses' IT infrastructure. While Grafana excels in user-friendly dashboard creation and flexibility, Splunk offers robust security features and advanced alert management.
Atatus stands out with its simplified interface and comprehensive monitoring capabilities, making it a suitable choice for both beginners and experienced developers.
Ultimately, the choice depends on specific business needs and preferences. Whether prioritizing ease of use, robust security measures, or comprehensive monitoring features, businesses can find a suitable solution according to their needs.
Embracing these tools empowers organizations to make informed decisions, resolve issues promptly, and enhance overall operational efficiency.
Monitor Your Entire Application with Atatus
Atatus is a Full Stack Observability Platform that lets you review problems as if they happened in your application. Instead of guessing why errors happen or asking users for screenshots and log dumps, Atatus lets you replay the session to quickly understand what went wrong.
We offer Application Performance Monitoring, Real User Monitoring, Server Monitoring, Logs Monitoring, Synthetic Monitoring, Uptime Monitoring and API Analytics. It works perfectly with any application, regardless of framework, and has plugins.

Atatus can be beneficial to your business, which provides a comprehensive view of your application, including how it works, where performance bottlenecks exist, which users are most impacted, and which errors break your code for your frontend, backend, and infrastructure.
If you are not yet a Atatus customer, you can sign up for a 14-day free trial .
#1 Solution for Logs, Traces & Metrics
![]() APM
APM
![]() Kubernetes
Kubernetes
![]() Logs
Logs
![]() Synthetics
Synthetics
![]() RUM
RUM
![]() Serverless
Serverless
![]() Security
Security
![]() More
More


![New Relic vs Sentry - Which Monitoring Tool to Choose? [2024]](/blog/content/images/size/w960/2024/10/VS--1-.png)
![New Relic vs Splunk - In-depth Comparison [2024]](/blog/content/images/size/w960/2024/10/Datadog-vs-sentry--19-.png)