Datadog vs Atatus

Today every problem has a solution that evolved into powerful software troubleshooting and performance analytics capable of analysing and deconstructing the entire application for issues and bugs. Since most web offerings monitored these days are multi-tiered applications, Datadog and Atatus are leading APM software in this category.
Both Datadog and Atatus ensure optimal application availability and performance through comprehensive end-user monitoring, application monitoring, and server monitoring capabilities.
We will cover the following sections in this blog post.
#1 Datadog
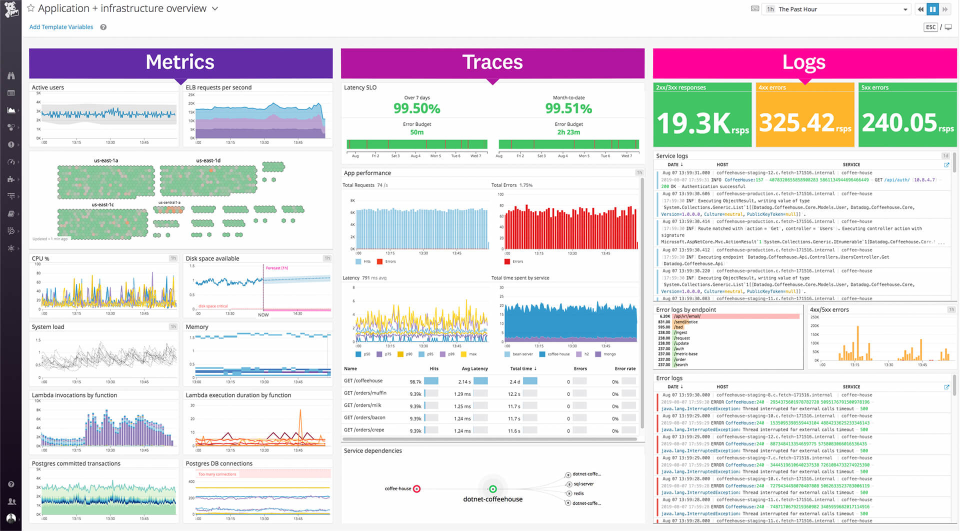
Datadog was founded in 2011 as a SaaS-based application monitoring tool for web applications. The tool has expanded to include infrastructure management and network monitoring capabilities along with monitoring for both web and mobile applications. It can monitor 100s of different OS, web applications, containers, cloud hosts, and much more using an agent-based architecture.
These unique features and capabilities are helping DevOps teams all over avoid downtime and also solving any performance issues that they are dealing with. It also offers a variety of integrations to make the works of DevOps teams easier by seamlessly monitoring events and metrics across the application.
This includes working data from SaaS, cloud providers, automation tools, other monitoring and instrumentation platforms, source control, and bug tracking features, server components, and much more.
#2 Why Datadog?
Datadog is a practical way to gain full visibility into modern cloud-based applications. It allows you to work on monitoring, troubleshooting and optimizing application performance to achieve your goals.
Datadog is used to:
- Track requests from end-to-end across all distributed systems
- Monitor application performance with automatically-generated service and guaranteeing that actionable insight and intelligence is always available for those who need it
- Create alert and graph on errors rates or latency percentiles that could negatively impact the end-user experience
- Develop instrumenting code using open-source tracing libraries to make the entire process easier across the application
#3 Atatus
Atatus is a SaaS-based APM tool launched in 2014 that delivering full-stack visibility for all applications. It helps to collect performance data points dynamically across applications that quickly resolve issues, and improve customer experience. Those things happen in real-time with cloud and on-premise deployment flexibility.
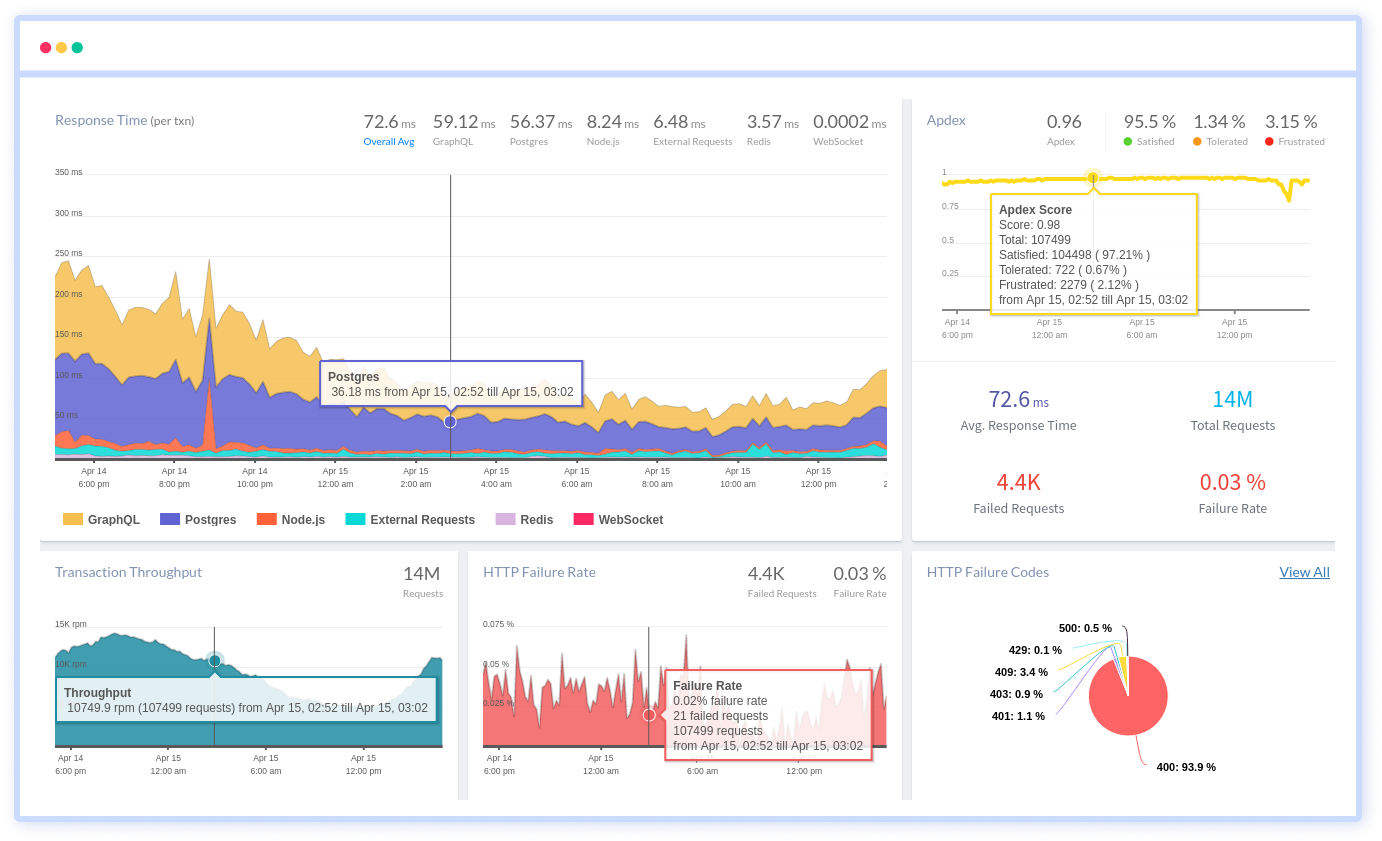
It provides a deep view into all the application performance metrics that are needed to deliver reliable and high-quality software. It gets you notified about the errors as soon as it occurs and provides a detailed list of who, when and what caused the performance damage.
It monitors the application's health and gets notified when an error raised in the user experience. It measures the front-end and back-end application performance and analyses the user satisfaction level using Application Index (Apdex) scores. It resolves performance and availability issues of application before the customer is impacted.
The most important goal of all is to guarantee that customers are getting the best experience out of those applications, no matter what.
#4 Why Atatus?
Atatus provides an application performance monitoring that seamlessly monitors the entire application stack. Collect end-to-end visibility of every transaction and measure how each layer of the application stack affects the customer experience.
Atatus is used to:
- Get the exact code flow of a transaction even when it is slower than the threshold
- View the complete application performance breakdown of where and why the application slows down
- Measure database queries to find out which are slowing down the application
- See network calls from the application to find the impact on the application performance
- Get full-stack application track when exceptions happen with the request details, customer data, etc.
- Look into the deployment history and their performance and impact on the application
- Get the developers notified when an issue occurs through Slack, PagerDuty, email, etc.
#5 Datadog Vs Atatus : Point-By-Point Comparision

i.) Ease of use
Both tools spot intuitive web interfaces that make it easy to speed up the application. Datadog has a straightforward UI and quick dashboard creation capabilities while Atatus has great UI and easy to use. Generally, both solutions great at presenting data to users in an understandable format, make it easy to diagnose performance issues, and collect operational insights. When it comes to installation, Datadog needs a command line for its Windows/Mac installs and its agent installations have been known to be problematic upon setup.
ii.) Pricing
Both Datadog and Atatus are reasonably priced with a low barrier to entry. Datadog's lowest-paid APM plan starts at $49 per host (along with infrastructure), per month with the limit on number of traces. Atatus lowest-paid APM plan starts at $39 per host, per month without any trace limitation and saves 20% when billed annually. Sign-up for a 14-day free trial at Atatus with no credit card policy.
Both vendors offer comprehensive support options for both online and offline customer support.
iii.) Capability Set
Both monitoring tools offer strong APM and reporting capabilities acquire in a streamlined dashboard. When it comes to capability set, Datadog is strong on infrastructure monitoring while Atatus shines brighter for real user applications.
iv.) Community vs Dedicated Support
Datadog is highly active in its community-building efforts and maintains a repository of APIs, libraries, and community contributions to support its platform and customer. Atatus provides dedicated support manager for each account, without the need to choose a higher plan. We take you all the way through on boarding, setting up and making sure you get value from our product.
v.) Integrations
Datadog has more than 400 built-in integrations across all the applications. Atatus also has many integrations that integrate seamlessly across the applications and services. Datadog is available in .NET, Go, Java, PHP, Python, and Ruby.
Atatus integrates with PHP, Java, Node.js, Ruby, Python, .Net, Slack, Asana, Jira, OpsGenie, YouTrack, GitLab, Lighthouse, VictorOps, etc
vii.) Companies That Use It
Datadog and Atatus are widely used among start-ups, medium-sized businesses, and enterprises and their customers certainly increase this broad range.
viii.) Learning Curve
Atatus has been designed to provide an easy and quick account setup to see the health of their entire application stack compared to Datadog.
Summary
Both platforms are competent SaaS-based monitoring platforms known for integrations and customization options. Datadog will get appreciate for its platform’s strengths as a highly extensive IT monitoring service, ideal user base, and operators.
Atatus considered more of a DevOps tool and brings a lot of benefits. Both work well together and implementing the pair as complementary platforms is certainly a viable option as well.
So what do you think? Share your thoughts with us at Atatus.
#1 Solution for Logs, Traces & Metrics
![]() APM
APM
![]() Kubernetes
Kubernetes
![]() Logs
Logs
![]() Synthetics
Synthetics
![]() RUM
RUM
![]() Serverless
Serverless
![]() Security
Security
![]() More
More


![New Relic vs Splunk - In-depth Comparison [2025]](/blog/content/images/size/w960/2024/10/Datadog-vs-sentry--19-.png)
![New Relic vs Sentry - Which Monitoring Tool to Choose? [2025]](/blog/content/images/size/w960/2024/10/VS--1-.png)