How to Diagnose Abnormal Kubernetes Workload Behavior (Step-by-Step)
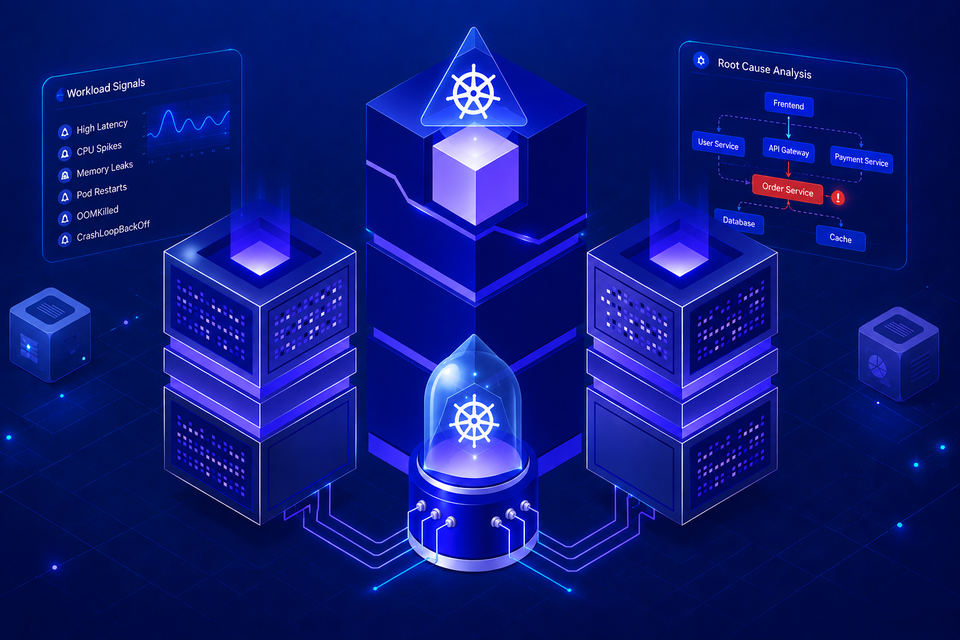
It's 2:14 AM. CPU usage is normal. Memory looks stable. No pods are in CrashLoopBackOff. Every dashboard is green. And yet API latency has doubled, checkout requests are timing out, and your on-call phone won't stop buzzing.
This is the defining trait of abnormal Kubernetes workload behavior: it rarely announces itself through the metrics you already watch. Kubernetes is exceptionally good at reporting whether a pod is running. It is far less good at telling you whether a pod is doing its job correctly. Those are two different questions, and the gap between them is where most production incidents live.
This guide is a practical, engineer-to-engineer playbook for closing that gap: what abnormal workload behavior actually looks like, why metrics-only monitoring misses it, and a repeatable nine-step workflow for going from "something's wrong" to root cause with real Kubernetes scenarios, not theory.
Table of Contents:
- What counts as "abnormal" Kubernetes behavior (and what doesn't)
- Why metrics alone can't tell you what's actually wrong?
- The signals that turn a symptom into a root cause
- Kubernetes symptoms - their likely cause, and what to check first
- A 9-step workflow: from first alert to validated fix
- 6 real incidents: memory leaks, noisy neighbors, broken HPAs, and more
- Metrics vs. logs vs. traces vs. events: when to use each one
- How to prevent abnormal behavior before it happens?
- How Atatus correlates every signal in one dashboard?
- Monitoring vs. observability
- Your questions about diagnosing Kubernetes issues, answered
What counts as "abnormal" Kubernetes behavior (and what doesn't)?
Abnormal workload behavior is any measurable deviation from a workload's expected performance envelope that isn't explained by a proportional change in traffic, load, or deployment intent. A CPU spike during a marketing-driven traffic surge is expected. The same spike at 2 AM with flat traffic is abnormal. Context is what separates the two, and Kubernetes itself doesn't track that context for you.
The common patterns fall into a few families:
- CPU anomalies - sustained throttling, sudden spikes uncorrelated with request volume, or CPU pinned at limit while latency degrades.
- Memory leaks - a slow, steady climb in working-set memory that never returns to baseline, eventually triggering an OOMKill.
- Disk pressure - ephemeral storage or node disk filling from log buildup, orphaned volumes, or unbounded temp file writes.
- Network latency - increased round-trip time between services, often from DNS resolution delays, kube-proxy overhead, or cross-zone traffic.
- Pod restart storms - repeated restarts driven by failing probes, crashes, or resource limits.
- OOMKilled - the kernel terminating a container for exceeding its memory limit.
- CrashLoopBackOff - Kubernetes' backoff state for a container that keeps failing after restart.
- Scheduling failures - pods stuck
Pendingdue to insufficient node resources, taints, or affinity rules. - Replica imbalance - uneven traffic distribution across replicas, often from broken readiness checks or session affinity.
- Resource contention - "noisy neighbor" pods starving others on a shared node.
- Slow services - elevated p95/p99 latency with normal average latency, hiding the problem from average-based alerts.
- Cascading failures - one slow dependency exhausting connection pools or threads in every service upstream of it.
Individually, each of these has a known cause. In production, they rarely occur in isolation, a memory leak causes GC pressure, GC pressure causes CPU spikes, CPU spikes cause slow health checks, and slow health checks cause restart storms. Diagnosing abnormal behavior is really about untangling that chain quickly.
Why metrics alone can't tell you what's actually wrong?
Traditional Kubernetes monitoring such as dashboards, static thresholds, and average-based alerts, tells you that a workload is unhealthy but rarely why. It lacks request-level context, treats averages as representative when they hide outliers, and can't connect a symptom in one service to a root cause in another.
Most teams start with the same stack: a metrics dashboard, a handful of static-threshold alerts, and logs they grep through when something breaks. It works right up until an incident that doesn't match the thresholds you set.
- Metrics show symptoms, not causes. A CPU graph tells you utilization went up. It cannot tell you whether that's from real work, a retry storm, or a stuck goroutine.
- Logs are unstructured and disconnected. Without a shared trace ID, correlating a log line in
service-awith a log line inservice-bduring the same request is guesswork. - Dashboards show the past, not the path. A dashboard can show latency rose at 2:14 AM. It can't show you the single slow database call that caused it.
- Static thresholds miss dynamic systems. A "CPU > 80%" alert is either too noisy during legitimate traffic spikes or too slow during a genuine leak that creeps up over hours.
- Averages hide the outliers that matter. Average latency can look perfectly healthy while p99 latency, the users actually complaining has tripled.
- Missing context. None of the above tell you which deployment, which node, which pod replica, or which upstream dependency is involved, the exact information you need first in an incident.
These aren't reasons to abandon metrics. They're reasons metrics alone were never designed to answer "why," only "what."
The signals that turn a symptom into a root cause: logs, traces, and events
Observability extends monitoring by combining metrics, logs, distributed traces, Kubernetes events, and service dependency maps into one correlated view, connected by shared context like trace IDs, pod labels, and deployment metadata, so an engineer can move from symptom to root cause without switching tools or guessing.
Observability isn't a fourth pillar bolted onto metrics, logs, and traces. It's the practice of correlating all of them, plus Kubernetes-native context, so that an anomaly in one signal can be explained by evidence in another.
- Metrics establish the baseline and flag deviation - the "what."
- Logs provide the detailed, sequential record of what a specific process did - the "what happened, step by step."
- Distributed traces show the path and timing of a request across every service and pod it touched - the "where."
- Kubernetes events capture cluster-level actions: scheduling decisions, OOMKills, probe failures, scaling events - the "what did Kubernetes itself do."
- Dependency and service topology maps show which services call which, so a slowdown in a shared database service can be traced back to every consumer it's affecting.
- OpenTelemetry is what makes this correlation practical at scale: a vendor-neutral instrumentation standard that attaches consistent trace IDs, pod names, namespaces, and deployment labels to every metric, log, and span it emits.
The value isn't any single signal, it's that they share context. A trace ID in a slow request should be the same trace ID you find in the corresponding log lines, and the pod that emitted them should be the same pod flagged in a Kubernetes event. When that thread exists, root cause analysis stops being detective work.
See correlated Kubernetes signals in one place
Atatus brings metrics, logs, traces, and Kubernetes events together with shared context, so you're not tab-switching between four tools during an incident.
Kubernetes symptoms - their likely cause and what to check first
| Symptom | Likely Cause | Observability Signal | Example Investigation |
|---|---|---|---|
| Sudden latency spike, flat traffic | Downstream dependency slowdown | Distributed trace span durations | Trace shows 800ms added in a single downstream DB span. |
| Gradual memory climb over hours | Memory leak in application code | Container memory usage trend + heap metrics | Memory trend correlated against deployment timestamp. |
| Repeated pod restarts | Failing liveness probe under load | Kubernetes events + probe latency | Events show liveness probe failures during CPU throttling. |
| OOMKilled containers | Memory limit set below actual usage | Memory usage vs. limit metric | Usage graph crosses the memory limit minutes before termination. |
| Pods stuck in Pending | Insufficient node resources or affinity mismatch | Scheduler events |
Event log reports FailedScheduling: insufficient CPU.
|
| One pod slower than siblings | Noisy neighbor on a shared node | Per-pod CPU throttling + node saturation | CPU throttling increases only for co-located pods. |
| Elevated p99, normal average latency | Outlier requests hitting a slow execution path | Trace percentile breakdown | Only 1% of traces reveal retry loops against a timing-out cache. |
| Errors after deployment | Broken configuration or faulty rollout | Deployment history + error rate metric | Error rate increases immediately after the rollout timestamp. |
| Cascading errors across services | Connection pool exhaustion from a slow dependency | Service dependency map + error correlation | Dependency map shows errors propagating outward from a single shared service. |
A 9-step workflow: from first alert to validated fix
This is the sequence we recommend to engineering teams for any "something feels wrong" incident, from first alert to validated fix.
Step #1 - Detect the anomaly
Start from an alert or a dashboard deviation, a Golden Signal (latency, traffic, errors, saturation) crossing an unexpected threshold, or an anomaly detection model flagging a pattern break.
Step #2 - Identify the affected workload
Scope the blast radius: which namespace, deployment, and pod replicas are involved. Confirm whether it's one pod, one node, or cluster-wide.
Step #3 - Correlate metrics
Overlay CPU, memory, network, and request-rate metrics for the affected workload in the same time window. Look for what moved first, the earliest deviation is usually closest to the cause.
Step #4 - Analyze logs
Pull logs for the affected pods in that exact window. Filter by trace ID if available to skip irrelevant noise and jump straight to the request path in question.
Step #5 - Inspect traces
Find slow or failed traces from the same window and break down span duration by service. This usually isolates the exact hop such as application code, network, or a downstream dependency, adding the latency.
Step #6 - Check Kubernetes events
Review events for the affected pods and nodes: probe failures, OOMKills, scheduling changes, or HPA scaling activity that lines up with the timeline.
Step #7 - Review deployment history
Check whether a recent rollout, config change, or image update lines up with the onset of the anomaly. Many "mystery" incidents are simply undetected regressions from the last deploy.
Step #8 - Locate root cause
By this point you should have a single, evidence-backed explanation, connecting the metric deviation, the log entries, the trace span, and (if relevant) the Kubernetes event.
Step #9 - Validate the fix
After remediation, confirm the same metrics, traces, and events return to baseline, and add or tighten an alert so the same pattern is caught earlier next time.
6 real incidents: memory leaks, noisy neighbors, broken HPAs, and more
Scenario #1: The slow-burning memory leak
A payments service showed no errors and stable CPU, but restart counts crept up daily. Memory metrics plotted over a 7-day window (not the default 1-hour view) revealed a clean sawtooth pattern: memory climbing steadily, then dropping sharply at each OOMKill-triggered restart. Correlating the slope's start date against deployment history pointed to a release that had introduced an unbounded in-memory cache.
Scenario #2: The slow database everyone blamed on the API
API latency alerts fired for a checkout service. Metrics showed CPU and memory well within limits. Distributed tracing showed the application code itself completed in under 20ms and the remaining 600ms was a single database query span. The root cause was a missing index after a schema migration, invisible to any Kubernetes-level metric.
Scenario #3: Noisy neighbor on a shared node
One replica of a service was consistently slower than its siblings despite identical code and identical traffic share. Per-pod CPU throttling metrics showed the slow replica was being throttled far more than the others, while node-level saturation on that specific node was elevated by an unrelated batch job co-scheduled on it. Adding pod anti-affinity resolved it.
Scenario #4: Misconfigured HPA causing thrashing
A service scaled up and down every few minutes under steady traffic, causing intermittent latency spikes as new pods joined mid-scale. HPA event history showed the scaling metric (CPU) was too volatile for the configured target, reacting to short GC pauses instead of sustained load. Switching the HPA target to a custom request-rate metric stabilized it.
Scenario #5: A broken deployment hiding behind a healthy rollout
A canary rollout showed 100% pod readiness, but error rates for a subset of requests climbed. Readiness probes were checking a shallow /healthz endpoint that didn't exercise the code path that broke. Traces showed errors concentrated in requests hitting a specific new feature flag path, which logs then confirmed was throwing on a missing environment variable in the new pods only.
Scenario #6: Node disk pressure from log buildup
Multiple unrelated pods on one node began getting evicted. Kubernetes events showed DiskPressure on the node itself, not application-level errors. Infrastructure-level disk metrics traced it to a single misbehaving sidecar writing unbounded debug logs to an emptyDir volume.
Metrics vs. logs vs. traces vs. events: when to use each one
Metrics
- What it tells you: Aggregate numerical trends such as CPU, memory, request rate, error rate, latency percentiles over time.
- When to use it: First response to any alert, and for capacity planning.
- Limitations: No request-level detail; averages can mask outliers; can't explain causation on its own.
Logs
- What it tells you: A sequential, detailed record of discrete events inside a process.
- When to use it: After metrics narrow the time window and workload, to see exactly what the application reported.
- Limitations: High volume, unstructured by default, and hard to correlate across services without shared trace IDs.
Traces
- What it tells you: The full path and timing of an individual request as it moves across services, pods, and nodes.
- When to use it: To pinpoint exactly which hop introduced latency or an error.
- Limitations: Requires instrumentation (ideally via OpenTelemetry) across every service in the path; sampling can miss rare outlier requests if not tuned carefully.
Kubernetes events
- What it tells you: Cluster-control-plane actions like scheduling decisions, probe failures, OOMKills, scaling activity.
- When to use it: To confirm whether Kubernetes itself took an action (like a kill or eviction) that explains the symptom.
- Limitations: Short retention window by default; needs to be exported and stored to be useful in retrospective analysis.
Profiles
- What it tells you: Where CPU time or memory allocation is actually being spent inside application code, at the function level.
- When to use it: When metrics and traces confirm a service is the bottleneck but don't explain why.
- Limitations: Adds overhead if run continuously; most useful as a targeted, on-demand tool during investigation.
Dependency and service topology maps
- What it tells you: Which services call which, and how failures or latency in one radiate to others.
- When to use it: During cascading failures, to identify the shared upstream dependency causing widespread symptoms.
- Limitations: Only as accurate as the instrumentation coverage across the mesh; gaps in tracing create blind spots in the map.
How to prevent abnormal behavior before it happens?
- Set accurate resource requests and limits. Requests too low cause scheduling on overcommitted nodes; limits too low cause avoidable OOMKills.
- Tune HPA on the right metric. CPU-based scaling reacts poorly to bursty or GC-heavy workloads; consider custom metrics like request rate or queue depth.
- Use Pod Disruption Budgets. Prevent voluntary disruptions (node drains, upgrades) from taking down too many replicas at once.
- Separate liveness from readiness probes meaningfully. Liveness should only fail on true deadlock; readiness should fail whenever the pod can't serve traffic correctly.
- Instrument with OpenTelemetry from day one. Retrofitting tracing after an incident is far harder than building it in during service development.
- Alert on symptoms, not just resource thresholds. Golden Signals (latency, traffic, errors, saturation) catch user-facing problems that raw CPU/memory alerts miss.
- Define SLOs, not just SLAs. Error budgets give teams an objective, shared threshold for "abnormal" instead of relying on gut feel.
- Track RED metrics per service. Rate, Errors, Duration - the minimum viable signal set for any request-driven workload.
- Track USE metrics per resource. Utilization, Saturation, Errors - the minimum viable signal set for infrastructure like nodes, disks, and network.
How Atatus correlates every signal in one dashboard?
Every workflow step above depends on being able to move between signals without losing context. That correlation is the actual engineering problem Atatus is built to solve for Kubernetes teams:
- Kubernetes Monitoring gives you cluster, node, and pod-level metrics with Kubernetes-native labels already attached, so a CPU spike is immediately scoped to the right namespace and deployment.
- Distributed Tracing follows a request across every service it touches, so you can see the exact span.
- Log Management correlates log lines to the same trace ID and pod that appear in your metrics and traces, cutting out the manual grep-and-guess step.
- Infrastructure Monitoring surfaces node-level saturation and disk pressure that explain noisy-neighbor and eviction scenarios.
- Native OpenTelemetry support means you can standardize instrumentation once and get metrics, logs, and traces flowing into one correlated view without vendor-specific SDKs.
- Service Dependency Maps visualize which services call which, so cascading failures are traceable back to the shared dependency causing them.
- Root Cause Analysis tooling surfaces the deployment, event, or resource change that lines up with an anomaly's onset, instead of leaving you to eyeball timestamps across four dashboards.
- Real-time Alerts on Golden Signals and Kubernetes events (OOMKills, probe failures, scheduling issues) catch abnormal behavior before customers do.
- AI-assisted incident investigation surfaces likely correlated signals automatically when an anomaly is detected, shortening the manual step-by-step workflow above.
- Unified observability dashboard keeps metrics, logs, traces, and events in one place, so the workflow in this article takes minutes instead of tool-switching across separate systems.
Monitoring vs. observability
| Traditional Monitoring | Full Observability |
|---|---|
| Metrics only | Metrics + Logs + Traces + Events, all correlated |
| Reactive. Problems are often discovered after user complaints. | Proactive. Anomalies are detected before they affect users. |
| Static thresholds tuned through trial and error. | Golden Signals and anomaly-based alerting reduce false positives. |
| Manual investigations across multiple disconnected tools. | Correlated telemetry enables faster root cause analysis from a single view. |
| Average metrics can hide outlier performance issues. | Percentile-based insights reveal the true end-user experience. |
| Root cause depends on intuition and tribal knowledge. | Evidence-based troubleshooting using shared trace IDs across every telemetry signal. |
Start monitoring Kubernetes workloads with Atatus
Identify abnormal behavior before it impacts users including correlated metrics, logs, traces, and events in one dashboard.
Your questions about diagnosing Kubernetes issues, answered
1. What causes abnormal Kubernetes workload behavior?
It usually stems from resource contention, memory leaks, misconfigured probes, noisy-neighbor pods, node pressure, broken deployments, or downstream dependency failures. It rarely has a single cause, which is why correlated metrics, logs, and traces are needed to isolate it.
2. Why aren't metrics alone enough to diagnose Kubernetes issues?
Metrics show that something crossed a threshold, not why. They lack request-level context, so two services can show identical CPU graphs while one is healthy and one is stuck in a retry loop. Logs and traces supply the missing context.
3. How do I find the root cause of a Kubernetes incident faster?
Follow signal order: detect with metrics, scope to a workload, correlate logs and traces in the same time window, then check events and deployment history. It's fastest when every signal shares the same trace or request ID.
4. How can I detect memory leaks in Kubernetes?
Plot container memory usage over hours or days, not minutes. A true leak shows a steady upward slope that never returns to baseline, eventually ending in an OOMKilled event. Correlate the trend against deployment timestamps to find the release that introduced it.
5. What causes Kubernetes pod restart storms?
Failing liveness probes under load, OOMKills from low memory limits, crash loops from bad configuration, or a downstream dependency timing out and cascading into health-check failures.
Conclusion
Observability isn't optional for modern Kubernetes systems anymore, it's the only practical way to keep root cause analysis time from growing with your cluster's complexity. A single metric dashboard was enough when systems were simple. It isn't anymore. What resolves incidents fast now is correlated metrics, logs, traces, and events that all point to the same story, in the same time window, for the same pod.
The workflow in this guide such as detect, scope, correlate, investigate, confirm, fix, validate works with any observability stack. It works faster with one built to correlate signals automatically instead of leaving that work to you at 2 AM.
Correlate metrics, logs, and traces without switching tools
Related Reading
#1 Solution for Logs, Traces & Metrics
 APM
APM
Kubernetes
Logs
Synthetics
RUM
Serverless
Security
More