OpenTelemetry, straight into Atatus
Point your OpenTelemetry SDKs or Collector at otel-rx.atatus.com. Traces, metrics and logs from Java, Python, Node.js, Ruby, PHP and .NET services land in one place, joined by trace id.

Your pipelines. Our endpoint.
Send OTLP through a Collector or straight from the SDK. Switch a part off and see which signal stops.
- traces: receivers [otlp] processors [resource, batch] exporters [otlphttp/atatus]
- metrics: receivers [otlp] processors [resource, batch] exporters [otlphttp/atatus]
- logs: receivers [otlp] processors [resource, batch] exporters [otlphttp/atatus]
- traces371 spans/s
- metrics1,830 points/s
- logs878 lines/s
about 4 requests/s, batched
- service.name
- checkout-api
- telemetry.sdk.language
- java
- env
- prod
- version
- 1.0.0
Four SDKs. One trace.
Each service passes the W3C traceparent header on. The trace id stays, the parent changes, and the spans join up.
traceparent: 00-4bf92f3577b34da6a3ce929d0e0e4736-e5f6a7b8c9d0e1f2-01Setup guidesJavaSpring BootTomcatJBossPythonDjangoFlaskJavaScriptExpressNestJSNext.jsAngularRailsPHP.NETNGINXCollector config
Your OTel spans, as one trace.

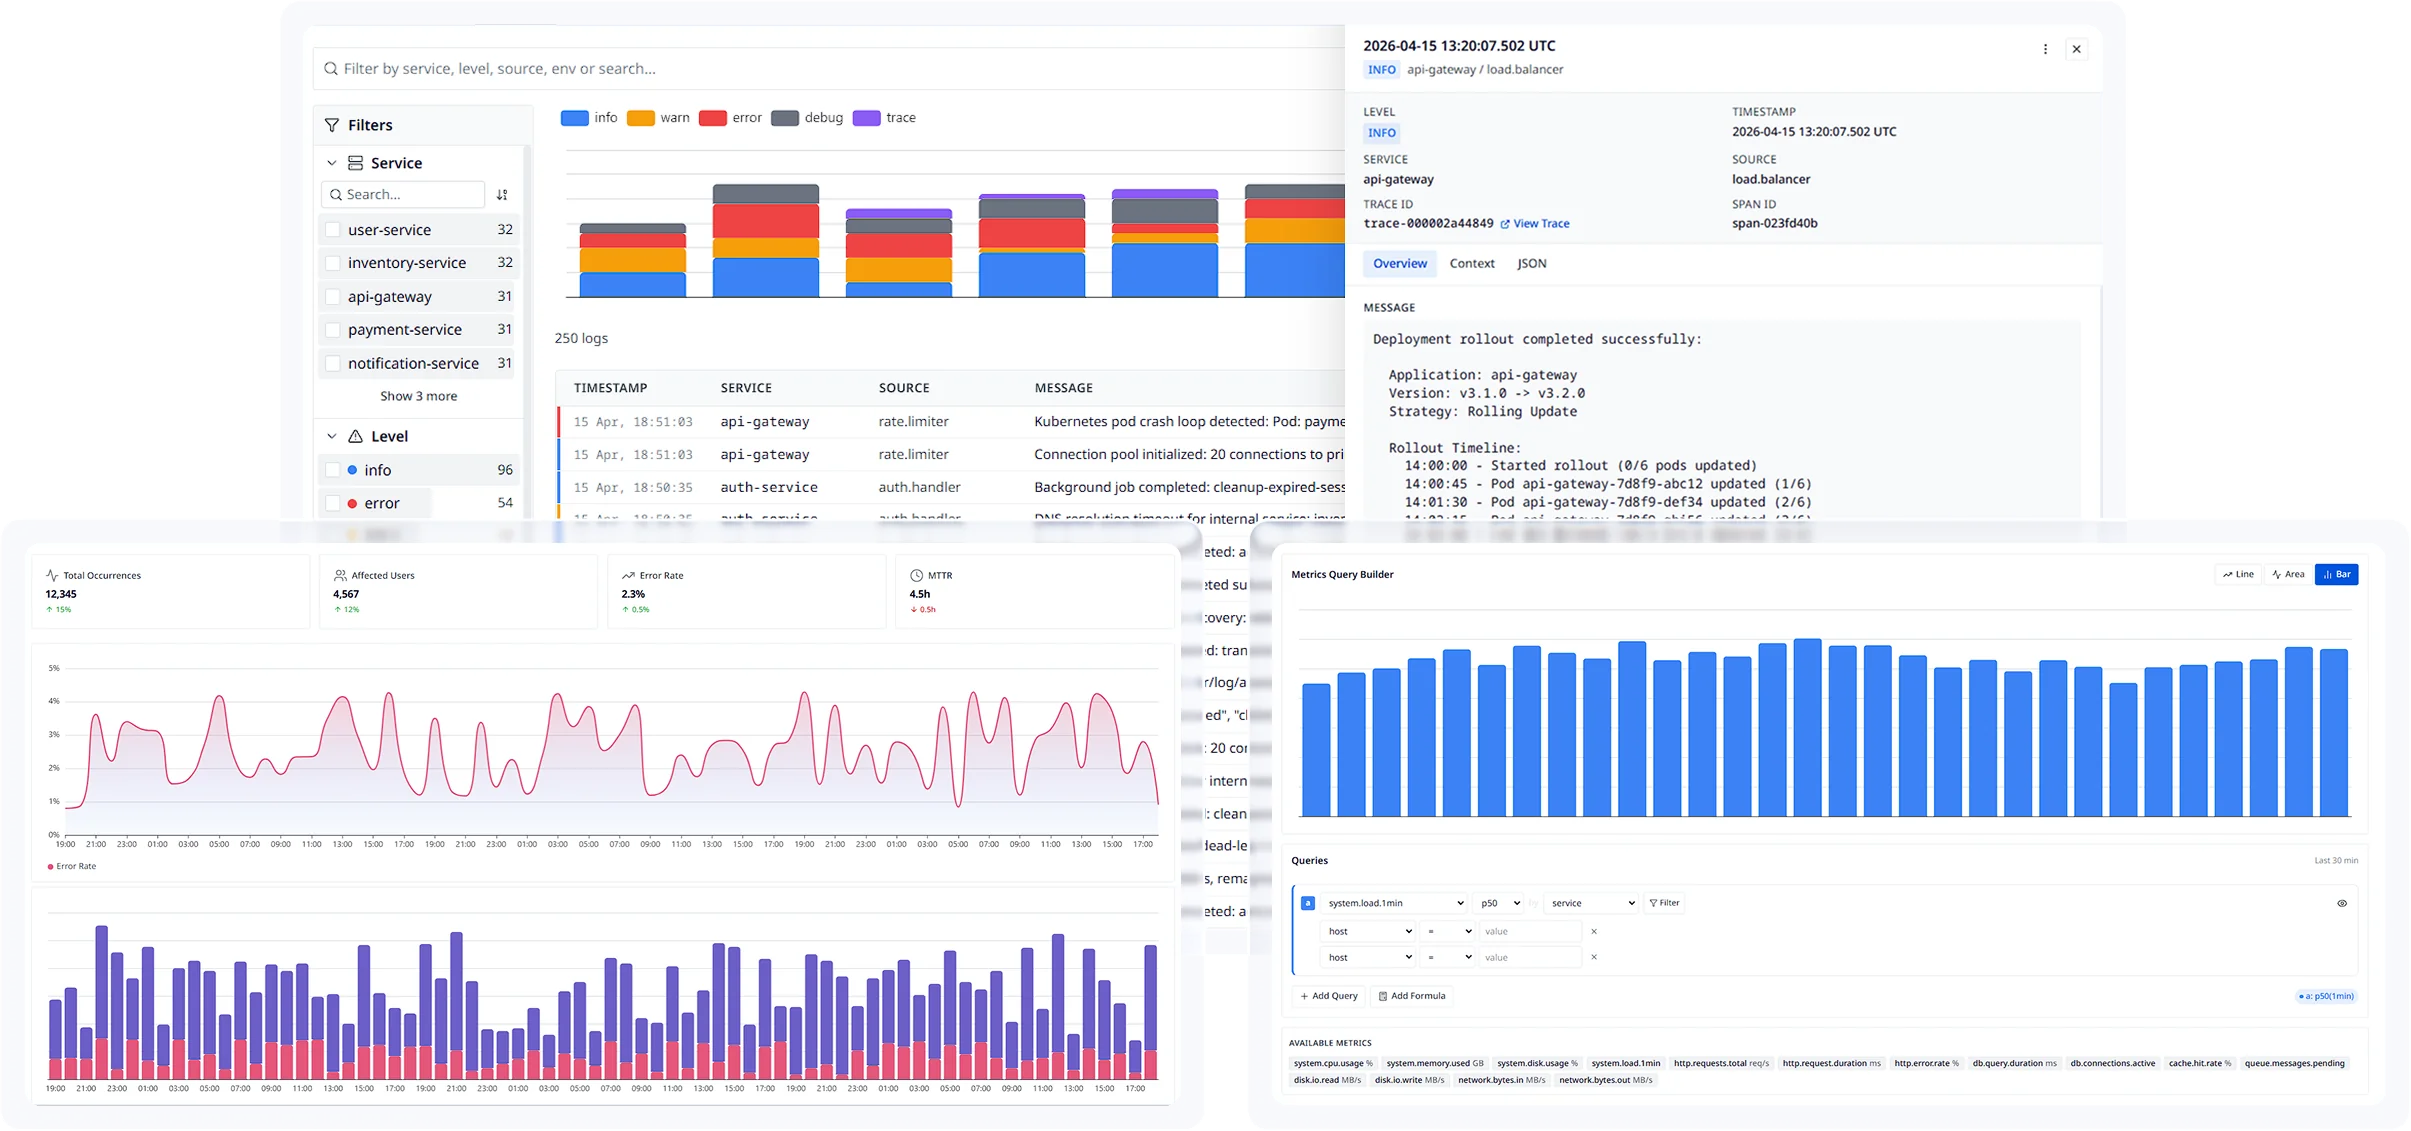
OpenTelemetry, screen by screen.
Real screens from the Atatus app.
Questions about OpenTelemetry
Pricing, deployment, data and the agent. If something is missing, a person will answer it on a demo call.
OpenTelemetry (OTel) is an open-source, vendor-neutral framework backed by the CNCF for collecting traces, metrics and logs. It gives you one set of SDKs and one data format, so you can change your observability backend without re-instrumenting your code.
Yes. Atatus accepts OTLP traces, metrics and logs straight from OpenTelemetry SDKs or through an OpenTelemetry Collector. The endpoint is https://otel-rx.atatus.com over HTTP, with your Atatus API key in the api-key header.
Yes. Java services run with the OpenTelemetry Java agent jar, and Node.js services can use @opentelemetry/auto-instrumentations-node with no code changes. Point the exporter at Atatus with OTEL_EXPORTER_OTLP_ENDPOINT and OTEL_EXPORTER_OTLP_HEADERS.
No. SDKs can export straight to otel-rx.atatus.com. The Collector is optional and useful when you want one place to batch data, add resource attributes such as env and version, and run separate pipelines for traces, metrics and logs.
Atatus has OpenTelemetry guides for Java (Spring Boot, Tomcat, JBoss), Python (Django, Flask), JavaScript (Express, NestJS, Next.js, Angular), Ruby on Rails, PHP and .NET, plus NGINX, AWS Lambda (Node.js, Python, Java) and Google Cloud Functions (Node.js).
In Atatus, go to Settings, then Account Settings, then API Keys. Create a key or copy an existing one with write permission, and send it as the api-key header from your SDK or Collector exporter.