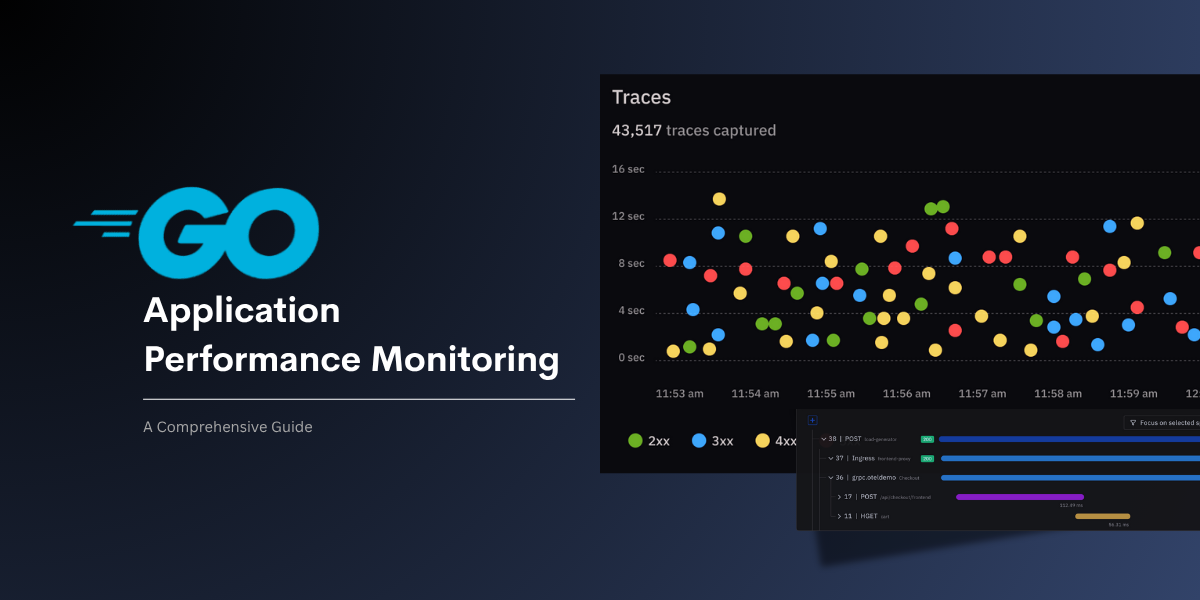
Golang Application Performance Monitoring: A Comprehensive Guide
Application Performance Monitoring (APM) refers to the practice of tracking, analyzing, and optimizing the performance and availability of software applications. When it comes to Go (Golang), a language known for its concurrency, speed, and efficiency, APM becomes crucial to ensure that your applications stay fast, reliable, and scalable under real-world loads.
APM in Go involves monitoring the runtime behavior, request response times, system resource usage, and error patterns across your application. It helps developers and DevOps teams gain full visibility into what is happening inside their Go apps, especially when dealing with microservices, APIs, and cloud-native deployments.
In this blog, you will learn how Go’s architecture impacts performance, explore essential APM practices like metrics collection, distributed tracing, and logging, and discover how tools like Atatus can help monitor and optimize your Go applications effectively.
In this Blog Post,
- Understanding Go Application Performance
- Key Pillars of Go Application Performance Monitoring
- Choosing the Right APM Tool for Go Applications
- Best Practices for Go Application Performance Monitoring
- Get Started with Atatus for Go Monitoring
Understanding Go Application Performance
To monitor and improve the performance of Go applications, it’s important to understand how the Go runtime works under the hood. Three key areas, concurrency, memory management, and profiling have a direct impact on how efficiently your app runs. These areas are highly relevant for APM tools, as they help detect and resolve real-world performance issues like latency, crashes, and resource overuse.
Go’s Concurrency Model: Goroutines and Channels
Go’s concurrency model based on goroutines and channels allows applications to handle many tasks simultaneously with high efficiency. This is a major reason why Go is used for building fast, scalable systems.
In real-world applications, poor goroutine or channel usage can cause performance issues like memory overuse, blocking operations, or slow response times. APM tools play a crucial role here by monitoring:
- Goroutine counts and growth
- Blocking or stuck operations
- Channel contention or deadlocks
By observing these patterns, APM solutions help identify concurrency-related bottlenecks before they impact users or stability.
Memory Management and Garbage Collection in Go
Go uses an automatic Garbage Collector (GC) to manage memory by cleaning up unused objects during runtime. This simplifies development but can introduce latency if not managed well.
APM tools track key GC metrics like pause time, heap size, and allocation rate. Monitoring these helps identify memory inefficiencies that may affect application responsiveness, especially under high load. This allows developers to fine-tune memory usage and reduce performance impact from frequent GC cycles.
Profiling in Go with pprof
pprof is Go’s built-in tool for profiling runtime performance. It helps developers analyze things like CPU usage, memory allocations, and blocking operations.
While pprof is mainly used during debugging or performance tuning, many APM tools either integrate with it or provide similar profiling features. This allows teams to drill down into performance issues, like slow functions or resource leaks, when high-level APM metrics show unusual behaviour.
Key Pillars of Go Application Performance Monitoring
Effective monitoring of Go applications relies on three fundamental pillars: metrics, logs, and traces. Together, they form the backbone of observability, providing comprehensive insights into application behavior, performance, and reliability.
1. Metrics:
Metrics are numerical indicators that provide a high-level view of your application's performance over time. They are essential for tracking trends, detecting anomalies, and setting up alerts.
Common Go application metrics include:
- Response time – Time taken to process requests.
- Throughput – Number of requests handled per second.
- Error rate – Frequency of failed requests.
- CPU and memory usage – Resource consumption patterns.
- Goroutine count – Indicates concurrency load and potential leaks.
Metrics offer real-time visibility into system behavior and are critical for identifying performance degradation, resource bottlenecks, or traffic anomalies.
2. Logs:
Logs are detailed, timestamped records that capture events within your application as they happen. They play a critical role in understanding the behavior of your application during execution, especially when diagnosing issues or investigating incidents.
In Go, logging can start with the standard log package, but production-grade applications often use more advanced libraries like Zap or Logrus. These libraries support structured logging, typically in formats like JSON, which makes it easier to parse, filter, and analyze logs in centralized logging systems.
By providing both context and sequence, logs enable engineers to trace the flow of operations, identify failure points, and correlate events across different services. When integrated with an APM solution, logs complement metrics and traces by offering the why behind anomalies and performance issues.
3. Traces:
Traces provide a detailed map of how a request moves through your application, from the initial entry point to every downstream service, database call, or internal function it touches. This level of visibility is particularly valuable in distributed systems, where a single request might span multiple microservices or cloud components.
Using distributed tracing tools like OpenTelemetry, Jaeger, or Atatus APM, you can measure the latency of each operation within a request path. This helps identify which services or functions are slowing things down and how individual components contribute to the overall response time.
By visualizing this end-to-end journey, tracing enables teams to pinpoint performance bottlenecks, slow dependencies, and unusual delays that aren’t obvious from logs or metrics alone.
An APM platform such as Atatus, which integrates metrics, logs, and traces into a unified interface, enables engineering teams to efficiently detect, analyze, and resolve performance issues, proactively maintaining system reliability and ensuring a seamless user experience.
Choosing the Right APM Tool for Go Applications
Selecting the appropriate Application Performance Monitoring (APM) solution for Go applications requires a careful evaluation of several critical factors. These include real-time performance insights, effective visualization, alerting mechanisms, scalability, integration flexibility, and overall usability. Given Go’s unique concurrency model and performance characteristics, your APM tool should also be well-suited to handle its high-throughput nature.
1. Real-Time Monitoring and Intelligent Alerting
An effective APM tool should offer real-time visibility into key performance metrics, such as response times, error rates, and resource utilization. It should also support:
- Customizable alerting to notify teams when thresholds are breached.
- Anomaly detection to catch unusual patterns automatically.
- Root cause analysis, to accelerate incident resolution.
2. Data Visualization and Dashboarding
Clear, intuitive dashboards are essential for understanding performance trends and spotting bottlenecks quickly. Look for tools that offer:
- Customizable dashboards tailored to your application’s metrics.
- Granular views of service, transaction, and infrastructure-level data.
- Advanced analytics and reporting for deeper insights.
3. Scalability and Ecosystem Integration
- Your chosen APM tool should be able to handle your application's growth, both in terms of traffic and complexity.
- Seamless integration with your existing tech stack, including programming languages (like Go), frameworks, cloud providers, and CI/CD pipelines, is essential.
- Look for tools that support open-source observability frameworks like OpenTelemetry for consistent data collection.
4. Usability and Cost Efficiency
The tool should be easy to deploy, configure, and use with minimal overhead on your team’s workflows. Evaluate:
- User experience and setup complexity for developers and DevOps teams.
- Consider the pricing model (e.g., per host, per data point) and ensure it aligns with your budget and usage patterns.
- Don't forget to evaluate the level of customer support and community engagement offered by the vendor.
5. Specific Considerations for Go:
- Go's concurrency model and potential for high throughput require APM tools that can handle a large volume of data and metrics.
- Some APM tools offer specialized support for Go, including tracing and profiling, which can be invaluable for optimizing performance.
- Consider tools that provide insights into specific Go features like goroutines and channels.
Choosing the right APM tool helps your team monitor Go applications more effectively and fix issues before they impact users. A platform like Atatus, which supports Go and offers complete visibility, makes it easier to track performance and keep your application running smoothly as it grows.
Before making a decision, consider trying a free trial to see how well the tool fits your application's needs and your team's workflow.
Best Practices for Go Application Performance Monitoring
Define Clear Objectives and Goals
- Set clear, measurable, and achievable performance monitoring goals using the SMART framework.
- Align these goals with user expectations and industry standards to ensure relevance and impact.
- Focus your monitoring efforts on the most critical business processes and areas that directly affect user experience.
Target the Right Metrics
- Identify and track key performance indicators (KPIs) that influence user experience and business outcomes.
- Metrics to prioritize include response times, error rates, throughput, resource usage, and user engagement.
- Incorporate both real user monitoring and synthetic transaction tests to capture a full picture of performance.
- Avoid tracking too many metrics, focus on those that yield actionable insights.
Implement Proactive Monitoring and Alerting
- Configure alerts for anomalies and critical performance issues to enable fast resolution.
- Strike a balance between automated alerts and human review to prevent alert fatigue and ensure important issues are addressed.
- Use real-time dashboards to visualize performance trends and diagnose issues quickly.
- Leverage telemetry data, logs, metrics, and traces for deeper insight into system behaviour.
Ensure End-to-End Visibility
- Monitor the application across all layers, including frontend, backend, and infrastructure.
- Use distributed tracing to follow request flows and identify slow points across services.
- Combine infrastructure monitoring with application-level data for a complete performance overview.
Adopt a User-Centric Approach
- Focus on performance and stability from the end-user’s perspective.
- Track real user behaviour and gather feedback to continuously improve the experience.
- Pay special attention to high-impact user journeys and interactions that directly affect satisfaction and business results.
Embrace Continuous Improvement
- Routinely analyze performance data to find and address optimization opportunities.
- Adapt your monitoring approach as your application, technology stack, and business needs evolve.
- Encourage close collaboration between development and operations teams to resolve performance issues efficiently.
Leverage the Right Tools and Technologies
- Choose APM tools that support features like distributed tracing, profiling, and hybrid environment monitoring.
- Opt for solutions with built-in support for Go frameworks, libraries, and commonly used databases.
- Automate data collection, alerting, and reporting to improve consistency and reduce manual workload.
Get Started with Atatus for Go Monitoring
Monitoring your Golang applications with Atatus gives you full-stack visibility, without modifying your code. From distributed tracing and database insights to real-time error tracking and alerting, Atatus helps you detect issues faster, optimize performance, and deliver reliable user experiences.
Start your free trial today and see how Atatus simplifies Go performance monitoring.
#1 Solution for Logs, Traces & Metrics
APM
Kubernetes
Logs
Synthetics
RUM
Serverless
Security
More


![New Relic vs Splunk - In-depth Comparison [2026]](/blog/content/images/size/w960/2024/10/Datadog-vs-sentry--19-.png)